Showing posts with label market commentary. Show all posts

Sunday, July 05, 2020

Technology Play: Which Sub-sectors or Stocks to Buy?

Last week, tech stocks have chalked up significant gain. If you wondering how to identify laggard tech stocks to add to your portfolio or watch list, this is one way you can consider.

Firstly, you need to identify which sub-sectors have shown out-performance. The Technology sector is divided into 4 sub-sectors: Digital Services, Semiconductors, Software and Technology Equipment. Below I have shown the steps to look at one of the sub-sectors, Digital Services. Then you choose "Price Change" and sort it by "Descending" order to filter out the out-performers.  


Diagram 1: How to pick out stocks in a sub-sector within the Technology sector

Below are the tables of out-performers for all the 4 sub-sectors of the Technology sector. You would notice that there are more gainers among the "Semiconductor" and "Technology Equipment" sub-sectors. This is not surprising as Malaysia is stronger in manufacturing than software or services.


Table 1: Top performers in the Digital Services sub-sector within the Technology sector


Table 2: Top performers in the Semiconductor sub-sector within the Technology sector
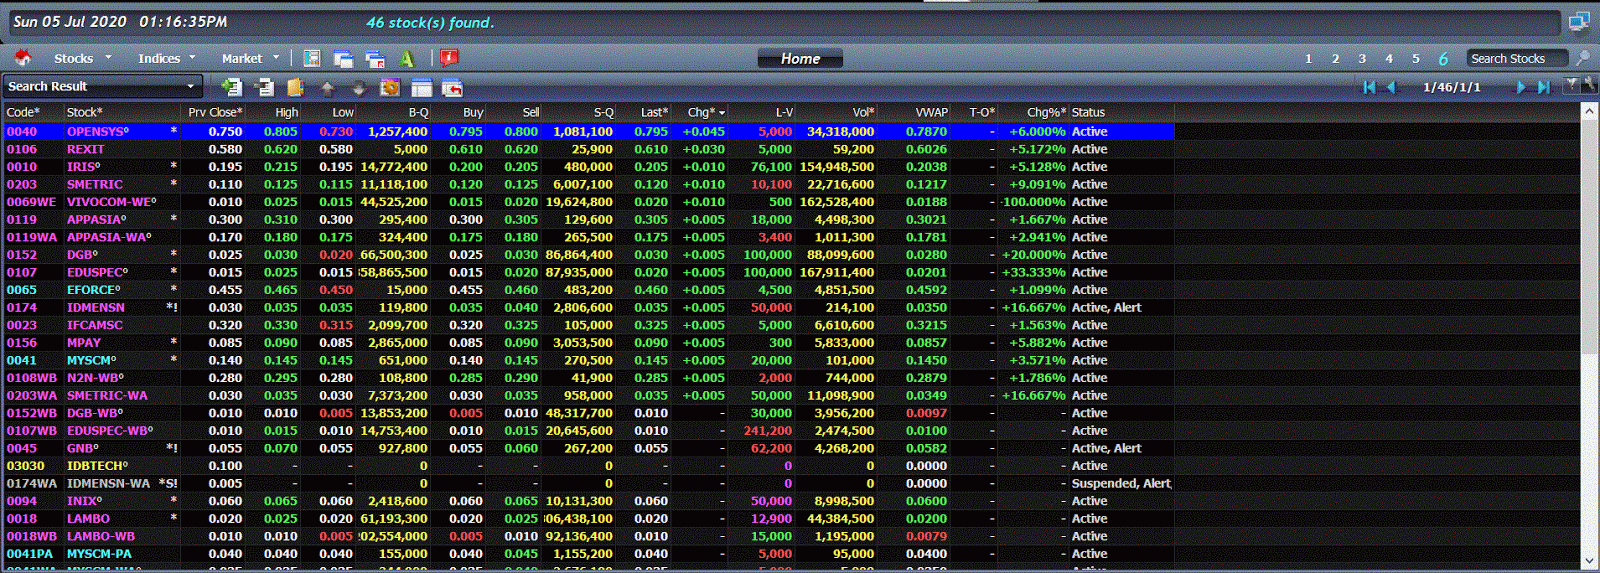

Table 3: Top performers in the Software sub-sector within the Technology sector
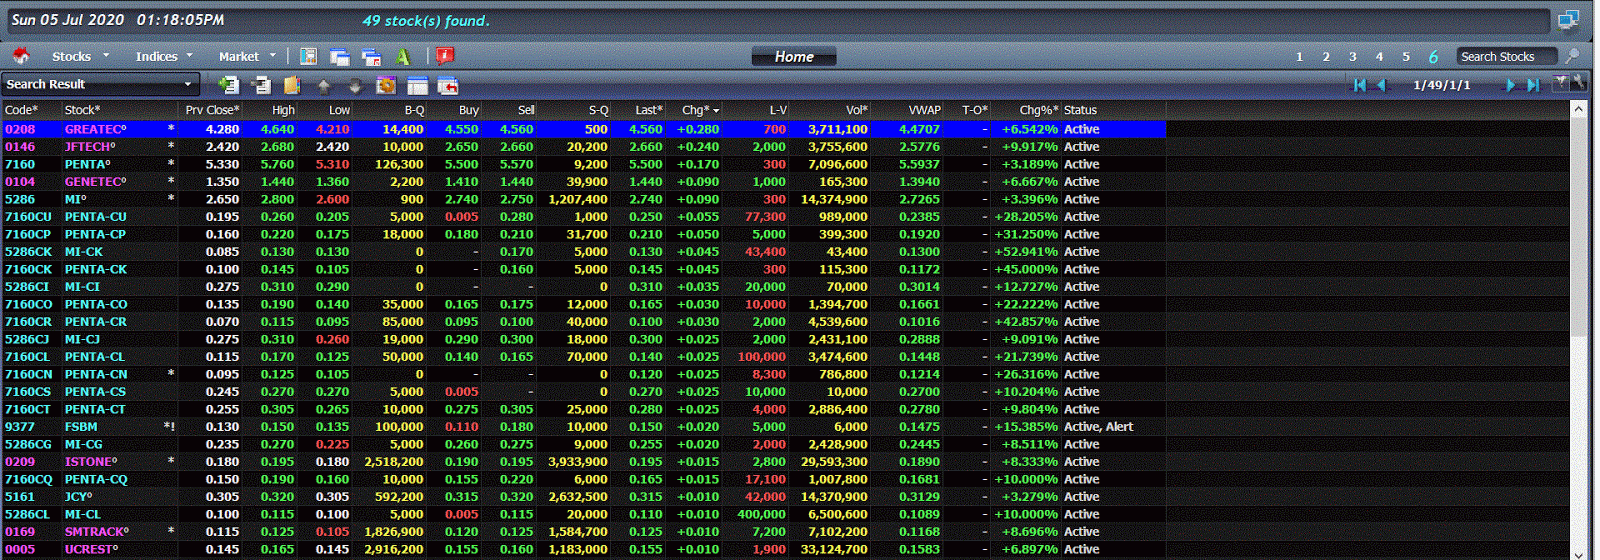

Table 4: Top performers in the Technology Equipment sub-sector within the Technology sector

After you have narrowed down the out-performing sub-sectors, you can choose the stocks to track or to buy. Assuming you want to buy the laggards; you should study their financial performance and the reason for their poorer financial performance. If you feel that the poorer financial performance may change, and the company's financial position is fairly sound, then you may position yourself in these laggards and wait for their turn to go higher.

You may try the same approach for Health Care sector. You will soon get the confirmation that this sector is pretty much all about glove stocks.

Diagram 2: How to pick out stocks in a sub-sector within the Health Care sector


Table 5: Top performers in the Health Care Equipment & Services sub-sector within the Healthcare sector

Look at the long list of out-performing glove stocks & related CWs above. The laggards among the glove stocks are not really laggards nor are they cheap. In my opinion, the whole glove stocks universe has gone up so much that you have to accept them not as value stocks, but as growth stocks which come with a high premium. The high premium can be justified if the earnings growth continues. If it stopped - or the market perceived that it may stop - the rollback can be very sharp.

That's what happened in late June when the market learned that glove prices have softened (here). Since then, the share prices rallied again, which could only mean that the report of the softening of glove prices was wrong or exaggerated. Anyway, that's the risk that you have to take if you get into glove stocks now.

The above are the steps that you can use to identify the out-performing sub-sectors in the Technology and Health Care sectors, and then you can pick up certain stocks to buy or track according to your investing or trading strategy. Good luck!

Thursday, June 25, 2020

PERMAJU: A Warning!

The euphoric rally among 3rd liner stocks experienced in the past 1-2 months has generated much excitement in the market. Some of these stocks have doubled up in a matter of days, with no regards to fundamental. This may come to an end soon.

As the harsh economic reality starts to bite, weaker companies would have to raise funds to tie over the dry months and years ahead. An example is PERMAJU which is now implementing a Rights issue of Irredeemable  Convertible Preference Shares (RCPS) at an issue price of RM0.05 each (which comes with free warrant) on the basis of 10 RCPS together with 1 free warrant for every 2 shares owned. The ex-date for this Rights issue is on July 13. You can see the announcement of the ex-date on Bursa Malaysia on June 19 (here) triggered the sell-down of the stock.

Chart: PERMAJU's daily chart as at June 24, 2020 (Source: Malaysiastock.biz)

On the other hand, there are a few stocks that tried to avoid calling for Rights issues. Instead they chose to raise fund by way of private placement. Their share prices rallied in the past few days. Examples are CNASIA and IRIS. The logic, if you accept it as logical, is that the major shareholders have to push up the share price in order to induce investors to buy into the private placement. Sometimes this effort of logic works. Oftentimes, it doesn't. As Abraham Lincoln once said; “You can fool some of the people all of the time, and all of the people some of the time, but you can not fool all of the people all of the time.”  

Be careful out there.

Wednesday, April 29, 2020

Push & Dump Operation in Progress

If you looked at the losers with volume, you would see the top 5 securities are CIMB, VIS, TECFAST, VIS-WB and SINOTOP. If you look at the charts for VIS, TECFAST and SINOTOP, you will notice huge volume accompanying the spike in share price yesterday.

We could well be witnessing push and dump operation here as retail investors or punters rush into the market under the belief that they have missed out on the cheap prices. Be careful! 

Chart: Sinotop, Tecfast & VIS's daily chart as at 29 April 2020 (Source: Kenanga BTX)


Thursday, February 13, 2020

Covid-19: Why the Surge in Daily New Cases & Daily Deaths?

This morning, the numbers reported in worldometers.info jumped sharply due to a new diagnosis classification adopted. The daily new cases soared to 15110, which pushed up the total cases from 45170 on Feb 11 to 60280. The daily deaths also jumped to 252, which caused the total deaths to rise from 1114 on Feb 11 to 1367.

However, the sudden surge was due to a new diagnosis classification adopted by the Chinese authority. In Hubei province, this re-classification contributed 15110 cases to the daily new cases and 242 deaths to daily deaths on Feb 12 for today. Below you will see the charts for daily new cases and deaths as reported as well as adjusted to exclude the impact of the new classification.


Chart: Covid-19's Daily New Cases & Death and adjusted for new classification

For those who like to see numbers, here's the table.


Table: Covid-19's Daily New Cases & Death and adjusted for new classification

From the above table, we can see daily new cases has plunged from around 2000 to 270 while daily deaths has dropped from about 100 to 9.

Based on the above, it is safe to say that the situation continues to improve.

Tuesday, February 11, 2020

Novel Coronavirus Outbreak: Signs of Improvement

The novel coronavirus outbreak has brought fear and panic all over the world, especially in East Asia. Last weekend, we saw the panic-stricken citizens of our normally calm & steady Southern neighbor, Singapore rushing to buy up household goods & groceries in their supermarkets. The fear & panic warranted  an address to the nation by the Prime Minister of Singapore to calm their flared nerve.

This panic is fed by a sudden jump in new cases reported in the republic as well as various alarming reports that this new strain of flu virus will soon turn into a pandemic. Reports from government leaders and health authorities were over-shadowed by numerous reports or videos circulating in the social media that the condition is far worse than reported. 

In times like this, we must also seek out less extreme reports to get at the real situation. There are a few positive news which got pushed aside, such as the steady drop in new cases reported (here and here) or the promising recovery rates (here) or comments from experts who are satisfied with the drastic measures taken by the Chinese authority to tackle the outbreak. Finally, I did my own study on the virus based on data from worldometer.info (here). See the charts for yourself.

1. The uptrend in daily new cases reported has peaked by Feb 6.


2. While the number of deaths has increased steadily, the mortality rate has eased off from the initial phase of the outbreak to a low of about 0.23-0.26% over the past 5-6 days. While this is quite encouraging, I take this data with a pinch of salt because the base (Total Cases reported) gets bigger over time. 


3. What is hardly mentioned is the total recovery cases (in the green box), which has jumped from 1541 to 3996 from Feb 6 to Feb 10! Don't just look at the total deaths (in the red box)!


One of the more level-headed articles that I have read is from Dr. Elisabeth Rosenthal, who reported on the 2003 SARS outbreak. As someone who had lived thru that outbreak - as her family was staying with her in China at that time - she can write with first-hand knowledge of how to survive a new flu virus. Her recommendation to readers was simply not to panic. Check out her article (here).

While I am a layman in the field of disease or health matters, my knowledge of the market and investment history tells me that the share prices have been hammered sufficiently over the past 2-3 weeks that the risk reward proposition is now in your favor to slowly buy into the market. You need to be patient in this market as I still expect it to trade sideways for the next few months- awaiting more positive news from the containment of this virus as well as from the recovery in the economy.

Thursday, January 09, 2020

Market Observations after the 1st Round of Blows Between the U.S. & Iran

Following the Iranian retaliation - after the assassination of Iranian Major General Qasem Soleimani by U.S. forces - stock markets tumbled worldwide. Bursa suffered the same fate, with our FBMKLCI dropping 21.9 points to 1589.1. Losers outnumbered gainers by 883 to 171.

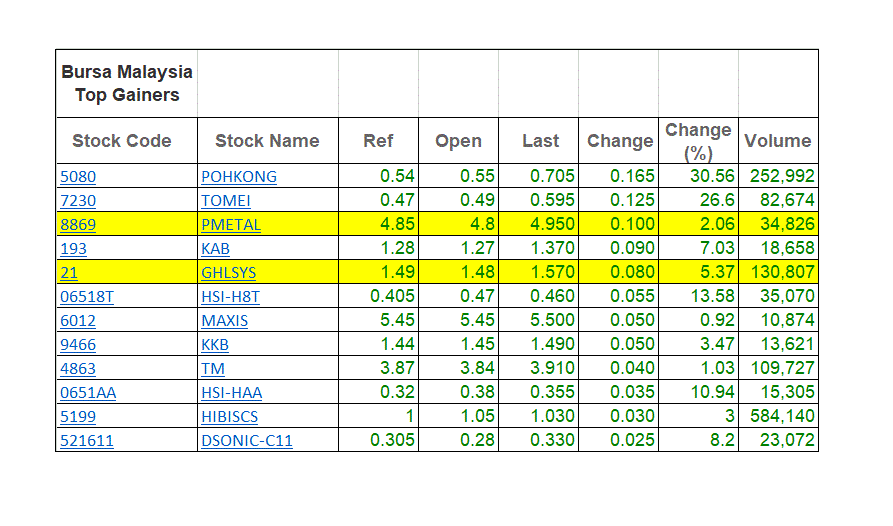
I have appended below is the table of gainers with volume. Ignoring the usual suspects, such as O&G stocks, gold trading stocks and Hang Seng put warrants, we have 2 gainers that warrant our attention, namely PMETAL and GHLSYS.


Table: Bursa's top gainers with volume on January 8, 2020

1) PMETAL

This stock is testing the line connecting its recent peaks at RM4.90-5.00. The likely reason for this hurried aggressive buying could be traders or investors positioning themselves to benefit for a bullish breakout in the price of aluminum.


Chart 1: PMETAL's weekly chart as at Jan 8, 2020 (Source: Malaysiastock.biz)


Chart 2: PMETAL and Aluminum's weekly chart as at Jan 8, 2020 (Sources: Malaysiastock.biz & Investing.com)

2) GHLSYS

2 days ago, GHLSYS, in partnership with Mastercard, has launched a tokenized e-payments solution that offers simpler, more secured and seamless digital payment experiences for consumers (here). This could be the next earning boost for the company, which has seen a steady rise in earnings since FY2012.


Chart 3: GHLSYS's weekly chart as at Jan 8, 2020 (Source: Malaysiastock.biz)


Graph: GHLSYS's rolling 4-Q revenue & profits for last 49 quarters

Based on the aggressive buying behavior observed yesterday, which was a pretty negative trading day, I say these 2 stocks could continue to see bullish buying support in the days ahead.

Tuesday, March 19, 2019

Dayang's Correction: Nothing Out of the Ordinary

I read Mr. Koon's article entitled Dayang: Devious Tricks to Buy at Cheaper Prices (here) with amusement just before the market re-opened in the afternoon. I re-read the article 5 minutes ago and was simply stunned by the concluding remark:

Unless the author, editor, directors and Kenanaga (sic) Investment Bank can confirm that they do not have Dayang share, I will not believe the published article is not another skilful use of underhand trick to buy Dayang at cheaper prices.      
That was a very strong statement from Mr. Koon. He was referring to this report by Kenanga entitled Dayang Enterprise Holding- Take Profit From This Rally (here).

Mr. Koon has rightly called a BUY on Carimin earlier and followed up on that success with a buy call on Dayang. Both calls were spot on, and he moved in quickly to build up a big position which proved to be very profitable.

I do not agree with his strongly-worded attack on Kenanga. Kenanga is in the business of advising the clients on maximizing their profit- be that short-term or long-term. Any one with a few years of investing experience can tell you that Dayang has overshot its fair value past few days and was due for a correction. The Kenanga analyst, who I have not met even though we are "colleagues", merely pointed out that the risk of a correction may out-weigh the risk of further price gain. Thus, it is sensible to take some profit and wait for a lower price to re-enter the stock or to re-deplore the sale proceed to another stock which may give a better return.

Having said that, I'm always a big fan of Mr. Koon. His analysis are both sharp and incisive, and most importantly he put his money where his mouth is. I wish Mr. Koon continued success in his investment, and look forward to more sharing from him.

O&G Play to Take a Break

The first sign that O&G play was long in the tooth was when Perdana -which is related to current champion of the O&G, Dayang - started to moe move up on Mar 13.


Chart 1: Perdana's daily chart as at Mar 19, 2019_10.43am (Source: Malaysiastock.biz)

Today we saw the champion, Dayang breaking its "psychological level" of RM1.50.


Chart 2; Dayang's daily chart as at Mar 19, 2019_10.43am (Source: Malaysiastock.biz)

There will be technical rebound here and there as those who missed out on the play will try to get. I think this correction can be very deep and bloody. It is better to ignore the temptation to buy into the falling O&G stocks for next few days.

Thursday, November 15, 2018

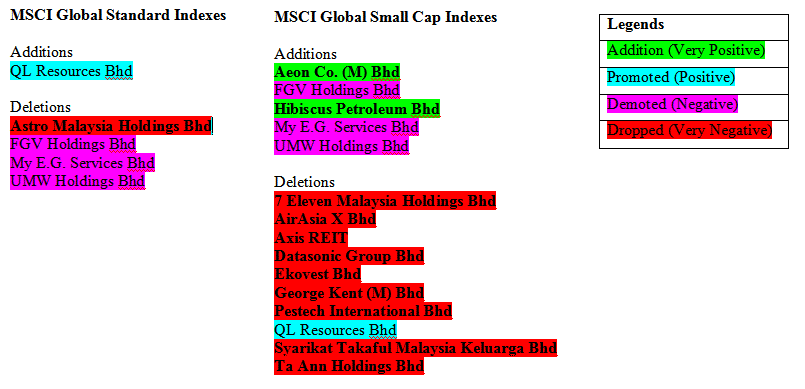
MSCI Global Indexes Component Stocks Changes

Yesterday, MSCI has announced changes in the component stocks from Malaysia in its Global Standard Index and Global Small Cap Index. For more, go here.

I have summarized the changes for your easy viewing below. This should not be taken as a guide for buying and selling immediately, but to understand the reasons behind some of the price rallies or declines in the market for the past few days or weeks. For example, I feel that QL is running ahead of its valuation while Astro is certainly very attractive at the current price. Should you buy into QL or sell out your Astro? I don't think you should do either one if you are investing long-term.


Tuesday, April 03, 2018

Riding the Play of Inclusion in FBMKLCI

Last week, The Edge Financial Daily published an article entitled 10 companies' market cap overtakes FBM KLCI members'. The list is appended below, and I have highlighted the 3 stocks that may be included as component stocks (see green arrows) and 3 stocks that may be excluded (see red arrows).


From The Edge Financial Daily

Since the publication of this article, 2 of the possible new candidates for inclusion into FBMKLCI, Harta & Dialog have rallied strongly while 2 of the possible components of FBMKLCI that may be excluded, i.e. AMBANK and Astro have dropped quite sharply.

Of these 4 stocks, it must be noted that Harta is experiencing a over-factoring since its share price has rallied earlier due to a bonus issue. On the hand, Astro - the midget in the entire list - had reported an improved financial performance but nevertheless was bashed down to a new low since its re-quotation in 2012.

It must be noted that market capitalization is one of the 4 criteria for selection as a component stocks for FBMKLCI; the other being free float, liquidity & investability. In the hurry-burry world, we can get care-away by a rising stock or spooked by a declining issue. Let's not forget that the value of a stock is a function of its financial performance and underlying assets.

Wednesday, December 06, 2017

Sime Beauty Contest: The Winner(s) are...

As at 12.30pm, SIMEPLT and SIMPROP closed higher at RM4.81 & RM1.17. These prices are also higher than the intra-day high recorded yesterday: RM4.79 for SIMEPLT and RM1.16 for SIMEPROP. On the other hand, SIME showed weakness by failing to rise above yesterday close. (Note: The strength of SIME on the first day of re-quotation was due to the availability of a 17-sen dividend which went ex on Dec 4.)


Table: SIME, SIMEPLT & SIMEPROP's prices for the past 3 & 1/2 days


Chart: SIME, SIMEPLT & SIMEPROP's 15-min chart (Source: Malaysiastock.biz)

Based on this price action today, I believe the sell-down for SIMEPLT and SIMPROP could be over. Those who like to get into a pure play stock - be it plantation or property stock - can consider SIMEPLT or SIMEPROP. The recent low - at RM4.58 for SIMEPLT and RM1.04 for SIMEPROP - may mark the low for the stocks for a while. The good entry for these stocks could be their intra-day high yesterday: RM4.79 for SIMEPLT and RM1.16 for SIMEPROP. Good luck!

Note:
I hereby confirm that I do not have any direct interest in the security or securities mentioned in this post. However, I could have an indirect interest in the security or securities mentioned as some of my clients may have an interest in the acquisition or disposal of the aforementioned security or securities. As investor, you should fully research any security before making an investment decision.

Monday, March 27, 2017

TIME TO INVEST IN THE MARKET

If you have been following this blog on and off, you could have invested in the market 5-6 months ago. I have been sounding out the case for a buy for quite a while. For example, I made this comment in October last year:
Everyday I hear my fellow remisiers and investors bemoan the sad state of our stock market. Who can blame them since our stock market has been drifting lower for the past 3 years! Today, I'm going to make a case that our market could have made a bottom and we could see the start of the recovery by the end of the year.
Today, the Edge Daily has a very good infographic on why and how you should invest in the stock market. It is very good information which I shall shamelessly copy & paste it here. If you are still not invested in the market, it's not too late to do so. You can follow the advice given by investing in the broad market. For example, you can invest in the top 30 stocks by buying FBMKLCI-EA or invest in the top companies in ASEAN by buying CIMBA40.


The last infographic is a gentle reminder to all investors - even speculators - to choose slow and steady return over fast and furious profit. You will do well to avoid exciting stocks that promise quick profit and tipsters with the next hot stock to will make you a fortune.

Good luck to your investment!!

Wednesday, March 22, 2017

Beware of "Pump & Dump" Scheme

This morning we received an industry communication letter from BURSA MALAYSIA about the manipulative activities known as "Pump & Dump" scheme. The same warning has also appeared in The Star (here).

This scheme is the updated version of stock tips that you used to get from your friends or colleagues or brother-in-law years ago. You are your only safeguard. If you find the "news" to be too good to be true, then chances are it is not true. However if you feel that the news is a good opportunity, you must do one of two things:
1) If it is a tip about a big project, verify the source of the tip.
2) If it is a case about a big jump in profit, verify the thesis of investment.
In nexttrade, I do not peddle tips; only logical investment thesis or market observations.

Finally, you must exercise caution not to invest all your money in one or two investment ideas. Always diversify your investment so that you can take a hit even after all your careful study or investigation.


Wednesday, July 13, 2016

BNM Reduced OPR to 3%


Bank Negara Malaysia has just reduced the Overnight Policy Rate (OPR) to 3% at its Monetary Policy Committee (MPC) meeting (here). The Property stocks are up as shown by the jump in the Properties Index below.


Chart: Properties Index's 30-min chart as at July 13, 2016_3.40pm (Source: Shareinvestor.com)

The broad market should respond according to this positive monetary move.

BAT, DIGI & Genting: Breakout?

A few stocks rallied to their downtrend lines. Let's take a look at 3 in particular.

1) BAT

I doubt it can break above the intermediate downtrend line at RM55.00. It may consolidate at RM52.00-53.00.


Chart 1: BAT's weekly chart as at July 13, 2016_11.00am (Source: Shareinvestor.com)

2. DIGI

DIGI managed to break above the intermediate downtrend line at RM4.80. It may test the RM5.00 and consolidate between RM4.80-5.00. If it managed to break above RM5.00, it may consolidate above the RM5.00.


Chart 2: DIGI's weekly chart as at July 13, 2016_11.00am (Source: Shareinvestor.com) 

3. Genting

Genting broke above its downtrend line at RM8.10 on Monday. This morning, it broke above the horizontal line at RM8.20. It may have a chance to test its next resistance from the horizontal line at RM8.60.


Chart 3: Genting's weekly chart as at July 13, 2016_11.00am (Source: Shareinvestor.com) 

Note: 

In addition to the disclaimer in the preamble to my blog, I hereby confirm that I do not have any relevant interest in, or any interest in the acquisition or disposal of, BAT, DIGI & Genting. 

Wednesday, April 20, 2016

Some Calls That Didn't Work Out

The last 2-3 weeks saw mixed result for my stock calls. Poor stock calls are not desirable and cannot be avoided completely. When I made a call which did not work out, I feel bad for my customers and my readers. Some readers would make sure I get the message, such as this one:


I have taken another look at 2 recent calls that did not pan out. The first one is HSL which is the largest construction company in Sarawak. HSL was expected to secure many contracts for the construction of the Pan Borneo Highway. After it  secured 2 packages from that highway project, the share price rallied to what I thought was a breakout level: the psychological RM2.00. When the breakout happened, I thought it would be the start of its next upleg. Besides price action, the MACD crossed above MACD signal line. Alas, the stock failed to stay above the breakout level and has since dropped back to the 10, 20 & 30-week SMA lines at RM1.90. I think this cluster of support would hold and the stock will probably stage a recovery from here.

Looking back, one could argue that this timid stock had an earlier upside breakout of its downward channel at RM1.95 in January. The good news of its securing 2 big contracts was just enough to push the price up to its 2013 high of RM2.15. At that point, its gun-shy shareholders quickly seized the opportunity to take profit?!!


Chart 1: HSL's weekly chart as at Apr 19, 2016 (Source: ShareInvestor.com)

Next, Sasbadi. This promising educational stock broke above the strong resistance from the horizontal line at RM1.40. The upside breakout of the resistance, which checked the rise of Sasbadi 4 times in the past 9 months, could well be the flag-off for the continuation of its prior uptrend! Well, it didn't happen. On hindsight, one can argue that the poor volume was a sign that follow-through could be a problem.


Chart 2: Sasbadi's weekly chart as at Apr 19, 2016 (Source: ShareInvestor.com)

Looking at these calls reminded me of a conversation I had with one of my businessman clients many years ago. He told me that he didn't like to have bad debts. Who does?! He said, the only sure way of not having bad debts is to be super-cautious. However, when you are super-cautious, you lose business. As a businessman, you never want to lose good business. So instead of comparing bad debts with not having any bad debt, you should weigh the cost of bad debts against the cost of business foregone. The same may well apply to stock trading.

To the above reader wrote in, I like to say thank you for the opportunity to explain my predicament.

Note:
In addition to the disclaimer in the preamble to my blog, I hereby confirm that I do not have any relevant interest in, or any interest in the acquisition or disposal of, HSL & Sasbadi.