Monday, December 30, 2019

CPO's Fantastic Rally

On October 24, CPO finally launched into an upswing after it broke above the horizontal line at RM2250. Today, after ten weeks of steady rise, CPO has cracked above the psychological RM3000 mark. It is now testing the downtrend line, RR at RM3050. This downtrend line stretches back all the way to March 2008!! Can the rally break above this formidable downtrend line?

Chart 1: CPO's weekly chart as at 30 Dec 2019_3.00pm (Source: Investing.com)

Chart 2: CPO's monthly chart as at 30 Dec 2019_3.00pm (Source: Investing.com)

Kenanga has rightly called this rally in early November. The research analyst picked 3 stocks to ride the CPO rally. They are HSPLANT, TAANN and KLK. The huge rally in these stocks can be clearly seen below. 

Chart 3: HSPLANT's daily chart as at 30 Dec 2019_3.00pm (Source: Malaysiastock.biz)

 Chart 4: KLK's daily chart as at 30 Dec 2019_3.00pm (Source: Malaysiastock.biz)


Chart 5; TAANN's daily chart as at 30 Dec 2019_3.00pm (Source: Malaysiastock.biz)

If CPO were to consolidate after testing the downtrend line at RM3050, the lofty prices of many of the plantation stocks will likely to retrace. I believe that some profit-taking now may be a good idea.

Tuesday, December 24, 2019

Merry Xmas & Happy New Year

I like to wish all my readers a Merry X'mas and a Happy New Year.


Wednesday, December 18, 2019

KBUNAI: Last Opportunity To Exit A Delisted Stock


Karambunai Corp Bhd (Short name: KBUNAI or stock code: 3115) has been taken private and was delisted on November 21 this year (here).

Minority shareholders, who have not accepted the offer and are now stuck with the shares, can still sell off the stock by accepting the offer to buy from the major shareholder. The deadline is February 5, 2020. (here)

Follow the guidelines laid down here. In brief, you need to do the following:

1. Accept the offer as per the Shareholder's Notice

2. Transfer the shares to the offeror by submitting a transfer request at your stockbroker.


3. Mail the duly completed Shareholder's Notice and a copy of the processed transfer request to the registrar, BINA MANAGEMENT (M) SDN BHD before February 5, 2020.


KBUNAI was the second company that Dr. Chen has taken private. The first company was PTGTIN. Dr. Chen, who made his fortune from his casino venture in Cambodia, is reported to have a substantial stake in another listed company, FACBIND. Will this be the next target to be privatized? We will wait and see. Go here to read more about this interesting businessman who is in "the springtime of his business career".

Tuesday, December 17, 2019

Scientx: Earnings Dipped Sequentially

Result Update

For QE31/10/2019, Scientx's net profit rose 51% y-o-y to RM81 million on the back of a 23%-increase in revenue to RM877 million. When compared to the immediate preceding quarter, QE31/7/2019, net profit dropped 39% while revenue was down 7%.  The q-o-q decrease in revenue was mainly due to lower progress billings recognized for the property division. In line with the lower revenue recognized in current financial quarter, profit before taxation for the current financial quarter was RM116 million compared to the preceding financial quarter of RM177 million.


Table: Scientex's last 8 quarterly results


Graph: Scientex's last 57 quarterly results

Financial Position

As at 31/10/2019, Scientex's financial position is deemed satisfactory with current ratio at 1.2 times and gearing ratio at 0.7 time.

Valuation

Scientex (closed at RM9.53 today) is now trading at a trailing PE of 13.4 times (based on last 4 quarters' EPS of 70.99 sen). At this PER, Scientex is deemed fairly attractive.

Technical Outlook

Scientx is in an uptrend which has been capped by the horizontal line at RM9.40-9.50. If Scientx cannot charge above this resistance, its uptrend will continue.


Chart: Scientex's monthly chart as at Dec 17, 2019 (Source: Malaysiastock.biz)

Conclusion

Based on good financial performance, strong financial position, fairly attractive valuation and positive technical outlook, Scientex remains a good stock for medium to long-term investment.

Note:
I hereby confirm that I do not have any direct interest in the security or securities mentioned in this post. However, I could have an indirect interest in the security or securities mentioned as some of my clients may have an interest in the acquisition or disposal of the aforementioned security or securities. As investor, you should fully research any security before making an investment decision.

Wednesday, December 11, 2019

BAUTO: Revenue & Earnings Fell Sharply

Results Update

For QE31/10/2019, BAuto's net profit dropped 60% q-o-q or 72% y-o-y to RM20.4 million while revenue dropped 15% q-o-q or 34% y-o-y to RM457 million.

Group revenue dropped 14.5% q-o-q mainly attributed to lower sales volume recorded from the domestic operations, partially offset by higher revenue recorded from the Philippine operations. Lower sales volume from the domestic operations mainly due to the resolution of certain pricing issues, which delayed the sale of CX-8 vehicles during the quarter. Higher sales volume from the Philippine operations mainly due to the favourable response on the all new Mazda3 that was launched during the quarter under review. The Group pre-tax profit for the current quarter under review has reduced by RM35.8 million or 55.1% mainly due to lower profit contribution from the domestic operations as a result of lower sales volume and lower margin arising from absorption of higher costs on the new facelift Mazda CX-5 model compelled by the current market sentiments.


Table: BAuto's last 8 quarters' financial performance


Graph: BAuto's last 30 quarters' financial performance  

Financial position

As at 31/10/2019, BAuto's financial position has deteriorated with current ratio at 1.90 times and total liabilities to total equity at 1.17 times.

Valuation

BAuto (closed at RM2.15 yesterday) has a fair PER of 11.8 times (based on last 4 quarters' EPS of 18.28sen). BAuto paid quarterly dividends which totaled 21 sen over the past 4 quarters. This translates to a dividend yield of 9.8%. Based on the above, BAuto is an attractive stock.

Technical Outlook

BAuto peaked at RM2.75 in July this year. Since then, it has been declining steadily. Its immediate support is at RM2.00.


Chart: BAuto's weekly chart as at Dec 10, 2019 (Source: Malaysiastock.biz)

Conclusion

Based on weaker financial performance, I revised my rating for BAUTO to a HOLD. BAuto is still a good stock for long-term investment based on attractive valuation.

Note:

I hereby confirm that I do not have any direct interest in the security or securities mentioned in this post. However, I could have an indirect interest in the security or securities mentioned as some of my clients may have an interest in the acquisition or disposal of the aforementioned security or securities. As investor, you should fully research any security before making an investment decision.

Tuesday, December 10, 2019

SCGM: Earnings Increased Sharply

Results Update

In QE31/10/2019, SCGM's net profit rose 83% q-o-q or 144% y-o-y to RM4.0 million while revenue declined 4% q-o-q or 7% y-o-y to RM54 million. The q-o-q decline in revenue was attributed to lower sales contribution from non-customized F&B packaging i.e. lunch boxes, cups and plates. The Group recorded a profit before tax of RM4.2 million in 2Q20, compared to profit before tax of RM2.2 million in 1Q20, in line with lower raw material prices, lower interest expense, higher gain on foreign exchange and higher amount of doubtful debts recovered in 2Q20.

 
Table: SCGM's last 8 quarterly results

 
Graph: SCGM's last 39 quarterly results

Financial Position

SCGM's financial position is deemed adequate with current ratio at 1.26 times while gearing ratio is elevated at 0.87 time.

Valuation

SCGM (closed at RM1.56 yesterday) is now trading at a PE of 26X (assuming the last 2 quarters' EPS can be maintained for a full year).  At this PE, SCGM is deemed fully valued.

Technical Outlook

SCGM broke above its downtrend line at RM0.80 in September. After the breakout, SCGM began a steep uptrend which nearly doubled in price. Its immediate resistance will be from the horizontal line at RM1.60.


Chart 1: SCGM's weekly chart as at Dec 9, 2019 (Source: Malaysiastock.biz)


Chart 2: SCGM's daily chart as at Dec 9, 2019 (Source: Malaysiastock.biz)

Conclusion

Based on improved financial performance & bullish technical outlook, SCGM is a good stock for long-term investment.

Note:

I hereby confirm that I do not have any direct interest in the security or securities mentioned in this post. However, I could have an indirect interest in the security or securities mentioned as some of my clients may have an interest in the acquisition or disposal of the aforementioned security or securities. As investor, you should fully research any security before making an investment decision.

Sunday, December 08, 2019

QL: Quarterly Revenue Crossed the Billion Mark!

Results Update

For QE30/9/2019, QL's net profit increased by 38% q-o-q or 15% y-o-y to RM69 million while revenue increased by 8% q-o-q and 17% y-o-y to RM1.073 billion. The result was announced on November 29.


Table: QL's last 8 quarterly results

From the graph below, we can see that QL's quarterly revenue has surpasssed the RM1 billion mark though quarterly profits are shy of its recent new high!!


Graph: QL's last 46 quarterly results

Financial Position

As at 30/9/2019, QL's financial position is deemed satisfactory, with current ratio at 1.58 times and gearing ratio at 0.92 time.

Valuation

QL (closed at RM7.45 last Friday) is now trading at a PE of 52 times (based on last 4 quarters' EPS of 14.33 sen). At this PER, QL is more than fully valued.

Technical Outlook

QL is steady uptrend, and is poised to test its all-time high of RM7.58 which was recorded in November 2018.


Chart: QL's weekly chart as at Dec 6, 2019 (Source: Malaysiastock.biz)

Conclusion

Based on satisfactory financial performance, QL can be a good stock for long-term investment. Its demanding valuation makes it very difficult to call a BUY on the stock. For now, it deserves a HOLD rating because of its promising technical set-up for an upside breakout of its all-time high.

Note:

I hereby confirm that I do not have any direct interest in the security or securities mentioned in this post. However, I could have an indirect interest in the security or securities mentioned as some of my clients may have an interest in the acquisition or disposal of the aforementioned security or securities. As investor, you should fully research any security before making an investment decision.

Friday, November 29, 2019

KPJ: Earnings Growth Continued

Result Update 

For QE30/9/2019, KPJ's net profit rose 11% q-o-q or 12% y-o-y to RM46 million while revenue rose 7% q-o-q or 10% y-o-y to RM906 million. Group revenue rose 10% revenue due to the increase in number of patient visits, radiology cases and surgeries especially for KPJ Johor, KPJ Selangor and KPJ Rawang. The new addition to the Group’s group of hospitals, KPJ Batu Pahat, which commenced its operation on 18 September 2019, also contributed to the improved revenue of the period. Increased activities within the support companies also contributed to the revenue growth.

Profit before tax recorded 16% increase to RM69.3 million during this quarter from RM59.9 million in the same quarter in 2018 led by the increase in revenue by 10%. Despite the fact that the increase in profit before tax has been set-off by the MFRS 16 impact recognized during the quarter especially on depreciation and finance costs amounting to RM9.7 million and RM14.0 million respectively, the Group managed to set higher profit before tax margin with 7.9% as compared to last year’s 7.5%. This was due to cost optimization and initiatives from the hospitals as well as better performance by support companies.


Table: KPJ's last 8 quarterly results


Graph: KPJ's last 47 quarterly results

Financial Position

As at 30/9/2019, KPJ's financial position is deemed adequate with current ratio at 1.15 times while gearing ratio was elevated at 2.03 times.

Valuation

KPJ (closed at RM0.905 yesterday) is now trading at a PE of 21 times (based on last 4 quarters' EPS of 4.31 sen). At this PER, KPJ is fully valued.

Technical Outlook

KPJ has been moving sideways for the past 5-6 years. If it can break above the high achieved during the past 5-6 years at RM1.15-1.20, KPJ's uptrend can begin.


Chart: KPJ's monthly chart as at Nov 28, 2019 (Source: Malaysiastock.biz)

Conclusion

Based on improving financial performance and exposure to a growing consumer service sector, KPJ could be a good stock for long-term investment. However, its high valuation and neutral technical outlook mean that the stock is likely to trade sideways around RM0.90-1.10 for a while longer.

Note:
I hereby confirm that I do not have any direct interest in the security or securities mentioned in this post. However, I could have an indirect interest in the security or securities mentioned as some of my clients may have an interest in the acquisition or disposal of the aforementioned security or securities. As investor, you should fully research any security before making an investment decision.

HEIM: Earnings Soared

Results Update

In QE30/9/2019, HEIM's net profit increased by 31% q-o-q or 57% y-o-y to RM103 million while turnover rose 18% q-o-q and y-o-y to RM602 million. Revenue grew by 18% y-o-y, mainly driven by improved sales performance across all core brands and new product launches. Excluding the Sales and Services Tax (“SST”) impact, the Group revenue grew by 11%. Group profit before tax (“PBT”) rose 39% on the back of revenue growth and improved cost efficiency as well as the timing of commercial spend for new product launches executed in Q3.


Table: HEIM's last 8 quarterly results

 
Graph: HEIM's last 56 quarterly results

Financial Position

As at 30/9/2019, Heim's financial position is deemed adequate with current ratio at 0.94 time while gearing ratio was at 2.06 times. Under a less-than capable management, I would rate these ratios should be a concern. However, Heim -like Nestle - is a well-managed MNC which capital management is carried out to maximize return to shareholders. Thus, its capital structure & working capital management is performed to an "extreme" to weed out unnecessary fat.

Valuation

HEIM (closed at RM25.90 yesterday) is now trading at a trailing PER of 24.3 times (based on last 4 quarters' EPS of 106.52 sen). Its dividend yield is decent at 3.7%. Based on PER and DY, HEIM is deemed fairly attractive.

Technical Outlook

HEIM is in an long-term uptrend line. Its immediate support comes from the horizontal line at RM25.00.


Chart: HEIM's weekly chart as at Nov 28, 2019 (Source: MalaysiaStock.Biz) 


Conclusion

Based on good financial performance, fairly attractive valuation & positive technical outlook, HEIM is a good stock for your investment portfolio.

Note:
I hereby confirm that I do not have any direct interest in the security or securities mentioned in this post. However, I could have an indirect interest in the security or securities mentioned as some of my clients may have an interest in the acquisition or disposal of the aforementioned security or securities. As investor, you should fully research any security before making an investment decision.

Tuesday, November 26, 2019

Market Outlook as at November 26, 2019

Our market has entered a corrective phrase since Tanjung Piai by-election result on November 16. Our politic can only get more confusing in the next one year. Yesterday Malacca ruling government's failure to pass its own resolution to appoint a Senator is a sign that this problem will continue even after Dr M has made way for Anwar to be the next PM.

Looking at the chart, we can see FBMKLCI is now hanging onto its 50-day SMA line. The indicators are weak, with MACD crossing below its MACD signal line; -DMI above the +DMI; and Stochastic RSI entering into oversold territory.

In view of the negative outlook, it is advisable to avoid trading in the present market.

Chart: FBMKLCI's daily chart as at Nov 25, 2019 (Source: Malaysiastock.biz)


Wednesday, November 06, 2019

F&N: Hit by a Double Whammy


Result Update

For QE30/9/2019, F&N's net profit dropped 41% q-o-q or 16% y-o-y to RM68 million while revenue dropped 8.6% q-o-q or 2.2% y-o-y to RM975 million. Both F&B Malaysia and F&B Thailand  revenue declined by 12.8% to RM498.3 million and 3.7% (-6.6% in local currency) to RM475.5 million, respectively. F&B Malaysia revenue dropped mainly due to slower off-take in current quarter post Hari Raya Puasa festive season and pre-loading effect ahead of sugar tax implementation.

F&B Malaysia operating profit declined by 47.5% to RM27.7 million due to lower trade and marketing spending in the preceding quarter. At the same time, F&B Thailand operating profit declined by 38.9% (-42.1% in local currency) to RM60.6 million mainly due to higher investment in brand spending and new product launches and re-launches in the current quarter.


Table: F&N's last 8 quarterly results


Graph: F&N's last 52 quarterly results

Financial Position

As at 30/9/2019, F&N's financial position is deemed healthy with current ratio at 2.21 times and gearing ratio at 0.39 time.

Valuation

F&N (closed at RM35.06 yesterday) is now trading at a PER of 31 times (based on last 4 quarters' EPS of 111.9 sen). At this PER, F&N is deemed fully valued.

Technical Outlook

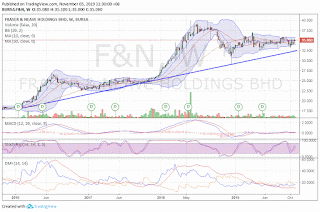
F&N is in an uptrend line, with support at RM32.50.


Chart 1: F&N's weekly chart as at Nov 5, 2019 (Source: Malaysiastock.biz)


Chart 2F&N's monthly chart as at Nov 5, 2019 (Source: Malaysiastock.biz)

Conclusion

Despite weaker financial performance & high valuation, I rate F&N as a HOLD. The poorer result is a temporary and the technical outlook is still positive.

Note:
I hereby confirm that I do not have any direct interest in the security or securities mentioned in this post.
 However, I could have an indirect interest in the security or securities mentioned as some of my clients may have an interest in the acquisition or disposal of the aforementioned security or securities. As investor, you should fully research any security before making an investment decision.

Tuesday, November 05, 2019

US Market Outlook as at November 4, 2019

DJIA made new high yesterday- joining Nasdaq which made new high last Friday (November 1). As noted in my previous post, S&P500 made new high last Monday (October 28). With all 3 main market barometers having achieved new high, it is now confirmed that US markets' uptrend will continue.


Chart 1: DJIA's daily chart as at Nov 4, 2019 (Source: Stockcharts.com)


 Chart 2: Nasdaq's daily chart as at Nov 4, 2019 (Source: Stockcharts.com)


Chart 3: S&P500's daily chart as at Nov 4, 2019 (Source: Stockcharts.com)

Friday, November 01, 2019

WCEHB-PR: Is It Worth Investing? [Updated]

WCE Holdings Bhd ("WCEHB") is carrying out its rights issue of Redeemable Convertible Preference Shares ('RCPS') on the basis of 2 RCPS @RM0.24 each for every 1 ordinary share held, plus 1 free warrant for every 4 RCPS subscribed for.

WCEHB-PR is the rights to subscribe for the RCPS. It has been traded since October 25 and will cease trading on November 4. This means today is the last day of trading of WCEHB-PR. 

Note: WCEHB-PR is not for speculation. After today, there will be no more trading of this rights, WCEHB-PR. You have no option but to apply for the RCPS at RM0.24 each. The deadline to submit your application is 11 November 2019. You can download the prospectus here and the application form here.

There are 2 options for the RCPS to be converted into ordinary shares. They are:
Option 1:
To convert 1 RCPS plus RM0.04 each to 1 ordinary share

Option 2:
To convert 4 RCPS to 3 ordinary shares

The exercise price for the warrant depends on the time of conversion:
First Exercise Period 
1-5 years: RM0.39

Second Exercise Period 
5-10 years: RM0.45

Why WCEHB rights issue is worth considering?
1. WCEHB owns 80% of the highway concession known as the West Coast Expressway (see the map below). This RM6 billion highway is still under construction but 3 sections (Section 8, 9 and 10) are now open (here). 

Map of West Coast Expressway

2. WCEHB is a marginally profitable company, not a loss-making concern.

3. WCEHB share price has dropped sharply since the announcement of this rights issue. From the chart below, we can trace the decline from around RM0.95 to RM0.40 since the announcement was made on 26 March 2018 (here) to the sending out of the circular to shareholders on 25 July 2019 and finally to the fixing of the ex-date on 10 Oct 2019. These 3 dates are denoted on the chart as A, B and C. 


Chart: WCEHB's daily chart as at Nov 1, 2019_12.15pm (Source: Malaysiastock.biz)

4. After the share has gone ex the entitlement, the theoretical ex-rights price was computed to be about RM0.36. And, the share price continued to drop until it reached RM0.305 yesterday. At the time of writing, WCEHB has recovered somewhat to about RM0.33 while WCEHB-PR was trading at RM0.025.

*****

It is fair to assume that the share price will slowly recover after the rights issue. Let's imagine WCEHB were to go back up to RM0.60 after 1 year. What would be the value of the RCPS & the warrant?

Once If the share price touched RM0.60, the preferred option to use for conversion would be Option 2. Why?

Under Option 2 (1 RCPS + 4 sen = 1 ordinary share), WCEHB RCPS will be worth RM (0.60-0.04) = RM0.56.

Under Option 1 (4 RCPS = 3 ordinary shares), the RCPS would be worth RM0.45.

The market will automatically value the RCPS using Option 2. To do otherwise would lead to value destruction. Markets everywhere abhors value destruction.

Next, what would be the value of the warrant with exercise price of RM0.39?

We are using the exercise price for the First Exercise period and we shall assume that the warrant will be trading with no premium nor at a discount.

The warrant would be worth RM (0.60-0.39) = RM0.21.

Potential profit for investing in 4 RCPS (in RM)
= [Total value of 4 RCPS and 1 warrant] 
                                less 
   [Total cost of buying the rights and subscription cost]
= [(0.56 x 4) + (0.21 x 1)] – [(0.025 x 4) + (0.24 x 4)]
= 2.45 – 1.06
= 1.39

This means you will get a return of 131% for a 1-year investment period.

Based on the above, I think you can consider applying for WCEHB's rights issue of RCPS or to buy the WCEHB shares in the market now. However the return for investing in WCEHB RCPS (of 131%) would exceed that of investing in WCEHB shares (of about 81%).

Thursday, October 31, 2019

Market Outlook as at October 31, 2019

Our market ended with a bang today. FBMKLCI went up 18 points to close at 1598. We have 539 gainers to 308 losers and 385 unchanged. Looking at the chart 1 below, FBMKLCI is poised to continue to rise to test the downtrend line, RR at 1640. If we can break above this downtrend line, we will have more than a year-end rally or CNY rally. Keeping my fingers crossed!! 


Chart 1: FBMKLCI's daily chart as at October 31, 2019 (Source: Malaysiastock.biz)

One of the sectors that I have been monitoring closely is the Financial Services sector. The FinServ index monthly chart is given below. This is my observation:
1. When the 10-month SMA line has crossed below the 20 & 30-month EMA lines, the worst of the decline is over. The current one is denoted as D and the earlier ones are denoted as A, B and C.
2. In the first 3 cross-under, the index took 6 months to form the bottom. 

Chart 2: FinServ's monthly chart as at October 31, 2019 (Source: Shareinvestor.com)

We can see that FBMKLCI moves in tandem with the FinServ index. If the FinServ index can make a bottom in the next 6 months and thereafter begin to recover, then FBMKLCI and our broad market will also begin to recover.


Chart 3: FinServ and FBMKLCI's monthly chart as at October 31, 2019 (Source: Shareinvestor.com)

US Market Outlook as at October 31, 2019

In the past 3 days, S&P500 has been trading at all-time high after it surpassed the high recorded in late July this year. Despite breaking to a new high, S&P500 seems to be reluctant to go higher. DJIA and Nasdaq have yet to surpass their respective July highs. Until DJIA and Nasdaq have joined in this breakout party, I think we should be cautious and not be overly bullish.

Chart 1: S&P500's daily chart as at Oct 30, 2019 (Stockcharts.com)

Chart 2: DJIA's daily chart as at Oct 30, 2019 (Stockcharts.com)

Chart 3: Nasdaq's daily chart as at Oct 30, 2019 (Stockcharts.com)

Looking at the 3-year chart for S&P500, DJIA and Nasdaq, we can see that none of these indices have surpassed the line connecting their recent high. The appearance of bearish divergence in the MACD indicators for all the charts could be a warning of the internal weakness of the indices. 


Chart 4: DJIA's daily chart as at Oct 30, 2019 (Stockcharts.com)


Chart 5: S&P500's daily chart as at Oct 30, 2019 (Stockcharts.com)


Chart 6: Nasdaq's daily chart as at Oct 30, 2019 (Stockcharts.com)

I am not bullish about the US markets. Yesterday, Fed's decision to cut interest rate could be taken as a sign of weakness in the US economy. As the action of the Fed contradicts the trend of the main stock market barometers, such as DJIA, S&P500 and Nasdaq, we should take a cautious stance, especially since the stock markets have rallied almost 200% from its low in 2009.

Wednesday, October 30, 2019

Gtronic: Earnings Dropped

Result Update

For QE30/9/2019, Gtronic's net profit rose 133% q-o-q but dropped 20% y-o-y to RM18.9 million while revenue rose 41% q-o-q but dropped 24% y-o-y to RM66 million. Net profit rose q-o-q due to higher revenue as a result of higher volume loadings and better economies of scale achieved from certain of the Group’s customers as well as better utilization of operational resources and facilities.


Table: Gtronic's last 8 quarterly results


Graph: Gtronic's last 51 quarterly results

Financial Position

Gtronic's financial position is still very healthy with current ratio at 4.4 times and gearing ratio at 0.16 time.

Valuation 

Gtronic (closed at RM2.20 yesterday) is now trading at a PE of 28 times (based on last 4 quarters' EPS of 7.80 sen). At this elevated PER, Gtronic is deemed overvalued.

Technical Outlook

Gtronic broke above its downtrend line at RM1.75 in September. The share price should find support at the 10-week moving average line at around RM2.00.


Chart 1: Gtronic's weekly chart as at Oct 29, 2019 (Source: Malaysiastock.biz)

Gtronic monthly MACD is poised to cross above its signal line. When that happens, the uptrend will pick up pace.


Chart 2: Gtronic's monthly chart as at Oct 29, 2019 (Source: Malaysiastock.biz)

Conclusion

Despite weaker financial performance and demanding valuation, I am keeping my rating for Gtronic to a HOLD. 

Note:

I hereby confirm that I do not have any direct interest in the security or securities mentioned in this post. However, I could have an indirect interest in the security or securities mentioned as some of my clients may have an interest in the acquisition or disposal of the aforementioned security or securities. As investor, you should fully research any security before making an investment decision.