Friday, January 25, 2013

Zhulian- grew its top-line & bottom-line further

Results Update

For QE30/11/2012, Zhulian's net profit increased by 11% q-o-q or 9% q-o-q to RM31 million while revenue increased by 6% qo-q or 35% y-o-y to RM117 million. The increase in revenue on q-o-q basis was attributable to higher demand from the local & Thailand markets. This, plus better share of profit of equity accounted investee, led to increased bottom-line.


Table: Zhulian's last 8 quarterly results


Chart 1: Zhulian's last 25 quarterly results

Valuation

Zhulian (at RM2.92 now) is trading at a PE of 11.7 times (based on last 4 quarters' EPS of 25 sen). As a fast-growing mid-size consumer stock, this PE multiple, Zhulian may command a PE of 12-14 times. As such, the stock is nearly fully valued.

Technical Outlook

Zhulian is in a strong uptrend but it is now pressing against the psychological resistance of RM3.00. Until it has broken above this resistance, Zhulian is expected to trade sideway with the 20-week EMA line acting as a support (currently at RM2.68).


Chart 2: Zhulian's weekly chart as at Jan 25, 2012_9.30am (Source: quickcharts)

Conclusion

Based on good financial performance, Zhulian is a good stock for long-term investment. It is however trading very near its fair value and its upside is currently capped by the psychological resistance at RM3.00. I would rate the stock a HOLD.

Note: 
In addition to the disclaimer in the preamble to my blog, I hereby confirm that I do not have any relevant interest in, or any interest in the acquisition or disposal of, Zhulian.

Huayang- still an attractive property stock

Results Update

For QE31/12/2012, Huayang's net profit increased by 17% q-o-q or 37% y-o-y to RM20 million while revenue was unchanged q-o-q but rose 24% y-o-y to RM105 million. The improved performance was due to steady recognition of construction work done for projects such as One South in the Klang Valley, Taman Pulai Indah & Taman Pulai Hijau in Johore and Bandar Universiti Seri Iskandar in Perak.


Table: Huayang's last 8 quarterly results


 Chart 1: Huayang's last 27 quarterly results

Valuation

Huayang (at RM1.61 now) is trading at a PE of 3.9 times (based on last 4 quarters' EPS of 42 sen). At this PE, Huayang is deemed attractive.

Technical Outlook

Huayang is in a steady uptrend, with resistance at RM1.70. Its support is goven by the 20-week EMA line at RM1.57.


Chart 2: Huayang's weekly chart as at Jan 25, 2012_9.30am (Source: quickcharts)

Conclusion

Based on good financial performance, attractive valuation & positive technical outlook, Huyang is a good stock for long-term investment.

Note: 
In addition to the disclaimer in the preamble to my blog, I hereby confirm that I do not have any relevant interest in, or any interest in the acquisition or disposal of, Huayang.

Monday, January 21, 2013

Market Outlook as at January 21, 2013

FBMKLCI dropped 23 points to 1653 as at 10.35am. This sharp drop could be driven by uncertainties surrounding the upcoming General Election, with more damaging revelations before the Royal Commission of Inquiry tasked with investigating the issuance of false ICs to manipulate the election outcome in Sabah in 1990s.

Regardless of the sellers' motivation, it seems that all the indicators have turned negatively for the market. The immediate support is the horizontal line at 1650. If that support is violated, I see the index testing the 1600 psychological mark.

In view of this negative technical outlook, we must exercise careful discretion in the market.


Chart: FBMKLCI's daily chart as at Jan 21, 2013_10.35am (Source: Quickcharts)

Thursday, January 17, 2013

UEMLand- poised to rally?

UEMLand broke above its intermediate downtrend line, RR at RM1.95 in late October last year. It made a high of RM2.30 before consolidating for the past 2 months. Today, UEMLand broke above the RM2.30 mark; thus signaling the continuation of its uptrend.

Based on this, UEMLand could be a good trading BUY. UEMLand - and other property stocks with large land bank in Johore (such as Tebrau) - is  benefiting from the demand from across the Causeway.


Chart 1: UEMLand's daily chart as at Jan 17, 2013_11.45am (Source: Quickcharts)

Note: 
In addition to the disclaimer in the preamble to my blog, I hereby confirm that I do not have any relevant interest in, or any interest in the acquisition or disposal of, UEMLand.

Malaysia's 2nd Game Changer

We heard damaging disclosures in the Royal Commission of Inquiry to investigate the issuance of IC to non-citizens to vote in the Sabah State Election in the 1990s. From Malaysian Insiders, we learn:
Former Sabah NRD director Ramli Kamarudin said Megat Junid, then the deputy home affairs minister, had told him that the NRD receipts were to match the names and IC numbers of registered voters.


“We gave them (immigrants) RM20,” Ramli told the Royal Commission of Inquiry (RCI) on illegal immigrants here today.


“We teach them how to vote. We gather them in a house. We send them by bus to the polling stations. Then we send them back and we collect the receipts. The receipts are just for voting. We did not give them identity cards,” he added.


Ramli said that about 200 NRD receipts were issued in five or six state constituencies each in Sabah that were considered “black spots that were difficult for the government to win.”
This is consistent with what I heard on the ground. In December 2011, I wrote in the now-defunct Merdeka Review:
On the eve of the 1999 state election, my cousin told my father that he shouldn’t bother to vote because her husband’s estate workers- mostly from Indonesia- were being ferried by buses to polling centers. The husband told my cousin that someone would give ICs to these Indonesian workers and then they would walk into the polling center to vote. 
For the English version, go to my post (here).

Did the election fraud have any impact on the election? Read on:
He (former Sabah NRD director Ramli Kamarudin) added that the directive was given at a meeting with Megat Junid, Umno’s Datuk Seri Osu Sukam (who later became the Sabah chief minister in 1999) and an NRD registration officer called Asli Sidup, at Hyatt Hotel here two weeks before the 1994 state election.


“The receipts were strictly for voting. After that, we would collect the receipts and destroy them,” said Ramli.


Asli testified later that 200 NRD receipts were used in the Kawang state constituency in the 1994 state election, which Osu won by a mere 64 votes.
This revelation could be two possible scenarios:
1. Barisan Nasional ('BN') could suffer a serious political setback in Sabah. If the votes in Sabah - & to some extent Sarawak - were to swing to Pakatan, BN may lose the General Election.
2. The Election Commission ('EC') would be under close scrutiny from now on- which is a good thing. The question of the today: Can BN win the next General Election fairly?
Malaysia is about to see another game changer?!

Construction sector poised to go higher (AMENDED)

My post entitled "Construction sector poised to go higher" dated January 11, 2013 has been withdrawn due to an error in one of charts used for the study. The chart which I intended to use was Construction index chart but instead I had used the Consumer index chart.

While I agreed with the positive outlook for the construction sector taken by Maybank IB Research (as  reported in the Star, go here), the Construction index has not achieved a bullish breakout from its downtrend line. From Chart 1, we can see that Construction index is still in an intermediate downtrend line.


Chart 1: Construction's weekly chart as at Jan 16, 2013 (Source: Quickcharts)

Of Maybank IB Research's 2 top picks - WCT and Gamuda - we can see that WCT is moving sideway and needs to break above the strong horizontal resistance at RM2.40. On the other hand, Gamuda has just broken above its horizontal resistance at RM3.80 and could be poised to rally higher.


Chart 2: WCT's weekly chart as at Jan 16, 2013 (Source: Quickcharts)


Chart 3: Gamuda's weekly chart as at Jan 16, 2013 (Source: Quickcharts)

While I agreed with the positive outlook for the construction sector taken by Maybank IB Research (as  reported in the Star, go here), the Construction index has not achieved a bullish breakout from its downtrend line. Of Maybank IB Research's 2 top picks - WCT and Gamuda - we can see that Gamuda may be a trading BUY as it has broken above its horizontal resistance at RM3.80. The other stock to look at is Mudajya which I had posted on earlier.

The error in the earlier post is much regretted.

Note: 
In addition to the disclaimer in the preamble to my blog, I hereby confirm that I do not have any relevant interest in, or any interest in the acquisition or disposal of, WCT, Gamuda & Mudajya.

Wednesday, January 16, 2013

Redtone broke above the resistance of 42.5 sen

Redtone has broken above its triangle at 42.5 sen (see Chart 1).  With this breakout, Redtone could continue with its steady upleg. Next resistance at 50 sen. Based on this bullish breakout, redtone could be a good trading BUY. For more on Redtone, go to my earlier post.


Chart 1: Redtone's daily chart as at Jan 15, 2013 (Source: Tradesignum)


Chart 2: Redtone's monthly chart as at Jan 15, 2013 (Source: Tradesignum)

Note:
In addition to the disclaimer in the preamble to my blog, I hereby confirm that I do not have any relevant interest in, or any interest in the acquisition or disposal of, Redtone.

Friday, January 11, 2013

Gtronic- up on favorable news report

There is a favorable report in the Star on Gtronic where RHB Research valued the stock at RM2.11 (here). Chartwise, we can see that Gtronic broke above its recent high at about RM1.55. With this breakout, the stock may test the psychological RM2.00 mark. It is interesting to note that the last 2 breakout saw the stock gaining 25%. If the same percentage gain can be achieved, the stock could go as high as RM1.95. At the time of writing, Gtronic is trading at RM1.80; thus giving a small upside to the potential target of RM1.95 or RM2.00. However, the stock could be a good buy on weakness.

For mpre on Gtronic, go to my earlier post (here).


Chart: Gtronic's daily chart as at Jan 11, 2013_9.30am (Source: Quickcharts)

Note: 
In addition to the disclaimer in the preamble to my blog, I hereby confirm that I do not have any relevant interest in, or any interest in the acquisition or disposal of, Gtronic.


Thursday, January 10, 2013

Haio- the next upleg may have started

Haio has broken above its strong horizontal resistance line at RM2.30 on January 2. With this upside breakout, Haio is set for its next upleg. Based on technical consideration, this stock could be a good trading BUY. For more on Haio, go to my earlier post (here).


Chart: Haio's weekly chart as at Jan 10, 2013_3.00pm (Source: Quickcharts)

Note:
In addition to the disclaimer in the preamble to my blog, I hereby confirm that I do not have any relevant interest in, or any interest in the acquisition or disposal of, Haio.

Mudajya broke above its long-term downtrend line

Mudajya has just broken above its long-term downtrend line at RM2.70. With this upside breakout, Mudajya could be poised for an uptrend. Based on technical consideration, this stock could be a good medium-term investment. For more on Mudajya, go to my earlier post (here).


Chart: Mudajya's weekly chart as at Jan 10, 2013_3.00pm (Source: Quickcharts)

Note:
In addition to the disclaimer in the preamble to my blog, I hereby confirm that I do not have any relevant interest in, or any interest in the acquisition or disposal of, Mudajya.

Wednesday, January 09, 2013

Canone & Kianjoo broke above their medium-term downtrend line

We can see below the charts of Canone and Kianjoo. In June 2012, Kianjoo had a breakout and a few days later, Canone had a breakout. Four days ago, Kianjoo had a breakout and yesterday Canone had a breakout. In the last breakout, Canone rose from RM2.30 to RM3.10 (RM0.80 or 35%). If Canone can achieve a similar gain, say 80 sen, Canone may be able to hit RM3.30.

Based on the above, Canone may be a trading BUY.


Chart 1: Canone's daily chart as at Jan 8, 2013 (Source: Quickcharts)


Chart 1: Canone's daily chart as at Jan 8, 2013 (Source: Quickcharts)

Note:
In addition to the disclaimer in the preamble to my blog, I hereby confirm that I do not have any relevant interest in, or any interest in the acquisition or disposal of, Canone or Kianjoo.  

Market Outlook as at January 9, 2013

Last week, FBMKLCI made a new all-time high of 1699.68 (on January 4), eclipsing the previous all-time high of 1679.37 recorded on October 29, 2012. It nearly tested the psychological level of 1700 as well as the line connecting the 'peaks' for the past 9 months. The first attempt of the 1700 mark failed, not surprisingly. That the market had rallied slightly more than 100 points from the low of 1590 in late November 2012 could mean that the stage is now set for a correction. The market could pullback to the 20-day EMA of 1670 before staging another attempt at the 1700 mark. The same technical picture can be seen in the chart for FBMEmas.

Based on this, I expect the market to be tricky & our trading posture should be cautious. You may consider adding to your position if FBMKLCI were to weaken to 1670 as three of the major market worries- Eurozone problem, US fiscal cliff & Chinese hard lading- have now been banished to the sideline. However, we in Malaysia would have to contend with the General Election jittery around the corner. I personally doubt the ruling government will lose the election and in any event, I believe that any upset has been fully priced in by the market.


Chart: FBMKLCI's daily chart as at Jan 8, 2013 (Source: Quickcharts)


Chart: FBMEmas's daily chart as at Jan 8, 2013 (Source: Quickcharts)

Monday, January 07, 2013

Adventa proves that nothing succeed as well as success!

On December 24, I replied to a query from a reader about Adventa, which was then trading at RM1.92-1.93. To wit:
After the RM1.70 per share payout, ADVENTA will still have cash equivalent to RM0.40 per share and the Excluded Business consisting of Sun Healthcare (M) S.B. and Electron Beam S.B.

A brief description of these 2 companies are:
1. SUN HEALTHCARE has a long history of serving the national healthcare institutions, supplying dialysis disposables, medical equipment and devices since its incorporation in 1981.

2. ELECTRON BEAM SDN BHD is the region’s first ever commercial supplier of contract electron beam processing services.

From Wikipedia, we learned: "Electron beam processing or electron irradiation is a process which involves using electrons, usually of high energy, to treat an object for a variety of purposes. This may take place under elevated temperatures and nitrogen atmosphere. Possible uses for electron irradiation include sterilization and to cross-link polymers".

Look like Adventa will invest the balance of the sale proceed in the growing healthcare sector- not a bad idea.
Looking back, we could have said that Adventa at RM1.92-1.93 was fairly attractive as it has a cash backing of RM2.10 [from the sale of its rubber glove business] plus the Excluded Business consisting of Sun Healthcare (M) S.B. and Electron Beam S.B. After the payout of RM1.70 per share, Adventa would have a cash backing of RM0.40 per share & the Excluded Business consisting of Sun Healthcare (M) S.B. and Electron Beam S.B.

Over the past two days, Adventa rallied to above RM0.50 from the adjusted price of RM0.22. This means the market is valuing the Excluded Business at RM15 million. Is that a fair price tag to put on these businesses.

Looking at the latest Notes to the Account, we can see that for FYE30/10/2012, these businesses generated a pre-tax profit of RM3.26 million on a revenue of RM14.63 million. This compared favorably to the performance in the preceding year (FYE30/10/2011) when it recorded a net loss of RM1.58 million on a revenue of RM12.57 million. See the Segmental Information where the revenue & results of these businesses are classified under Continuing Healthcare Operation here.

While the pre-tax profit of RM3.26 million is fairly encouraging for FYE30/10/2012, one couldn't help but wonder how a small increase in revenue (from RM12.57 million to RM14.63 million) would bring about such a sea of change in the bottom-line. Is this results massaged by the management?

Based on the above, we have to be careful about jumping into the bandwagon of buying Adventa. We can see that the market has started to look for the next 'Adventa' and in the process bought aggressively into CIHldg, which gained 11 sen to RM0.95.

 
Chart: Adventa's daily chart as at Jan 7, 2013_3pm (Source: Quickcharts)

Based on the above, I feel that it is best to avoid Adventa (or take profit if one has the stock).

Note:
In addition to the disclaimer in the preamble to my blog, I hereby confirm that I do not have any relevant interest in, or any interest in the acquisition or disposal of, Adventa.

Friday, January 04, 2013

Semiconductor stocks poised for a minor rally


Two days ago, the Philadelphia Semiconductor Index ('SOX') broke above its intermediate downtrend line at 390. This upside breakout could be the start of a minor rally, similar to what we saw in January-March 2012.


Chart 1: SOX's daily chart as at Jan 3, 2013 (Source: Stockcharts)

In early 2012, Unisem & MPI also had a decent rally, when Unisem rose from RM1.00 to RM1.60 while MPI rose from RM2.70 to RM3.50.


Chart 2: Unisem's daily chart as at Jan 4, 2013_12.00pm (Source: Stockcharts)


Chart 3: MPI's daily chart as at Jan 4, 2013_12.00pm (Source: Stockcharts)

If the breakout for SOX can sustain, then we may see a similar rally in Unisem & MPI. As such, these two stocks could be a good trading BUY.

Note:
In addition to the disclaimer in the preamble to my blog, I hereby confirm that I do not have any relevant interest in, or any interest in the acquisition or disposal of, Unisem & MPI. 

Thursday, January 03, 2013

RHBCap may have a bullish breakout

RHBCap broke above its strong horizontal resistance at RM7.75 this morning. Its immediate resistance  are the horizontal line at RM8.15 and then the upper boundary of the gradual upward channel at RM8.35.


Chart 1: RHBCap's daily chart as at Jan 3, 2013_12.15pm (Source: Quickcharts)

The longer-term chart for RHBCap is bullish.  The stock, which had been consolidating for the past 18 months, could continue with its prior uptrend. It may test its all-time high at RM10.50 or even the upper boundary of its irregular upward channel at RM13.00.


Chart 2: RHBCap's monthly chart as at Jan 2, 2013 (Source: Tradesignum)

RHBCap (at RM7.78) is now trading at a PE of 9.4 times (based on annualized EPS of 83 sen) or 1.35 times its book value (of RM5.76 as at 30/9/2012). At this multiples, RHBCap is deemed attractive. For more on its latest quarterly results, go here.

Based on technical consideration, RHBCap could be a trading BUY.

Note:
In addition to the disclaimer in the preamble to my blog, I hereby confirm that I do not have any relevant interest in, or any interest in the acquisition or disposal of, RHBCap.  


TChong may go into overdrive!

Results Update

For QE30/9/2012, TChong's net profit dropped by 25% q-o-q or 40% y-o-y to RM32.7 million while revenue was mixed- up 3.6% y-o-y but down 4.8% q-o-q to RM938 million. Segmental results q-o-q are as follows:
1. Vehicle assembly, Manufacturing, Distribution & After-sales Services
Revenue dropped 4.9% to RM974 million while EBITDA dropped by 13.4% to RM66.5 million. The decline in sales volume was due to backlog of orders in QE30/6/2012 which had since normalized.
2. Financial Services
Revenue rose 4.1% to RM10.4 million while EBITDA rose marginally from RM3.9 million to RM4.1 million.
3. Other Operations
Revenue dropped marginally from RM1.4 million to RM1.3 million while EBITDA dropped from RM4.4 million to RM2.5 million. The drop was attributed to an one-off gain of RM2.8 million recorded in QE30/6/2012 from re-measurement of fair value of the 15%-interest in TRMS.


Table: TChong's last 8 quarterly results


Chart 1: TChong's last 24 quarterly results

What drives TChong?

From Chart 1 above, we can see that TChong's profit margin has been declining since 2008. This coincided with the strengthening of JPY vis-a-vis MYR (for the chart of MYR-JPY, go here). A stronger JPY led to a lower profit margin. However, we can see that MYR-JPY cross rate has just broken above the downtrend; thus signaling the start of a new trend for JPY that could see MYR-JPY going back to 34 from 28 today. If this scenario panned out, the profit margin for TChong could revisit its high of 10-12% in 2008 as compared to 5% today.

Better exchange rate can only go so far. What TChong needs is better sales volume! We saw this in FY2008 when TChong launched the Nissan Grand Livina (here). Recently, TChong introduced the low-cost sedan, Nissan Almera. Can this new model can drive up TChong's sales volume? This is what local auto blog, Paul Tan has to say:
Has Nissan got the Almera right? To properly answer that question we would have to line it up side-by-side against its main rivals, but from the drive alone it is clear that the newest B-segmenter to hit town is attractively packaged. Its strong points are its simplicity, frugality, that rear leg space as well as an extensive catalogue of add-ons.
The basic RM66,800 car may be, well, basic, but it’s still good to know there’s an offering in this segment for that money, and at any rate, you can always spec it up with only what you need – a familiar business model that often makes sense. In these times of economic uncertainty, the Almera may be just what Nissan needs in our market.
For more on Paul Tan's take on Nissan Almera, go here

We will have to wait & see but my gut feeling tell me that Almera will be a winner.

Valuation

TChong (closed at RM4.63 on Monday) is now trading at a PE of 22 times (based on last 4 quarters' EPS of 21.2 sen). At this PE, TChong is deemed fully valued.

Technical Outlook

TChong has been range-bound between RM4.00 & RM4.70 for the past 2 years. If it can break out of this range- preferably above RM4.70- this stock will chart a new price direction.


Chart 2: TChong's weekly chart as at Jan 2, 2013_12.30pm (Source: Quickcharts)

Conclusion

TChong may benefit from the weakening of JPY and the introduction of a new model that is competitively priced. The trigger for the continuation of the prior uptrend is a breakout above the resistance at RM4.70. If that is achieved, TChong could be a good trading BUY. It can even be a good stock for long-term investment. Watch TChong closely.

Note:
In addition to the disclaimer in the preamble to my blog, I hereby confirm that I do not have any relevant interest in, or any interest in the acquisition or disposal of, TChong. 

Wednesday, January 02, 2013

Notion broke its strong horizontal support at RM0.76

Notion broke its 3rd fan uptrend line, S-S3 in mid-December. For the past 2 weeks, it was hanging around the RM0.90 mark. The last 3 days, it started pulling away from the RM0.90 mark. Today, it dropped sharply and broke the horizontal line at RM0.76. The stock's next support levels are at RM0.50 & RM0.40.

Based on this bearish technical outlook, the earlier positive/constructive outlook is revised to negative outlook. It deserves a lower rating of either a SELL or just a HOLD.


Chart: Notion's weekly chart as at Jan 2, 2013 (Source: Quickcharts)

Note:
In addition to the disclaimer in the preamble to my blog, I hereby confirm that I do not have any relevant interest in, or any interest in the acquisition or disposal of, Notion.

LPI has a bullish breakout

LPI broke above its strong horizontal resistance at RM14.00 on December 19 as well as its recent high of RM14.38 (recorded on October 30). With this breakout, the stock is likely to continue to its uptrend. Potential target is RM16.50.

Based on technical consideration, LPI could be a good trading BUY. This supercedes my previous recommendation to take profit on the stock. (Note: the stock is now trading at RM14.70).


Chart 1: LPI's daily chart as at Dec 28, 2012 (Source: Tradesignum)


Chart 2: LPI's monthly chart as at Dec 28, 2012 (Source: Tradesignum)

Note:
In addition to the disclaimer in the preamble to my blog, I hereby confirm that I do not have any relevant interest in, or any interest in the acquisition or disposal of, LPI.

A Weakening Japanese Yen raises Some Boats

The election of Shinzo Abe as the Japanese Prime Minister means that Japan will embark on expansionary policies with the intended purpose of generating growth by weakening its currency. A weaker Japanese Yen ("JPY") will also inject inflation into a recession-bound economy.

The immediate impact of these policies will be cheaper exports; thus benefiting exporters. The positive impact will eventually work through the economy, leading to a pick-up in growth.

We can see from Chart 1 that JPY index has been moving within a downward channel that dated back to October 2011. Over the past 3 months, JPY dropped from the upper boundary of the channel at 129 to the lower boundary at 115. After this sharp fall, JPY may enjoy a technical rebound which could hit the horizontal resistance at 120 or even 123. I doubt JPY will revisit the upper boundary given the mandate secured by the Prime Minister Shinzo Abe. To get another look at the trend for JPY, check out Yahoo Finance's chart for the cross rate for USD-JPY for the past 5 years (here) or the cross rate for MYR-JPY for the same period (here).


Chart 1: JPY Index's weekly chart as at December 31, 2012 (Source: Stockcharts)

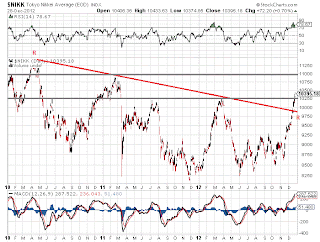
We can also see that Nikkei 225 has broken above its downtrend line at 9850 as well as its strong horizontal line at 10250 last week. After a short pause, Nikkei 225 may test its next horizontal line at 11000.


Chart 2: Nikkei 225's weekly chart as at December 31, 2012 (Source: Stockcharts)

For Malaysian investors, the best way to benefit from a weakening yen is to positioning ourselves in companies that import from Japan, such as car-makers Tan Chong & UMW.