Thursday, April 30, 2009

Who's afraid of the Swine Flu?

Naked Capitalism has a thought-provoking post entitled "Are the Markets Too Complacent about Swine Flu?", where it is noted that the stock markets in the US overnight & throughout Asia at this hour have registered or are registering healthy gains, despite the WHO's designating the swine flu as an "imminent" pandemic, and raised its alert to a level 5 out of a possible 6. The World Bank guesstimates the cost of a severe pandemic at 4.8% of world GDP (or, USD3 trillion).

The same sentiment is shared by Ambrose-Evans-Pritchard, who wrote an article entitled "Swine flu deflation" in the Telegraph of UK. He argued that investors are underestimating the possible repercussions:

Over the last couple of days I have been deluged by notes from City analysts and economists suggesting that H1N1 avian-swine flu poses no great threat to the global economy because the authorities showed during the 2003 SARS epidemic in Asia that outbreaks can be contained.

This is a misreading of the threat we face.

SARS is a coronavirus. It is extremely hard to catch. Just 8,000 people were infected worldwide during the entire epidemic (10pc died).

Today's H1N1 outbreak is an influenza virus, which is far more contagious.

Dr. Keiji Fukuda, the WHO's assistant director-general, said it is already too late to stop the spread of the disease. “At this time, containment is not a feasible option.


The markets' complacency will be due to successful containment of early cases in the US and Canada as well as the apparent fall-off in the fatality rates in Mexico. Yet, nobody should pre-judge the virulence of this developing pandemic. All we can hope is that we may be lucky and the virus may indeed prove mild - like the Hong Kong flu in 1968 - or burn out altogether as it mutates.

However, one may say that there is no clearer sign of the strength of the present stock markets than their refusal to be intimidated by the danger posed by the Swine Flu. Indeed, who's afraid of the Swine Flu?

Wednesday, April 29, 2009

How Charts can help in determining entry price

We have noted that the monthly MACD is poised to hook up for the KLCI (here). As discussed previously, this is a very reliable indicator that the market has bottomed & an upturn could be around the corner. Many investors are under-invested in the market & have been hoping for some correction in order to move into the market. Yesterday, I have posted that the market may have put in a bearish reversal (here). If the reading is correct, then the time to accumulate stocks may be coming soon.

Assuming that you have made a list of stocks to buy (hopefully, they are fundamentally good companies that are trading at attractive valuation), then let's use technical analysis to pinpoint a good entry level. Let's say, the stock that you like to buy is TA Enterprise Bhd ('TA'), a stockbroking firm that would naturally benefit from increased trading volume in a more bullish stock market. In addition, you may have read that TA is planning to spin-off its property arm, which could be the catalyst for a re-rating of the stock.

You may want to confirm that the monthly MACD has hooked up for TA. If you have the charting software, you can easily do it. If you do not have the necessary software, then you may use the next approach- see whether the stock has crossed above its 200-day Simple Moving Average ('SMA').


Chart 1: TA's monthly chart as at 29/4/2009_12.30 noon (Source: Quickcharts)

To check whether the stock has crossed above its 200-day SMA, you can use the web-based free charts provided by Tradesignum.com. I have re-produced this chart below. We can see that TA has in fact crossed above its 200-day SMA. If you zoomed into the recent price movement, you would see that TA had a very sharp move which may not be sustainable. If you think otherwise, you may position to buy at either the recent reaction 'low' of RM0.76 (recorded on April 20 & 21) or the 20-day SMA of RM0.74. However, if you are less gung-ho & very patient, then you may position to buy at around the 100-day SMA & 200-day SMA (i.e. about RM0.65-70). The lower the target entry price, the lower will be the probability that you getting your stock. But,if you do get it, then the lower entry price will give you higher return.


Chart 2: TA's daily chart as at 28/4/2009 (Source: Tradesignum.com)

I have chosen TA for analysis because it has a recent bullish breakout of a very clear downtrend line. Other stocks may not have such a distinct price trend. One of the most reliable method of stock selection is the trend-following method. I find that using multiple moving average lines would easily enable one to use the trend-following method. For example, you may buy when the 50-day SMA has crossed above the 100-day SMA or the 200-day SMA. Similarly, you may sell when the 50-day SMA has crossed below the 100-day SMA or the 200-day SMA.

If you try out with different stocks, using Tradesignum (for period or data range of 10 year & overlaid with 20-day, 50-day, 100-day & 200-day SMA), you may agree with me. It is a very profitable & easy method to adopt. Good luck.

CPO prices likely to correct

On April 15, I have posted about the Plantation index & stocks lagging behind the big price movement for CPO. I have noted that CPO prices could come under pressure in the later part of the year and recommended some profit-taking for some plantation stocks that have run up very well (such as, Asiatic & KLK). Since then, CPO prices had continued its rise until it hit a high of RM2800 per ton.

Yesterday, the Parabolic SAR (short for 'stop-and-reversal' indicator) has moved above the CPO price. This negative sign could signal the start of the correction in CPO prices. With this correction in CPO, the outlook for Plantation stocks is likely to turn negative.


Chart: CPO's daily chart as at April 29, 2009 (source: ifs.marketcenter.com)

Tuesday, April 28, 2009

Market Outlook as at April 28, 2009

As at 2.40 pm, the KLCI was down 8 points to 972. If this bearish market persists for the rest of the second session, we shall have a loss of at least 8 points for today. If so, we would be sighting a highly reliable bearish reversal pattern known as "three outside down".

Up to this morning, what we have sighted is the bearish engulfing pattern (here) & (here), where further weakness is normally required for bearish confirmation of this reversal pattern. That further confirmation could be considered as satisfied if the KLCI were to lose 8 points or more today.

With this reversal pattern, we can expect the market to slide lower over the next few days.


Chart: KLCI's daily chart as at 27/4/2009_12.30 noon (Source: Quickcharts)

Monday, April 27, 2009

Those who know, do not speak

Those who know, do not speak. Those who speak, do not know.

-Lao Tzu


First, I thought our market was due for a correction and yet it went higher (here).

Then, I thought the USD was poised to go higher. Instead, it retreated sharply (here).

Finally, when I thought our market was due to charge up to the 1000-point level, it took a sharp correction (here).

Days like these, one appreciates more the wisdom of Lao Tzu.

Saturday, April 25, 2009

USD slid back to its uptrend line

Just two days after my post that USD's uptrend would continue (here), USD was hit by sharp correction that sent it back to its uptrend line. See chart below.


Chart: USD's daily chart as at April 24, 2009 (Source: Stockcharts)

Naked Capitalism has pointed out that China has been secretly stocking up on gold (here) in a move to get away from the USD. China has been very vocal about a drop in the value of USD as her holdings of US Treasuries and Agencies rose from about $275 billion to $1250 billion from end-2003 till today. Meanwhile her holdings of gold has increased from 600 tons to 1054 tons during the same period (here). This piece of news will augur well for gold & won't be good for USD. Let's see whether USD index can rebound from its medium-term uptrend line support at 84.5 level next week.

Friday, April 24, 2009

Market Outlook as at April 24, 2009

The potential reversal in the KLCI did not happen (see earlier post, here). The correction on April 20 & 21 was relatively mild & the nearly-horizontal resistance-turned-support at 950-60 saved the day. With this, our market marches on. The market sentiment may have benefited from the Government's decision to scrap the 30% quota for bumiputra equity even though it is only for 27 sub-sectors in the services sector (here). It certainly wasn't affected by the IMF report that the global economy would likely contract 1.3 percent this year in the deepest post-World War Two recession by far (here).

From the daily chart (Chart 1), we can see that the MACD, which was poised to hook down 1 or 2 days ago, may not do so after today's strong move. The market looks set to test the psychological 1000 level next week.


Chart 1: KLCI's daily chart as at 24/4/2009_12.30 noon (Source: Quickcharts)

Investors would be heartened to learn that the monthly MACD has nearly done a bullish crossover. If this happened next month, our market would have bottomed & the long-term view of our market would be bullish.


Chart 2: KLCI's monthly chart as at 23/4/2009 (Source: Quickcharts)

It is important to note that the US stock markets as well as other Asian markets are showing signs of weakness. If these markets entered into a sharp correction, our market will certainly be affected. So, keep an eye on these markets, always.

Thursday, April 23, 2009

USD's uptrend to continue

USD's uptrend is expected to continue after it broke above its symmetrical triangle at the 86 point level. The ADX, MACD & Williams %R indicators all confirmed the move to upside for USD. See Chart 1 below.


Chart 1: USD's daily chart as at 22/4/2009 (Source: Stockcharts)

From Chart 2, we can see a close inverse correlation between DJIA & USD. This inverse correlation developed as investors sought out USD as a safe haven during the tumultuous period of the Global Financial Crisis. With the critical stage of the crisis appeared to be over, would this relationship still hold?


Chart 2: DJIA & USD's daily chart as at 22/4/2009 (Source: Stockcharts)

If this inverse correlation still holds true, then the continuation of the uptrend for the USD would signal a correction for DJIA. I have plotted below the chart of DJIA:USD, which shows signs of correction.


Chart 3: DJIA:USD's daily chart as at 22/4/2009 (Source: Stockcharts)

Wednesday, April 22, 2009

Asian markets poised to correct

A quick glance at some of the major Asian markets (with the notable exception of Shanghai) will show that many have been rising in a near vertical fashion, gaining 35-40% over the past 6 weeks. Most of them are now marginally below their respective uptrend line. If they break below the uptrend convincingly, we are likely to see a deeper & longer correction in the days ahead. Our market, which has been a laggard, has only managed to record a gain of 16% (from its low of 836 on March 12 to today's high of 976). Unfortunately, we will not be spared if many of the regional markets were to enter into a correction now. So, we may have to reduce our trading position over the next few days. Those hoping to buy for longer term, can do so when the prices have retreated.


Chart 1: Kospi & TWII's daily chart as at 21/4/2009 (Source: Stockcharts)


Chart 2: Kikkei & HSI's daily chart as at 21/4/2009 (Source: Stockcharts)


Chart 3: STI & BSE's daily chart as at 21/4/2009 (Source: Stockcharts)

TM- in a sweet spot

TM-- the remaining businesses of Telekom Malaysia after the spin-off of the mobile telephony businesses to Axiata (formerly, TMI)-- could be a rewarding stock to own for the next 2 months. A TM shareholder will be receiving the Final Gross Dividend of 14.25 sen (less 25% tax) on May 20. In addition, he/she will also be receiving a capital repayment of 98 sen when Axiata finally settle the RM4 billion owing to TM (see the Bursa's announcement, here). The first RM2 billion was paid in early April, while the balance is likely to be paid by April 25 (see the Edge report, here). TM has yet to fix the entitlement date for this capital repayment.

When dealing with this capital repayment, we must ask the question whether this "good news" has been fully factored into the market price. The news was announced after the close of trading on February 24, when TM share price closed at RM3.34. The next day, the share price jumped to a high of RM3.76, before closing at RM3.48. Since then, TM share price has been inching higher. It closed at RM3.64 yesterday. While one should not expect TM share price to fully incorporate the RM0.98 capital repayment into its share price, an increase of RM0.30 (i.e. yesterday's close of RM3.64 less the closing price of RM3.34 on February 24) seems a bit low. How much more should the share price go up?

One thing that I have observed in our market in the past is that, when the entitlement date of the capital repayment is finally announced, the market will react. This may come very soon.


Chart: TM's daily chart as at 21/4/2009 (Source: Quickcharts)

Axiata- How high can the current rally go?

Axiata (formerly, TMI) has a good price run-up after making a low of RM1.45 on March 17. If one looked closely, one can see that a short-term uptrend has formed (with higher 'high' & higher 'low') but the medium-term downtrend is still intact. How would this stock perform over the next few days or weeks?

With the momentum on its side, I believe that Axiata is likely to attempt the recent 'high' of RM1.98 recorded on April 8. If a new 'high' can be achieved, then the developing short-term uptrend is still intact. The upcoming resistance levels are:
1. the psychological RM2.00 level;
2. the 'low' of RM2.06 recorded on February 3; and
3. the 100-day SMA line of RM2.15.

Despite the recent strength in Axiata's price rally, one must bear in mind that this stock is still in a medium-term downtrend. For example, Axiata's rebound in the past few months had always been capped by the trough of the preceding down-leg (T1, T2 & T3). Only on one occasion, that's on October 14, 2008 did a reaction 'high' of RM3.78 surpassed the trough of the preceding down-leg of RM3.71 (T2). Even so, the rally subsequently failed to go further. Can the current rebound (or, short-term uptrend) surpassed RM2.06 (the trough of the preceding down-leg, T1)? We will have to wait & see.


Chart: Axiata's daily chart as at 21/4/2009 (Source: Tradesignum.com)

Monday, April 20, 2009

Watching US markets, with concern

In a recent report (via Phil's Stock World), Merrill Lynch analyst Mary Ann Bartels suggested "L/S HF (that's Long/Short Equity Hedge Funds) market exposure may have peaked in the second half of March, after increasing significantly from the record lows of mid-December.... Quant fund market exposure appears to have peaked in Feb, but started to fall rapidly in late March, a couple of weeks into the current equity rally". See the table below.


The above is significant for two reasons. According to the report, "First, a sharp fall in beta could be a contrarian bullish for equities if HFs are forced back in. Secondly, HFs are an important source of liquidity for the markets - particularly true of quant funds employing high-frequency algorithmic and programming trading strategies. A big drop in HF presence in the equity markets could result in rising volatility."

This was also highlighted by Zero Hedge in a post entitled "The Incredibly Shrinking Market Liquidity, Or the Upcoming Black Swan of Black Swans," "Anyone who is doing anything sensible right now is either losing money or is out of the market entirely." This in turn has caused a drop in liquidity in the market- approaching a level that is 6 standard deviations away from the recent norms. This could lead to substantial market dislocations based on previous comparable situations, such as those experienced in October 87, August 2007, or January 2008, according to one quant trader.

Similar observation was made by Barclays Capital analyst Matthew Rothman (via Clusterstock), who has noted that only one quant manager out of 80 that he has talked to has made money during this rally. "It is fair to say that just about everyone is bewildered and trying to understand when this rally will end," Rothman writes.

Back to Zero Hedge. The vast majority of transactions in the market are not customer driven buy/sell orders, but are in fact high frequency, small block trades that constantly cross between a select few of these same quant funds and program traders. The activities of the quant funds, which are carried out via program trading, is a material component of daily volumes (see the table below). According to the NYSE, last week program trading was 8% higher than the 52 week average, which on almost 4 billion shares is a material increase. Some more program trading statistics: principal trading is running 21% above 52 week average, agency trading is 11% below average, while NYSE weekly volume is running about 9% below 52 on average. So, while the number of quant funds operating in the market has dropped, the volume of trades done by the remaining quant funds has actually increased.


A very interesting point to note is the significant participation by the administration darling, Goldman Sachs (see the table below). Goldman's program trading principal to agency+customer facilitation ratio is a staggering 5x, which is multiples higher than both the second most active program trader and the average ratio of the NYSE, both at or below 1x. Some may see this as a sinister development.


Another point made by Zero Hedge is that the Volume Weighted Average Price of the S&P500 index "indicates that the bulk of the upswing has been done through low volume buying on the margin and from overnight gaps in afterhours market trading. The VWAP of the SPY through yesterday indicated that the real price of the S&P 500 would be roughly 60 points lower, or about 782, if the low volume marginal transactions had been netted out. And yet the market keeps on rising. This is an additional data point demonstrating that the equity market has reached a point where the transactions on the margin are all that matter as the core volume/liquidity providers slowly disappear one by one through ongoing deleveraging."

All the above raised serious concern about the sustainability of the current rally. As pointed out by Seeking Alpha, the "rally" could simply be explained by technical factor driven capital-liquidity aberrations- which will continue at most for mere weeks if not days- instead of a rebound in fundamentals in what has all of a sudden become a V-shaped recovery.

What are ETFs?

From the SGX's website, "Exchange Traded Funds (ETFs) are open-ended investment funds listed and traded intraday on a stock exchange. They aim to track the performance of an index and provide access to a wide variety of markets and asset classes".

From the SGX's website, I have tabulated the attractive features offered by ETFs:


Exchange-traded funds offer the following advantages:
* Efficiency: Annual management fees for ETFs are generally less than 1%, enabling investors to obtain cost-efficient exposure to a diversified portfolio of securities through a single transaction.
* Transparency: Investors have ready access to the component securities represented in an ETF. Moreover, market prices are published real-time throughout the trading day.
* Flexibility: An investor can buy and sell ETFs anytime during trading hours and may employ the traditional trading techniques including stop orders, limit orders, margin purchases, and short sales.

Investors should note the following risks associated with ETFs:
* Market risk: An ETF represents interest in a portfolio of securities. Hence, the performance of the ETF will be directly affected by the performance of its constituent securities.
* Tracking error: An ETF may not be able to exactly replicate the performance of the underlying index due to management fees, timing differences and other factors.
* Foreign exchange risk: Investors whose base currency is other than the currency denomination of the ETF will be subject to the risk of fluctuations in currency values.

In our local market, we have 3 listed ETFs:
* FTSE Bursa Malaysia 30 ETF (FBM30etf) [Code: 0820EA],
* MyETF Dow Jones Islamic Market Malaysia Titans 25 (MyETF-DJIM25) [Code: 0821EA], and
* ABF Malaysia Bond Index Funds (ABFMY1) [Code: 0800EA]

All the above three ETFs have very thin trading volume, which is a deterrence to investors. The same problem can also seen in the case of ETFs listed on the Singapore Stock Exchange.

Friday, April 17, 2009

Investing overseas

One of the direct consequence of the 2008 bear market is the establishment of facility by various stockbrokers for their customers to buy stocks overseas. There are some stories making the round where some very fortunate investors had made 200-300% return after investing in Citigroup (Code: C) at less than USD1.00. This in turn has galvanized such excitement that small retailers are beginning to demand for a piece of the action. However, sad stories are conspicuously absent. Who can recall those who have bought into AIG (Code: AIG) at USD5 apiece and are sitting on losses of 60-70%.

I must admit that I have serious misgiving about clients buying stocks in overseas markets. On the one hand, I do not want to prevent an investment that could potentially generate handsome return many years down the road. At the same time, the risk accompanying such investment is not insignificant. Some may say "It is only USD1.00! In the worst-case scenario, all that I would lose is USD1.00!" OK, that's fine, except they are not buying 1,000 or 2,000 units. Some will start telling you that they have saving of RM50,000 & can afford to buy 10,000 units (if the price is at USD1.00... again)! This is what I would call rear-view investing.


Chart 1: C's daily chart as at 16/4/2009 (Source: Stockcharts)

If you really want to crack your head on a real "on-going" case, take a look at General Motor (Code: GM). The news is out there that GM is likely to file for bankruptcy after it failed to secure a USD13.4 billion loan package from the US government. It has debts totaling USD47 billion and burning through USD1 billion cash every three weeks. In the last two years, it reported losses totaling USD69 billion and its shareholders' funds is negative USD86 billion. It is struggling with high wages & unexciting cars line-up.

And, yet its share price closed at USD1.94 yesterday, which is substantially higher than the low of USD1.26 on March 6th. What's happening? Are investors thinking that a deal could be struck whereby every stakeholder would take a cut and GM would be able to pull through as a smaller & leaner automaker. That should be the best-case scenario. What if the unions refused to agree to the demand for lower wages? If the unions would not agree to any concession, could we expect the creditors to agree to a haircut? Obama has a lot riding this. Politically, he cannot walk away from GM after splurging so much to save Wall Street. But, what if Obama stood firm? Then, we may see the worst-case scenario of GM actually filing for bankruptcy. That's brinkmanship, at its best or worst. You must be wondering what all this got to do with buying Citigroup? That's what happened in Citigroup in early March. Fearing bankruptcy or collapse or nationalization, some investors folded first? Or, was it last? That someone could have been you.


Chart 2: GM's daily chart as at 16/4/2009 (Source: Stockcharts)

I am not against buying overseas stocks. My preferred vehicles are ETFs or Exchange Traded Funds. Say, you are interested in banking stocks in US. Then, you may want to buy PowerShares Dynamic Banking Sector (ETF), instead of Citigroup. This may not give you a 200-300% return, but it will definitely be less volatile. One should not have to invest in stocks and forego his sleep.

Thursday, April 16, 2009

Market Outlook as at April 16, 2009

Today, the KLCI closed with a doji, which could be a set up for a temporary top. For confirmation, we will have to wait for the market action tomorrow. In brief, a doji is a term found in Japanese Candlesticks charting when a security or index's open and close are virtually equal. Doji convey a sense of indecision or tug-of-war between buyers and sellers. Prices move above and below the opening level during the session, but close at or near the opening level (for more go here & here). For temporary top to be at hand (and, further correction ahead), tomorrow's market action must be very bearish, such as opening well below today's close & continue to trade lower. If such scenario occurred, then we would be able to sight anyone of these bearish reversal patterns (such as shooting star, evening star or bearish abandoned baby). For more, go here.


Chart 1: KLCI's daily chart as at 16/4/2009 (Source: Quickcharts)

To get a better feel of the market, let's look at the 120-minute chart of our KLCI. We can see that the KLCI's short-term uptrend picked up strongly after it had broken above the short-term downtrend, RR. The uptrend, SS accelerated to become S1S1. The later uptrend will be tested tomorrow and if this failed, the KLCI may slide back to find support at SS (at 900-920 level). Indicators such as MACD & ADX show the KLCI to be vulnerable.


Chart 2: KLCI's 120-min chart as at 16/4/2009 (Source: Quickcharts)

I believe the US markets also look vulnerable after its recent sharp rise. The shape of the 3 main indices (DJIA, S&P500 & Nasdaq) looks like an ascending wedge (also known as a bearish wedge). This pattern has the tendency to correct to the downside. In addition, you may notice that MACD histogram is also sliding lower, which may indicate that the uptrend is losing steam.


Chart 3: DJIA, S&P500 & Nasdaq's daily chart as at 15/4/2009 (Source: Stockcharts)

Maybank on the path for long-term recovery?

As noted yesterday, Maybank has broken above the ascending triangle which signaled the potential for bullish price movement for the stock. I like to point out that this breakout could also signify a reversal of the downtrend that began in January 2008. With this reversal, the stock could begin its long recovery. How do I come to this conclusion?

If you look at the chart below, you will see three triangles (in blue) where the share price was congested for some time. In technical analysis, these triangles would resolve themselves into either a continuation pattern or a reversal pattern. There is a third possibility- where the price would exit through the apex- where we would say that the triangle was unresolved. The first two triangles resulted in a breakout in the same direction as the preceding downtrend and are called continuation pattern. The final triangle resulted in a breakout in the opposite direction to the preceding downtrend and is called a reversal pattern. The only setback is that the breakout was not accompanied by huge volume.

Based on the above, I believe Maybank could be a good long-term BUY. The ideal entry level is at RM4.20.


Chart: Maybank's daily chart as at 15/4/2009 (Source: Tradesignum.com)

I like to remind all Maybank shareholder that the closing date for the Rights Issue is on April 21st (next Tuesday). I have received numerous telephone calls from clients informing me that they have yet to receive their Provisionally Allotment Letter. A few have only received theirs yesterday or the day before. Some were not even aware of the Rights Issue. You may go here to print out the standard Provisionally Allotment Letter. I have informed Maybank (Ms. Edlene of Corporate Services) & Bursa (Mr. Khoo of Listing Department) of this problem. I hope that they can look into this delay.

Media may have bottomed

Background

Let's revisit Media (or, Media Prima), which I have covered previously (here & here). Media Prima Bhd ('Media') is the largest integrated media investment group in Malaysia. Its main businesses are:

1) Television Networks, consisting of Sistem Televisyen Malaysia Berhad (“TV3”), Metropolitan TV Sdn Bhd (“8TV”), Natseven TV Sdn Bhd (“ntv7”) and Ch-9 Media Sdn Bhd (“TV9”);
2) Radio Networks comprising Synchrosound Studio Sdn Bhd (“Hotfm”) and Max-Airplay Sdn Bhd (“Flyfm”); and
3) the Outdoor Division comprising Big Tree Outdoor Sdn Bhd (“BTO”), UPD and The Right Channel Sdn Bhd (“TRC”).

In addition, it has a stake in NSTP, one of Malaysia’s largest publishing groups that publishes leading newspaper titles such as the New Straits Times, Berita Harian and Harian Metro.

Financial Results

For QE31/12/2008, Media reported a net loss of RM8.9 million due to provision for diminution in value of investment of RM31.68 million from a private-equity media funds set up by Media's wholly-owned subsidiary, mm Studios Sdn Bhd & SBC Markwendell Inc (on a 70:30 JV). This exceptional loss has weighed down Media's good performance for the last quarter, where you can see that its pre-tax profit had actually increased by 10.7% q-o-q or 10.3% y-o-y to RM52.2 million while turnover was steady at RM209 million (as compared to RM214 million for QE30/9/2008 or RM199 million for QE31/12/2007).


Valuation

If we ignore the latest result (due to the exceptional loss as noted), Media's full year EPS is about 14 sen. Based on its closed price of RM1.24 yesterday, Media is now trading at a PE of 9 times. I think Media is fairly attractive at that PE multiple.

Technical Outlook

Media may have bottomed out at the RM0.90-1.00 level (after drifting lower for one and a half year from its high of RM3.20 recorded in June 2007). In the past 2 weeks, the volume has picked up and it broke above the strong horizontal resistance of RM1.20-22 yesterday. Media's next upleg could have started.


Chart 1: Media's daily chart as at 15/4/2009 (Source: Quickcharts)


Chart 2: Media's daily chart as at 10/4/2009 (Source: Quickcharts)

Conclusion

Based on attractive valuation & likely technical breakout, Media may be a good stock for a trading BUY.

Timber sector may have bottomed

According to the latest ITTO Tropical Timber Report for the month of April, timber prices remained weak but steady due to difficulty in timber extraction because of thunderstorm (see the table below). As a sign of the difficult time, Sarawak government reduced 2009 timber royalty to a flat rate of RM50 for all timber with a diameter of 30cm or more, after raising to RM65 four months ago.


Chart 1: Movement pf Prices of Timber Products from Jan 2008 to Mar 2009

Despite the above observation, the prices of timber stocks has begun to recover. I have posted on the technical breakout for WTK earlier (here). In addition, Lingui has a bullish breakout above its medium-term downtrend line at the RM0.65 two days ago. Other timber stocks may do the same & recover from their extremely oversold position, just a short 2 or 3 months ago.


Chart 2: Lingui's weekly chart as at 15/4/2009 (Source: Quickcharts)

Wednesday, April 15, 2009

IOI- what's up?

One of the most noticeable under-performer in the current rally is IOICorp. I believe the main reason for this is that IOICorp will be issuing as much as 123.1 million new IOICorp shares under the proposed takeover of IOIProp. IOICorp has earlier proposed to acquire all 199.7 million shares in IOIProp not already owned by IOICorp at an offer price of RM2.598 per IOIProp Share to be satisfied in the following manner :-

i) the issuance of zero-point-six (0.6) ordinary shares of RM0.10 each in IOICorp at an issue price of RM3.78 per IOICorp Share; and

ii) RM0.33 in cash,

for each IOIProp Share held.

The takeover is nearing completion. IOICorp shall post the cash portion of the Offer Consideration and credit the share portion of the Offer Consideration into the Central Depository System accounts of all the Accepting Holders not later than 21 April 2009. I think investors must be worried that the increased supply of IOICorp shares may affect the share price. I believe the effect will not be significant.


Chart: IOI's daily chart as at 14/4/2009 (Source: Quickcharts)

Maybank may have a bullish breakout

Maybank has just broken above its ascending triangle at the RM4.20 level. Its current price is at RM4.28 as at 3.30 pm. The next resistance is at 100-day SMA of RM4.50. Could this breakout signal the start of the recovery in the share price of Maybank (which made a high of RM9.50 in January 2008)? Or, is this merely the result of local funds supporting the stock ahead of the closing date for the acceptance of the Rights Issue (which is on April 21st)?

I think this breakout makes Maybank a trading BUY. I am still cautiously optimistic that we may have seen the worst for Maybank in this cycle.


Chart: Maybank's daily chart as at 14/4/2009 (Source: Tradesignum.com)

Plantation lagging behind CPO rise

In the past few weeks, CPO prices have increased sharply (see Chart 1). Despite an increase of about 20% (to RM2500) for CPO over a period of 1 month, the Plantation has only inched up about 10% to (to 4900). See Chart 2.


Chart 1: CPO's weekly chart as at 14/4/2009 (source: ifs.marketcenter.com)


Chart 2: Plantation's daily chart as at 14/4/2009 (Source: Quickcharts)

The last time the Plantation index was out of sync with the movement of CPO prices was in February/March 2008, when CPO prices was making new high & the Plantation index failed to do the same. See Chart 3 & 4 below.


Chart 3: Plantation's weekly chart as at 14/4/2009 (Source: Quickcharts)


Chart 4: CPO's weekly chart as at 11/7/2008 (source: ifs.marketcenter.com)

Based on the February/March 2008 experience, we may conclude that the crowd in the stock market is more sanguine than those in the commodity pit. If the same holds true today, we may expect the rally in CPO prices to correct shortly. We must bear in mind that CPO production is seasonal, with output skewed towards the 2nd half of the calender year on a 55:45 ratio (i.e. the output for the 2nd half is 22% higher than the first half). As such, we can expect CPO prices to come under pressure in the later part of the year. Those with plantation stocks that have run up very well (eg. Asiatic & KLK) may use this rally to take some profit.

Tuesday, April 14, 2009

WTK may have a bullish breakout

WTK has just broken above its symmetrical triangle at RM0.80-82. It made an intra-day high of RM0.89 before profit-taking set in. As at 12.00 noon, WTK was trading at RM0.87.


Chart 1: WTK's daily chart as at 14/10/2009 (Source: Quickcharts)


Chart 2: WTK's daily chart as at 14/10/2009 (Source: Quickcharts)

Financial Results & Position

For FYE31/12/2008, WTK's net profit dropped 13.8% from RM59 million to RM51 million. This happened despite a 18.5%-increase in turnover from RM686 million to RM814 million.

For FYE31/12/2008, the timber division registered a turnover of RM679.3 million, representing an increase of 27.0% while its pre-tax profit decreased by 10.4% to RM62.8 million. The drop in the pre-tax profit is the result of a significant increase in production costs experienced during second and third quarter 2008. The average round log prices increased 3.6% whilst volume remained flat. At the same time, average plywood prices were higher by 11.4%, whilst sales volume increased by 43.4%.

The non-timber division registered a turnover of RM131.2 million, representing a decline of 11.8% while its pre-tax profit also reduced by RM3.2 million to RM1.9 million as compared to the corresponding period last year (RM5.1 million). The decrease in both turnover and pre-tax profit was mainly due to weakening demand in both domestic and export markets.

WTK's financial position is satisfactory with current ratio at 2.1 times & gearing ratio at only 0.23 times.


Conclusion

Based on technical bullish breakout, I believe WTK could be a good trading BUY.

Monday, April 13, 2009

Proton could be a trading BUY

Proton has a big move today. As at 3.30 pm, it is trading at RM2.35, off its high of RM2.40. Its Friday closing price was RM1.99 only.

From Chart 1 below, we can see that Proton has broken above its first resustance at RM2.05. The next resistance levels are RM2.65 & RM2.90.


Chart 1: Proton's daily chart as at 10/4/2009 (Source: Tradesignum.com)

From the long-term chart (Chart 2), we can see that Proton has broken above its medium-term downtrend line resistance at RM1.75 on the previous Friday (April 3rd). On the same day, Proton has broken above its 100-day SMA at RM1.78. The only significant news prior to the current price rally was the announcement of a strategic licensing and contract assembly agreement that allows Detroit Electric to utilize PROTON platforms for its production of Pure Electric Cars (PEV) on March 30th (here). Could this have spur such a strong upleg for Proton?


Chart 2: Proton's daily chart as at 10/4/2009 (Source: Tradesignum.com)

Financial Results & Position

Proton's financial results is poor as expected for the QE31/12/2008. See below.


Its financial position is fairly satisfactory, with current ratio at 1.9 times and gearing ratio at 0.05 times.

Conclusion

Based on the bullish breakout above the medium-term downtrend line, Proton could be a trading BUY. A good entry level is at RM2.00-10.

NSTP- a quick look

Background

Like many stocks in the market, NSTP has recovered somewhat in the past few weeks. Recent purchasers of this stock may be attracted to its First & Final dividend of 8 sen which will go ex on April 28th.

Financial Results

NSTP, the publisher of the second largest-circulation English daily in Malaysia (New Straits Times), has been struggling to recapture its glory days after its main paper being dethroned by its rival, the Star. Looking at the last 8 quarters' results, I would say that NSTP's financial performance has shown steady improvement (see Table 1). This is consistent with its performance for the last 5 years' results (see Table 2).


Table 1: NSTP's 8Qs


Table 2: NSTP's last 5-year Financial Highlights

Financial Position

NSTP's financial position is satisfactory as at 31/12/2008. Current ratio is adequate at 1.8 times. Gearing ratio is low as borrowing is negligible (about RM29.5 million against Shareholders' Funds of RM985 million).

Valuation

Based on the last 4 quarters' EPS totaling 22 sen, NSTP- closed at RM1.19 at the end of today's morning session- is now trading at a trailing PE of 5.4 times. I think NSTP is fairly attractive at this PE multiple.

Technical Outlook

The stock seems to have completed a rounding bottom at about the RM1.00 level. It has broken above its immediate downtrend line at RM1.05 level but has yet to break above its medium-term downtrend line, with resistance at RM1.50-55 level.


Chart: NSTP's weekly chart as at 10/4/2009 (Source: Quickcharts)

Conclusion

Based on undemanding valuation, improved financial performance & more positive technical outlook, NSTP could be a good stock for long-term investment.

Friday, April 10, 2009

MNRB- a good long-term BUY

Background

Another insurance player that we can look at is MNRB Holdings Bhd ('MNRB'). It is involved in re-insurance as well as in takaful insurance.


Past Financial Results

Its past 5 years' results have been quite encouraging. However, it must be noted that its results for FY2008 was boosted by an extraordinary profit of RM75.4 million from the disposal of its 3.24%-stake in MOX to Aga Aktiebolag for RM17.00 per share.


Recent Financial Results

MNRB's last 2 quarters' results have been disappointing. It reported a net loss of RM13.3 million & RM13.8 million for 2Q2009 & 3Q2009, respectively. The loss was due to higher claim incurred by the re-insurance subsidiary as well as additional provision for diminution in value of quoted securities.


Valuation

Ignoring the recent losses- which is either one-off (in the case of the higher claim from the re-insurance business) or fairly common (in the case of provision for diminution in value of quoted securities during bear market), we can expect MNRB's earning to rebound back to 40-50 sen when the economy recovers in 1 to 2 years' time. As such, the stock is now trading at a forward PE of 6-7 times. That's fairly attractive.

Technical Outlook

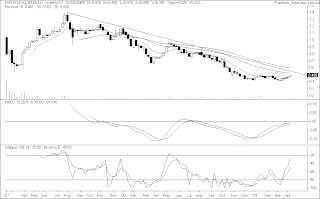
MNRB has a recent low of RM2.60 in March 2009 that's lower than the low of RM2.73 recorded in December last year. As it has yet to put in a decent rebound, we may not have seen the low in this current cycle for this stock. However I believe that the stock's downside may be limited, given the recovery in broader stock market would be supportive of this stock at its present price.


Chart: MNRB's monthly chart as at 10/4/2009 (Source: Quickcharts)

Conclusion

Based on sharp drop in share price & potential recovery in the economy, MNRB could be a good long-term BUY at the current price.

Oil & Gas- check out the laggards

Some of the established Oil & Gas stocks have done very well in the current rally. Most of them have risen quite substantially & have even broken above their medium-term downtrend line. This includes the following stocks (& their breakout level):

1. Dialog (RM0.88-90)
2. EPIC (RM1.15-20)
3. Kencana (RM1.30-35)
4. Sapcres (RM0.88-90)


Chart 1: EPIC's weekly chart as at 10/4/2009 (Source: Quickcharts)


Chart 2: Dialog's weekly chart as at 10/4/2009 (Source: Quickcharts)


Chart 3: Sapcres's weekly chart as at 10/4/2009 (Source: Quickcharts)


Chart 4: Kencana's weekly chart as at 10/4/2009 (Source: Quickcharts)

For the above stocks, you may wait & buy on a pullback. You can also take a look at some of the newer players in Oil & Gas, which seems to lag behind the more established players in the current price run-up. They are listed in the table below.


Chart 5: Dayang's weekly chart as at 10/4/2009 (Source: Quickcharts)


Chart 6: Deleum's weekly chart as at 10/4/2009 (Source: Quickcharts)


Chart 7: Pantech's weekly chart as at 10/4/2009 (Source: Quickcharts)


Chart 8: Penergy's weekly chart as at 10/4/2009 (Source: Quickcharts)