Less than 1 month in office, President Trump has managed to get himself in a fine mess!. It started when he signed an executive order to ban the entry into the US of nationals from 7 predominantly Muslim countries as well as the resettlement of Syrian refugees in the US. These twin bans - travel ban and immigration ban - were successfully challenged in US courts.
The crisis has now morphed into what could potentially be a constitutional crisis due to the sacking of the Acting Attorney General Sally Yates by President Trump for her refusal to challenge the court rulings to suspend the executive order.
A few pundits have expressed opinions that a Trump Presidency could end in a constitutional crisis and his impeachment right after his surprise election in November. One of the most recent articles on this topic was penned by Robert Kuttner of the American Prospect, entitled "The Inevitability of Impeachment" (here). Trump has many problems which are partly due to his psychological conditions as well as what he perceives to be his role in the Government. Michael Lewis said it best when he shared his fear of what the leader of a group of angry people could do (that's Trump) when he achieved power (here).
With the travel & immigration bans spinning out of control, Republicans in the Congress are becoming very uneasy with Trump's erratic behavior and Democrats are becoming more vocal. As calls for his impeachment gain momentum, the fear of a constitutional crisis could quickly spill over to the US stock market. As we all know, the market abhors uncertainties. We have only to look back to the Watergate crisis and Nixon impeachment to see how the stock market reacted to uncertainties in Washington then (here). Thus, we should be very careful over the next few weeks.
Tuesday, January 31, 2017
Tenaga: A Potential Bearish Reversal?
Tenaga broke the strong support from the horizontal line at RM13.50-13.55. This is not your normal breakdown of horizontal line support; this is the breakdown of the neckline of a Head and Shoulders formation. The only consolation is that the breakout is not accompanied by an increase in volume. I hope that Tenaga will stage a strong rebound soon.
Because of the breakdown, the technical outlook for Tenaga contradicts with the positive fundamental outlook for the stock. Thus long-term investors would certainly be in a difficult dilemma: To hold, to buy or to sell?? Let's forget about the next question: WHY? for now.

Chart 1: Tenaga's daily chart as at Jan 31, 2017_11:30
For now, I would say that if Tenaga can recover above the RM13.55 mark again, it would be a good BUY. Failure to break the neckline of a Head and Shoulders formation - normally a reversal pattern - would automatically convert it into a continuation pattern. However, if the breakdown is followed by continuous price decline on increased volume, then the bearish reversal is at hand. We must adopt the bearish view for Tenaga. It could easily slide to RM12.00-12.20 before any rebound kicks in.

Chart 2: Tenaga's monthly chart as at Jan 31, 2017_9.35
Based on the above, you should be very careful in buying into the current price decline in Tenaga. The correct approach is to sell if the price fails to recover above RM13.50. You should only buy if Tenaga can recover above RM13.50. Good luck!!
Note:
I hereby confirm that I do not have any direct interest in the security or securities mentioned in this post. However, I could have an indirect interest in the security or securities mentioned as some of my clients may have an interest in the acquisition or disposal of the aforementioned security or securities. As investor, you should fully research any security before making an investment decision.
UMW: Over-stretched
UMW had a fine run after our buy call on Jan 25. The rally was given a boost by the announcement of Sime's proposed split & listing of its plantation & property businesses. For now, UMW - which I rate as a long-term BUY - is pretty stretched. I doubt it can surpass the resistance at the horizontal line at RM6.00-6.05. Its immediate support is at the horizontal line at RM5.80.
Based on strong price run-up, I think UMW could be a good trading SELL at RM5.90-6.00. If you wish to buy for long investment, you should wait for the price to pullback to RM5.50 or below.

Chart: UMW's daily chart as at Jan 27, 2017
Note:
I hereby confirm that I do not have any direct interest in the security or securities mentioned in this post. However, I could have an indirect interest in the security or securities mentioned as some of my clients may have an interest in the acquisition or disposal of the aforementioned security or securities. As investor, you should fully research any security before making an investment decision.
Friday, January 27, 2017

Sime: Let's Do The Split!
Sime Darby has announced plans to spin off its plantations and
property businesses in separate listings on Bursa
Malaysia yesterday (here). This is one part of PNB's Strategic Plan 2017-2022 (here) which calls for better domestic public equity performance in order to increase its return to its investors. I have touched on this in my post on UMW two days ago.
In the Star newspaper article, CIMB has raised its target price for Sime to RM9.80. Let's see what the charts say. The weekly chart shows an upside breakout of a rising wedge (ABCD) at RM8.35 on Jan 4. After that, SIme slowly rose up to RMRM8.82 yesterday. With the announcement yesterday of its spin-off plans, Sime share price broke above the psychological RM9.00 mark as well as the horizontal line at RM9.20. The next resistance will come from the line connecting the peaks in 2012-2015 at RM9.50.

Chart 1: Sime's weekly chart as at Jan 27, 2017_10.00
If Sime can break above the RM9.50 mark as well as the RM10.00, it may go into an exponential rise akin to what we saw in 2007 when it merged with a few plantation companies from PNB stable to form Synergy Drive (later renamed Sime again). It would be a perfect irony for a stock to rocket higher twice; once when it became a global plantation giant and again it is no longer that title!

Chart 2: Sime's monthly chart as at Jan 27, 2017_9.45
Based on the potential value from a break-up, Sime is worth investing in provided there is sufficient meat on the bone. If Sime were to pullback to RM9.00 or below, it could be a worthwhile investment. For the more speculative players, you may add your position if Sime were to surpass the RM10.00. Good luck!
Note:
I hereby confirm that I do not have any direct interest in the security or securities mentioned in this post. However, I could have an indirect interest in the security or securities mentioned as some of my clients may have an interest in the acquisition or disposal of the aforementioned security or securities. As investor, you should fully research any security before making an investment decision.
Thursday, January 26, 2017
Plantation Stocks: Limited Upside
There is a divergence between the steady rise in CPO prices and the stagnant share prices of many plantation stocks. Look at the CPO and Plantation Index charts below.

Chart 1: CPO's weekly chart as at Jan 10, 2017 (Source: ifs.marketcenter.com)

Chart 2: Plantation index's monthly chart as at Jan 26, 2017
Share prices of plantation stocks remain stagnant because earnings of many plantation companies have remained stagnant. That's the surprising conclusion I got when I tallied up the earnings of 4 plantation companies which are mainly concentrated in the plantation business. Notice that earnings peaked in 2011 while their revenues continue to rise.

Table: Selected Plantation Companies' Revenue & Earnings for past 12 years
Now, we know that CPO prices in MYR have risen in the past 6-7 months because of two factors: lower CPO output (due to lower FFB output because of the El Nino effect) as well as the weakening of MYR. What would happen to CPO prices in MYR if MYR strengthens (or USD-MYR weakens) or when FFB output increases as the El Nino effect subsides. Chart 3 below shows that USD-MYR has probably made a temporary top.

Chart 3: USD-MYR's weekly chart as at Jan 26, 2017 (Source: Investing.com)
CPO prices in USD has limited upside as it struggles to overcome the "horizontal line" at USD600.

Chart 4: CPO (USD)'s weekly chart as at Jan 26, 2017 (Source: Investing.com)
If CPO prices in USD and USD-MYR begin to correct, we will see a bearish reversal in CPO prices in MYR. This will lead to a drop in the overall earnings of plantation companies and eventually a decline in their share prices. Thus we have to be careful not to be overly-exposed to the plantation sector.
Genting: Poised To Go Up?
This morning, Genting broke above its recent intra-day high of RM8.40 recorded on Jan 12 & 16. It is now trading at RM8.50 which I consider to be the last stop before a quick rally to test the long-term downtrend line, RR at RM9.50. Genting had two important bullish breaks this month: the upside breakout of the horizontal line of RM8.20 on Jan 11 & the upside breakout of the intermediate downtrend line, R2-R2 at RM8.00 on Jan 5. Look at Chart 1 & 2 below.

Chart 1: Genting's daily chart as at Jan 26, 2017

Chart 2: Genting's weekly chart as at Jan 26, 2017
The confirmation I am looking for is Genting-WA breaking above its horizontal line at RM1.52-1.53. You may see from the chart below that this warrant was quite unexcited by the above upside breakouts in the share price.

Chart 3: Genting-WA's weekly chart as at Jan 26, 2017
Based on the bullish technical outlook, Genting is considered a possible trading BUY. You may choose to take a small position in Genting now and add to that position when Genting-WA breaks above the RM1.52-1.53 level. Good luck!
Note:
I hereby confirm that I do not have any direct interest in the security or securities mentioned in this post. However, I could have an indirect interest in the security or securities mentioned as some of my clients may have an interest in the acquisition or disposal of the aforementioned security or securities. As investor, you should fully research any security before making an investment decision.
MPI: Top-line and Bottom-line Rose Strongly
Result Update
For QE31/12/2016, MPI's net profit rose 38% q-o-q or 67% y-o-y to RM55 million while revenue rose 12% q-o-q or 6% y-o-y to RM401 million. PBT rose q-o-q due to higher revenue & strengthening of USD-MYR. Revenue rose due to increased sales to the Asia, USA and European segments by 11%, 20% and 7%.

Table: MPI's last 8 quarterly results

Graph: MPI's last 40 quarterly results
Valuation
MPI (closed at RM7.95 yesterday) is now trading at a trailing PER of 8.8 times (based on last 4 quarters' EPS of 90.75 sen). At this PER, MPI is deemed fairly attractive. Its dividend yield is also decent at 2.9%.
Technical Outlook
MPI has been in a steady uptrend since it broke above its long downtrend line in early 2013. It tested its current uptrend line support at RM7.20-7.30 from November to December last year. At the start of this year, MPI rebounded from the uptrend line and may soon test the resistance from the horizontal line at RM8.10-8.20.

Chart 1: MPI's monthly chart as at Jan 25, 2017

Chart 2: MPI's weekly chart as at Jan 25, 2017
Conclusion
Based on improved financial performance, attractive valuation and mildly positive technical outlook, I revise MPI's rating from a HOLD to a BUY.
Note:
I hereby confirm that I do not have any direct interest in the security or
securities mentioned in this post.
However, I could have an indirect interest in the security or securities
mentioned as some of my clients may have an interest in the acquisition or
disposal of the aforementioned security or securities. As investor, you should fully research any
security before making an investment decision.
Wednesday, January 25, 2017
UMW: A Long Recovery Ahead
Background
UMW was identified by PNB as one of the strategic listed companies in its investment portfolio that will come under corporate exercise in order to boost PNB's domestic public equity performance. In another word, UMW share price will likely to rise after some form of restructuring. This was announced in November under its Strategic Plan 2017-2022 (here).
Last week, UMW announced its divestment of its listed O&G vehicle, UMWOG plus the sale/transfer of its unlisted O&G companies to UMWOG (here). The game plan is simple; both parent and subsidiary had been badly dragged down by their O&G business. This losses is reflected in UMWOG's financial and share price performance. Unfortunately it is also dragging down UMW's financial and share price performance.
By splitting the O&G business from its stable, UMW expects its financial performance to improve in the near future. This will lead to an immediate rise in its share price. PNB will immediately benefit from the share price movement while it's shielded from the drop in UMWOG's share price (as UMWOG is still carried on UMW's book). Once UMWOG is divested from UMW to PNB, the investment in UMWOG will be booked in at spin-off price (with no loss to PNB). Over the next few quarters or years, UMWOG's financial performance should recover and its share price should go higher. At this point, the higher UMWOG share prices will lead to the second round of benefit to PNB.
Financial Performance
UMW reported net losses in 3 of the last 4 quarters. As a result, its net loss totaled RM410 million for the last 4 quarters as compared to net profit of RM77 million in the preceding 4 quarters.

Table 1: UMW's last 8 quarterly results
For QE30/9/2016, overall revenue was slightly higher (up RM10 million) but the group reported a LBT of RM122 million as compared to PBT of RM45 million previously. This was mainly due to increased LBT from UMWOG (from RM64 million to RM133 million).

Table 2: UMW's segmental results for QE30/9/2016 & QE30/6/2016
For 9-month ended 30/9/2016, overall revenue dropped RM2.36 billion due to lower revenue from all the divisions (especially Automotive, Equipment & UMWOG). This led to a LBT of RM56 million compared to a PBT of RM600 million previously. The 3 worst performing divisions are: Automotive, Equipment & UMWOG.

Table 2: UMW's segmental results for 9-month ended 30/9/2016 & QE30/9/2015
On the graph, the plunge in revenue is clearly visible but profits began to drop in early 2014.

Graph: UMW's last 38 quarters' results
Financial Position
As reported in the Edge Daily, the demerger of UMWOG will help to lower UMW's gearing ratio from 0.7x to 0.5x.
Valuation
UMW (closed at RM5.38 in the morning session) is now trading at a PBR of 1 time. As its earning is negative, it is meaningless to compute its PER. Dividend for last 4 quarters amounted to 10 sen- a drop from 26 sen previously. If dividend were to recover back to 26 sen, the dividend yield of 4.8% would be a big draw for UMW. [Note: In its latest report, CIMB revised the rating for UMW from REDUCE to ADD and raised its fair value for UMW to RM5.10 (here).]
Technical Outlook
UMW has dropped a long way from around RM13.50 in early 2013 to a recent low of RM4.50. That low was very close to its long-term uptrend line.

Chart 1: UMW's monthly chart as at Jan 23, 2017
UMW has since rebounded off its long-term uptrend line. It may test the strong resistance at the horizontal line at RM5.50-5.60. This resistance coincides with its intermediate downtrend line.

Chart 2: UMW's weekly chart as at Jan 23, 2017
Conclusion
Based on expected improvement in financial performance & position (following the demerger of UMWOG) and potential price recovery (after its long decline), UMW could be a good stock for long-term investment.
Note:
I hereby confirm that I do not have any direct interest in the security or securities mentioned in this post. However, I could have an indirect interest in the security or securities mentioned as some of my clients may have an interest in the acquisition or disposal of the aforementioned security or securities. As investor, you should fully research any security before making an investment decision.
UMW was identified by PNB as one of the strategic listed companies in its investment portfolio that will come under corporate exercise in order to boost PNB's domestic public equity performance. In another word, UMW share price will likely to rise after some form of restructuring. This was announced in November under its Strategic Plan 2017-2022 (here).
Last week, UMW announced its divestment of its listed O&G vehicle, UMWOG plus the sale/transfer of its unlisted O&G companies to UMWOG (here). The game plan is simple; both parent and subsidiary had been badly dragged down by their O&G business. This losses is reflected in UMWOG's financial and share price performance. Unfortunately it is also dragging down UMW's financial and share price performance.
By splitting the O&G business from its stable, UMW expects its financial performance to improve in the near future. This will lead to an immediate rise in its share price. PNB will immediately benefit from the share price movement while it's shielded from the drop in UMWOG's share price (as UMWOG is still carried on UMW's book). Once UMWOG is divested from UMW to PNB, the investment in UMWOG will be booked in at spin-off price (with no loss to PNB). Over the next few quarters or years, UMWOG's financial performance should recover and its share price should go higher. At this point, the higher UMWOG share prices will lead to the second round of benefit to PNB.
Financial Performance
UMW reported net losses in 3 of the last 4 quarters. As a result, its net loss totaled RM410 million for the last 4 quarters as compared to net profit of RM77 million in the preceding 4 quarters.

Table 1: UMW's last 8 quarterly results
For QE30/9/2016, overall revenue was slightly higher (up RM10 million) but the group reported a LBT of RM122 million as compared to PBT of RM45 million previously. This was mainly due to increased LBT from UMWOG (from RM64 million to RM133 million).

Table 2: UMW's segmental results for QE30/9/2016 & QE30/6/2016
For 9-month ended 30/9/2016, overall revenue dropped RM2.36 billion due to lower revenue from all the divisions (especially Automotive, Equipment & UMWOG). This led to a LBT of RM56 million compared to a PBT of RM600 million previously. The 3 worst performing divisions are: Automotive, Equipment & UMWOG.

Table 2: UMW's segmental results for 9-month ended 30/9/2016 & QE30/9/2015
On the graph, the plunge in revenue is clearly visible but profits began to drop in early 2014.
Graph: UMW's last 38 quarters' results
Financial Position
As reported in the Edge Daily, the demerger of UMWOG will help to lower UMW's gearing ratio from 0.7x to 0.5x.
Valuation
UMW (closed at RM5.38 in the morning session) is now trading at a PBR of 1 time. As its earning is negative, it is meaningless to compute its PER. Dividend for last 4 quarters amounted to 10 sen- a drop from 26 sen previously. If dividend were to recover back to 26 sen, the dividend yield of 4.8% would be a big draw for UMW. [Note: In its latest report, CIMB revised the rating for UMW from REDUCE to ADD and raised its fair value for UMW to RM5.10 (here).]
Technical Outlook
UMW has dropped a long way from around RM13.50 in early 2013 to a recent low of RM4.50. That low was very close to its long-term uptrend line.

Chart 1: UMW's monthly chart as at Jan 23, 2017
UMW has since rebounded off its long-term uptrend line. It may test the strong resistance at the horizontal line at RM5.50-5.60. This resistance coincides with its intermediate downtrend line.

Chart 2: UMW's weekly chart as at Jan 23, 2017
Conclusion
Based on expected improvement in financial performance & position (following the demerger of UMWOG) and potential price recovery (after its long decline), UMW could be a good stock for long-term investment.
Note:
I hereby confirm that I do not have any direct interest in the security or securities mentioned in this post. However, I could have an indirect interest in the security or securities mentioned as some of my clients may have an interest in the acquisition or disposal of the aforementioned security or securities. As investor, you should fully research any security before making an investment decision.
Tuesday, January 24, 2017
DIGI: Lower Profits On Better Revenue
Result Update
For QE31/12/2016, DIGI's net profit dropped 14.5% q-o-q or 2% y-o-y to RM375 million while revenue was mixed - up 3% q-o-q but down 3% y-o-y to RM1.67 billion. Revenue rose marginally q-o-q due to solid postpaid growth momentum and stronger internet adoption which offset weaker prepaid business. While EBITDA & PBT dropped q-o-q after accounting for associated cost for the higher device sales, increased marketing cost in supporting subscriber acquisition and progressive network expansion cost. Nevertheless EBITDA margin remained robust at 44% following strong operational efficiency discipline and well-managed cost structure.

Table: DIGI's last 8 quarterly results
Despite the decline in profits and profit margins last quarter - the fourth quarter is normally a weaker quarter - we can see the net profit number was not too far from the RM400 million mark.

Graph: DIGI's last 39 quarterly results
Valuation
DIGI (closed at RM4.92 yesterday) is now trading at a trailing PER of 23 times (based on last 4 quarters' EPS of 21.0 sen). DIGI's high PER is somewhat mitigated by decent dividend yield of 4.2%.
Technical Outlook
DIGI broke above its intermediate downtrend line at RM4.90 in August last year. Since then, it had traded sideways between RM4.80 & RM5.00. The last time it traded sideways after a breakout of a downtrend line was from September 2013 to February 2014 - between RM4.00 & RM4.30. After it broke to the upside of that range, it rallied all the way to RM6.00-6.20. (Note: DIGI actually broke down in January 2014 before it broke up!)

Chart 1: Digi's weekly chart as at Jan 23, 2017

Chart 2: Digi's monthly chart as at Jan 23, 2017
Conclusion
Despite the relatively high PER, Digi is rated a HOLD based on improved performance over the past few quarters (albeit weaker one in QE31/12/2016), decent dividend yield and mildly positive technical outlook.
Note:
I hereby confirm that I do not have any direct interest in the security or securities mentioned in this post. However, I could have an indirect interest in the security or securities mentioned as some of my clients may have an interest in the acquisition or disposal of the aforementioned security or securities. As investor, you should fully research any security before making an investment decision.
Wednesday, January 18, 2017
CMSB: Next Upleg Has Just Begun

Chart 1: CMSB's daily chart as at Jan 18, 2017_10.45am (Source: TradingView.com)
Yesterday CMSB broke above the strong horizontal line, AB at RM4.00 on big volume. This morning, we saw a follow-thru in the buying which led to further increase in the share price.

Chart 2: CMSB's weekly chart as at Jan 18, 2017_10.45am (Source: TradingView.com)
I believe that this could be the beginning of the next upleg for CMSB as the market anticipates higher earnings from the Group from higher contribution from OM Material as well as its cement & other building material divisions due to the start of the Pan Borneo Highway. Based on technical breakout, CMSB is a good trading BUY, with immediate resistance at RM4.70, RM5.00 7 RM5.40. However, CMSB is also a good stock to consider for long-term investment due to its exposure to the growing Sarawak economy.
Note:
I hereby confirm that I do not have any direct interest in the security or
securities mentioned in this post.
However, I could have an indirect interest in the security or securities
mentioned as some of my clients may have an interest in the acquisition or
disposal of the aforementioned security or securities. As investor, you should fully research any
security before making an investment decision.
Monday, January 16, 2017
Magni: Next Upleg Could Have Started
Magni broke above its "horizontal line" at RM4.38-4.40 today to close at RM4.54. If the share price can stay above the breakout level for next 1/2 day(s), Magni may continue with its prior uptrend. As noted in my recent post, Magni's financial performance has been very impressive in QE31/10/2016. Based on technical breakout, Magni - a good long-term investment- could well be a good trading BUY too.

Chart 1: Magni's weekly chart as at Jan 16, 2017 (Source: Chartnexus)

Chart 2: Magni's monthly chart as at Jan 16, 2017 (Source: Chartnexus)
Note:
I hereby confirm that I do not have any direct interest in the security or securities mentioned in this post. However, I could have an indirect interest in the security or securities mentioned as some of my clients may have an interest in the acquisition or disposal of the aforementioned security or securities. As investor, you should fully research any security before making an investment decision.
Saturday, January 14, 2017
Compiling A 8-Quarter P&L Table
Today I have posted my second instructional video on YouTube. In the first video, we looked at how to study quarterly result announcements on
Bursa Malaysia. Once we have identified a stock that's either performing well financially or trading at an attractive valuation, the next step is to study the stock or the company in greater depth. I would normally do that by constructing a 8-quarter P&L table- which is the objective of this 2nd video. The link to the video is here.


Thursday, January 12, 2017
JAKS: Next Upleg Has Begun
On January 10, PublicInvest Research called a BUY on JAKS witha fair value of RM1.50 (here). This has prompted the stock to rally yesterday above its horizontal line at RM1.09.
If JAKS can stay above the resistance-turned-support of RM1.09, then JAKS could be a good trading BUY.

Chart 1: JAKS's daily chart as at Jan 11, 2017 (Source: Chartnexus)
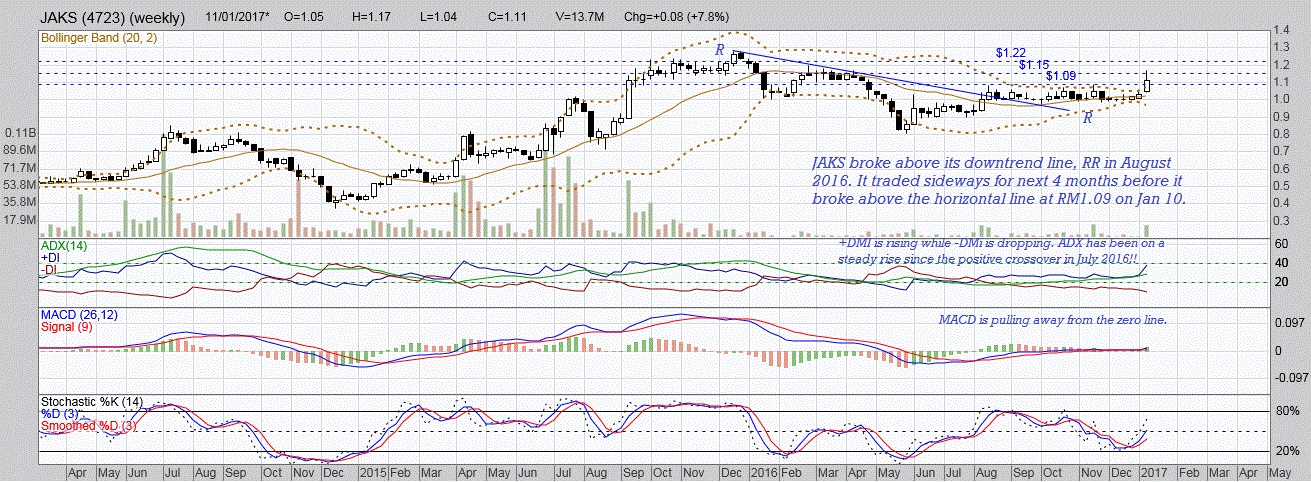
Chart 2: JAKS's weekly chart as at Jan 11, 2017 (Source: Chartnexus)
Note:
I hereby confirm that I do not have any direct interest in the security or securities mentioned in this post. However, I could have an indirect interest in the security or securities mentioned as some of my clients may have an interest in the acquisition or disposal of the aforementioned security or securities. As investor, you should fully research any security before making an investment decision.
MBSB: Next Upleg Has Begun
If MBSB can stay above the horizontal line at RM0.96, it may be a good trading BUY.

Chart 1: MBSB's daily chart as at Jan 11, 2017 (Source: Chartnexus)

Chart 2: MBSB's weekly chart as at Jan 11, 2017 (Source: Chartnexus)
Note:
I hereby confirm that I do not have any direct interest in the security or securities mentioned in this post. However, I could have an indirect interest in the security or securities mentioned as some of my clients may have an interest in the acquisition or disposal of the aforementioned security or securities. As investor, you should fully research any security before making an investment decision.
Wednesday, January 11, 2017
Adenan Satem: A True Malaysian Leader
When you lead the Government, you are no longer the leader of your party or your coalition or your race. You have transcended to be the father of the state or the nation. As a father, you must act with fairness towards everyone. Many of our leaders failed in this test. They failed because they bowled to the pressure & the heat from their party, their coalition & their people and, thus, were unable to do the right thing for all the people and the state or the nation. If Malaysia ever hopes to progress as a developed nation - with a united citizenry - we must find more leaders like Adenan Satem.
Thank you, Adenan Satem. May your soul find eternal peace!

Via Malaysiakini
Tuesday, January 10, 2017
CPO, WTIC, USD Index & USD-MYR: All Looking Toppish

Chart 1: CPO's weekly chart as at Jan 10, 2017 (Source: ifs.marketcenter.com)

Chart 2: CPO's daily chart as at Jan 10, 2017 (Source: ifs.marketcenter.com)
WTIC also shows signs of weakness. It is likely that WTIC may pullback towards the uptrend line, SS at USD46.

Chart 3: WTIC's daily chart as at Jan 9, 2017 (Source: Stockcharts.com)
Rising crude oil and crude palm oil prices over the past few weeks failed to support MYR. That's because USD index continued to strengthen. Despite bearish divergence in the RSI and MACD, USD index is expected to continue to trend higher since it broke above the range of 93-101.

Chart 4: USD Index's daily chart as at Jan 9, 2017 (Source: Stockcharts.com)
A rising USD index will likely to drag USD-MYR higher. However, we can see that USD-MYR has been well-checked by the horizontal resistance at 4.47-4.48. Recent Bank Negara counter-measures and firmer prices for CPO & crude oil could have counter-balance a rising USD index and kept the USD-MYR below 4.50. If Trump's ascendancy to the US Presidency on January 20 were to unnerve in the market, this could well lead to a correction in USD index and a pullback in USD-MYR. However, USD-MYR is unlikely go below the 4.20 mark in the near term.

Chart 5: USD-MYR's daily chart as at Jan 10, 2017 (Source: Stockcharts.com)
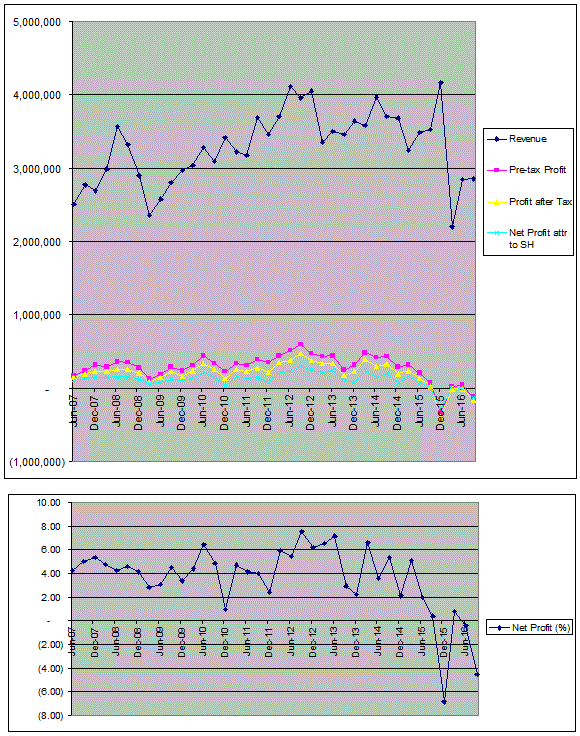
Yeelee: At The Cusp of Uptrend Acceleration?
For QE30/9/2016, YeeLee's net profit increased by 8% q-o-q or 28% y-o-y to RM10.9 million while revenue was mixed - down 6% q-o-q but up 25% y-o-y to - RM248 million. PBT rose q-o-q mainly due to higher sales of aerosol cans and palm oil mill able to turnaround in this quarter with better OER and higher fresh fruit bunches ("FFB") processed offsetting the lower sales of consumer products in trading division. {Note: The result for QE30/9/2016 was announced on November 24, 2016.]
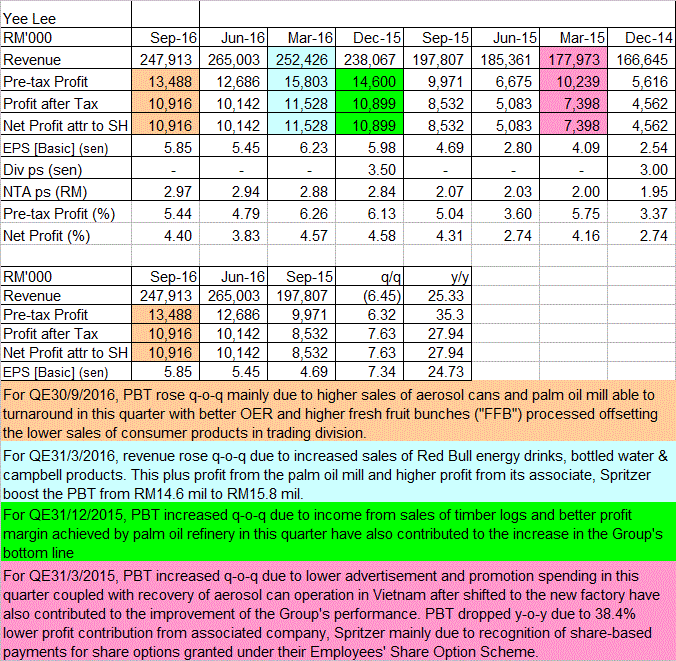
Table: YeeLee's last 8 quarterly results

Graph: YeeLee's last 41 quarterly results
Valuation
YeeLee (closed at RM2.55 at the close of the morning session) is now trading at a PE of 10.9 times (based on last 4 quarters' EPS of 23.5 sen). At this PER, YeeLee is deemed quite attractive for a well-diversified group with large exposure to consumer spending. While its dividend yield is low at 1.4%, it's trading at a discount of 14% to its book value (of RM2.97 as at 30/9/2016).
Technical Outlook
YeeLee is in a long-term uptrend. Its uptrend is however capped by the line connecting its recent peaks, RR. The stock is now pushing against that resistance line. If it can break above this line at RM2.55-2.60, its uptrend may accelerate.

Chart 1: YeeLee's monthly chart as at Jan 10, 2017_12.30 (Source: Chartnexus)
I have also appended the weekly and daily charts to show the critical resistance level of RM2.55-2.60 that's checking the stock's upside.

Chart 2: YeeLee's weekly chart as at Jan 10, 2017_12.30 (Source: Chartnexus)

Chart 3: YeeLee's daily chart as at Jan 10, 2017_12.30 (Source: Chartnexus)
Conclusion
Based on good financial performance, attractive valuation & positive technical outlook, YeeLee is a good stock to hold for long-term investment. The uptrend may accelerate once the share price can breach the resistance level of RM2.55-2.60.
Note:
I hereby confirm that I do not have any direct interest in the security or securities mentioned in this post. However, I could have an indirect interest in the security or securities mentioned as some of my clients may have an interest in the acquisition or disposal of the aforementioned security or securities. As investor, you should fully research any security before making an investment decision.
Market Outlook as at January 10, 2017
- Expanding Bollinger Band;
- MACD crossing above its signal line as well as going above the zero line; and
- +DMI above the -DMI plus rising ADX.

Chart 1: FBMKLCI's daily chart as at Jan 10, 2017 (Source: Chartnexus)
If you look back to April 2015 when we last had an upside breakout of the downtrend line, we will see the similarity with we have today, which are +DMI above -DMI (briefly) unaccompanied by rising ADX; MACD struggling to cross above the zero line; and relatively small volume. Thus the case for a decent rally in the market - think CNY rally - is not an open-and-shut case as yet. It is still a work-in-progress and as such, we have to be careful. By that I mean you need to sell if your stocks are knocking against resistance and buying small positions even if you see a breakout. As always, good luck in your trades.

Chart 2: FBMKLCI's weekly chart as at Jan 10, 2017 (Source: Chartnexus)
Subscribe to:
Posts (Atom)