Showing posts with label retailers. Show all posts

Sunday, December 20, 2020

HAIO: Earnings Remained Strong

Result Update

For QE31/10/2020, Haio's net profit was relatively unchanged q-o-q but rose 41% y-o-y to RM10.4 million while revenue dropped 7.2% q-o-q or 3.3% y-o-y to RM66 million. Overall revenue dropped q-o-q mainly attributable to lower revenue generated from the MLM division as members recruitment and renewals have normalized and business activities and delivery service in East Malaysia were impacted by the third wave of COVID-19 pandemic outbreak. Wholesale revenue was maintained while retail revenue rose 4.2%. Profits was maintained partly due to one-off gain from the disposal of vintage tea amounting to RM 0.8 million.


Table: Haio's last 8 quarterly results 


Graph: Haio's last 62 quarterly results

Financial Position 

Haio's financial position as at 31/10/2020 is deemed healthy with current ratio at 4.1 times and total liabilities to total equity at 0.19 time.

Valuation

Haio (closed at RM2.32 last Friday) is trading at a trailing PE of 17.8 times (based on last 4 quarters' EPS of 13 sen). Haio paid out dividend totaling 8 sen in the past 4 quarters- giving the stock a decent dividend yield of 3.4%. Based on these, Haio is deemed fairly valued.

Technical Outlook

Haio seems to have on a recovery path, after its share prices exhibit higher "peaks" and "higher troughs" since Mar this year. Weakly MACD is now above the zero line, which indicates the share prices are likely to go into an uptrend.


Chart 1: Haio's weekly chart as at Dec 18, 2020 (Source: Malaysiastock.biz)


Chart 2: Haio's monthly chart as at Dec 18, 2020 (Source: Malaysiastock.biz)

Conclusion

Based on steadier financial performance, healthy financial position and mildly positive technical outlook, Haio is a good stock for long-term investment.

Note:

I hereby confirm that I do not have any direct interest in the security or securities mentioned in this post. However, I could have an indirect interest in the security or securities mentioned as some of my clients may have an interest in the acquisition or disposal of the aforementioned security or securities. As investor, you should fully research any security before making an investment decision.

Tuesday, December 04, 2018

Padini: Earnings Plunged

Result Update

In QE30/9/2018, Padini's net profit dropped 69% q-o-q or 42% y-o-y to RM18 million while revenue was mixed- down 31% q-o-q but rose 5% y-o-y to RM330 million. Revenues and profit before taxation for this quarter decreased by approximately RM148 million (31.0%) and RM54 million (66.9%) respectively compared to the immediate preceding period. This was mainly due to Hari Raya festival sales which fall in June 2018 and the nationwide 4 days special sales promotion held in the last quarter.


Table 1: Padini's 8 quarterly results


The Hari Raya festival sales and the nationwide 4 days special sales promotion must have been so successful as it came after the ending of GST in Malaysia in June. The following quarter, QE30/9/2018 has traditionally been a slower quarter, and it did not benefit from the tax-free period after the end of GST and before the start of SST in September. It could be a reflection of the slowdown in consumer spending.

Below I have compared the decline in revenue and profits for QE30/9/2018 with those of QE30/9/2018. While revenue dropped q-o-q buy rose y-o-y for both periods under review, profits dropped more severely for QE30/9/2018 compared to QE30/8/2017. The reason for the bigger drop in profits are attributable to:
a) a drop in gross profit margin from 43% to 40%, which was mainly due to the reversal of inventories written off and inventories written down in the previous financial year, and
b) an increase in staff cost, rental and some other store operating expenses.


Table 2: Padini's QE30/9/2018 compared to QE30/9/2017 


Graph: Padini's P&L  for last 25 quarterly results

Financial Position

Padini's financial position is deemed satisfactory as at Sept 30, 2018 with current ratio at 3.7x and gearing ratio at 0.3x. Net cash balance was RM314 million or RM0.48 per share.

Valuation

Padini (closed at RM4.30 in the morning session) is now trading at a trailing PER of 17x (based on last 4 quarters' EPS of 25 sen). Excluding the net cash of RM0.48 per share, Padini's PER would improve slightly to 15x. At either one of these PERs, Padini is fairly attractive.

Technical Outlook

Padini broke its horizontal line at RM5.30 as well as the psychological RM5.00 mark on November 30. Its immediate support is at the horizontal line at RM4.10-4.15. If this support is broken, Padini may test its uptrend line at RM3.70.


Chart: Padini's weekly chart as at Dec 4, 2018_11.30 (Source: Malaysiastock.biz)

Conclusion

Despite the sharp drop in profits, Padini is still a good stock to buy for long-term investment based on its steady & well-established track record of financial performance and healthy financial position.

Note:

I hereby confirm that I do not have any direct interest in the security or securities mentioned in this post. However, I could have an indirect interest in the security or securities mentioned as some of my clients may have an interest in the acquisition or disposal of the aforementioned security or securities. As investor, you should fully research any security before making an investment decision.

Thursday, September 27, 2018

Haio: Earnings Continued to Drop

Result Update

For QE31/7/2018, Haio's net profit dropped 32% q-o-q or 38% y-o-y to RM11 million while revenue dropped 28% q-o-q or 36% y-o-y to RM80 million. Overall revenue dropped q-o-q mainly attributable to lower revenue generated from the MLM division of 26.6% which was only partially offset by the increase in revenue for Wholesale and Retail divisions of 20.0% and 44.5% respectively.

Revenue for the MLM division was lower mainly attributable to the distributors had slowdown business activities during Ramadan fasting month and Hari Raya festive season coupled with lower member recruitment rate post GE14 which has resulted the dropped in revenue for the 1 st quarter ended 31 July 2018. The revenue for the Wholesale division dropped  due to lower sales in Chinese medicated tonic and tea amid to the weaker consumer sentiment. The revenue for the Retail division dropped after the sales promotion period of 4Q2018 plus subdued consumer sentiment remains despite the 3-months tax free holiday effective 1 June 2018.

In line with lower overall revenue, the company's net profit dropped 32.4% q-o-q.


Table: Haio's last 8 quarterly results 


Graph: Haio's last 54 quarterly results

Financial Position 

Haio's financial position as at 31/7/2018 is deemed healthy with current ratio at 4.0 times and total liabilities to total equity at 0.2 times.

Valuation

Haio (closed at RM4.04 yesterday) is trading at a trailing PE of 17.3 times (based on last 4 quarters' EPS of 23.42 sen). Haio paid out dividend totaling 17 sen in the past 4 quarters- giving the stock a decent dividend yield of 4.0%. Based on these, Haio is deemed fairly valued.

Technical Outlook

Haio peaked at RM5.60 in late 2017. A strong rally in May this year sent the share price to a high of RM5.39. Since then, Haio has been sliding and even broke the horizontal line at RM4.50. The next support will be the psychological level at RM4.00 and the horizontal line at RM3.80.


Chart: Haio's weekly chart as at Sep 26, 2018  (Source: Malaysiastock.biz)

Conclusion

Despite weaker financial performance and negative technical outlook, Haio is a good stock for long-term investment based healthy financial position and fair valuation. I revise my rating from Underperform (or, SELL) to a HOLD.

Note:

I hereby confirm that I do not have any direct interest in the security or securities mentioned in this post. However, I could have an indirect interest in the security or securities mentioned as some of my clients may have an interest in the acquisition or disposal of the aforementioned security or securities. As investor, you should fully research any security before making an investment decision.

Tuesday, August 28, 2018

Padini: Earning Soared

Result Update

for QE30/6/2018, Padini's net profit rose 44% q-o-q or 45% y-o-y to RM57 million while revenue rose 12% q-o-q or 4% y-o-y to RM478 million. Revenue increased mainly due to increased number of outlets, which increased by 5 Padini Concept stores and 7 Brands Outlet stores opened during the twelve-month period under review.  Profit before tax also increased as a result of the impact from the increase in revenue and improvement in GP margin, counter balance by the increase in selling & distribution expenses.


Table: Padini's 8 quarterly results

We can see clearly that Padini's net profit was way above the net profit achieved in QE31/12/2016. The acceleration in net profit could herald a new phase of earning growth for Padini.


Graph: Padini's P&L  for last 18 quarterly results

Financial Position

Padini's financial position is deemed satisfactory as at June 30, 2018 with current ratio at 2.9x and gearing ratio at 0.4x. Net cash balance was RM414 million or RM0.63 per share.

Valuation

Padini (closed at RM6.04 yesterday) is now trading at a trailing PER of 22x (based on last 4 quarters' EPS of 27.11 sen). Excluding the net cash of RM0.63, Padini's PER would improve slightly to 20x. At either one of these PERs, Padini is fairly attractive.

Technical Outlook

Padini is in a long-term upward channel. It is now pressing against the upper line, which is likely to cap its upside in near term.


Chart 1: Padini's monthly chart as at Aug 27, 2018 (Source: Shareinvestor.com)

The weekly chart shows potential weakness ahead but the share prices will be well-supported by the intermediate uptrend line, SS at RM5.00-5.20.


Chart 2: Padini's weekly chart as at Aug 27, 2018 (Source: Shareinvestor.com)

Conclusion

Based on good financial performance and satisfactory financial position, and positive technical outlook, Padini is a good stock to buy for long-term investment.

Note:

I hereby confirm that I do not have any direct interest in the security or securities mentioned in this post. However, I could have an indirect interest in the security or securities mentioned as some of my clients may have an interest in the acquisition or disposal of the aforementioned security or securities. As investor, you should fully research any security before making an investment decision.

Monday, March 26, 2018

Haio: Cloudy Outlook Ahead

Result Update

For QE31/1/2018, Haio's net profit dropped 10% q-o-q but rose 25% y-o-y to RM19 million while revenue dropped 17% q-o-q or 4% y-o-y to RM103 million. Overall revenue dropped q-o-q mainly due to lower revenue generated from the MLM and Retail divisions which dropped 20.9% & 10.5% respectively. This has more than offset the increase in revenue for Wholesale of 4.0%.

Revenue for the MLM division was lower because of higher revenue in the immediate preceding quarter due to higher sales generated as a result of incentive trip promotion campaign and 25th year anniversary grand sales promotion. The revenue for the Retail division dropped because of higher revenue in the immediate preceding quarter was mainly derived from its half yearly members’ sales promotion campaign.

These led to lower PBT for MLM and Retail divisions of 27.1% & 80% respectively which more than offset the increase in PBT for Wholesale of 42.9%.


Table: Haio's last 8 quarterly results 


Graph: Haio's last 52 quarterly results

Financial Position 

Haio's financial position as at 31/1/2018 is deemed healthy with current ratio at 3.1 times and total liabilities to total equity at 0.3 times.

Valuation

Haio (closed at RM4.70 last Friday) is trading at a trailing PE of 17.7 times (based on last 4 quarters' EPS of 26.51 sen). Based on earning CAGR of 31% over the past 2 years, Haio's PEG ratio is about 0.6x. Thus, Haio is considered attractive as a growth stock.

Technical Outlook

Haio has risen sharply from RM1.50 in 2016 to recent high of RM5.60. However it has dropped below the horizontal line of RM5.10 as well as its 30-week EMA line at RM5.00. This could signal te end of the uptrend for the stock.


Chart 1: Haio's weekly chart as at Mar 23, 2018  (Source: Shareinvestor.com)


Chart 2: Haio's monthly chart as at Mar 23, 2018  (Source: Shareinvestor.com)

Conclusion

Based on good financial performance & fairly attractive valuation, Haio is a good stock for long-term investment. However I would rate Haio as Under-perform as its technical outlook has turned mildly bearish.

Note:

I hereby confirm that I do not have any direct interest in the security or securities mentioned in this post. However, I could have an indirect interest in the security or securities mentioned as some of my clients may have an interest in the acquisition or disposal of the aforementioned security or securities. As investor, you should fully research any security before making an investment decision.

Friday, March 02, 2018

AEON: Tentative Signs of Recovery Appear

Background

AEON Co. (M) Bhd ("AEON") was incorporated on September 15, 1984, and listed on Bursa Malaysia in 1997. It is the leading chain of General Merchandising Stores and supermarkets in Malaysia, where most of its outlets are situated in suburban residential areas and catering for the middle income group. AEON Group is also involved in specialty store operations, shopping canter development and operations, credit card business and services.

Past Financial Performance 

AEON's profits peaked in FY2013 and then went into a decline for 3 years in FY2014-2016. Despite a lethargic top-line, AEON's bottom-line reversed in FY2017 due to higher margin and better operation expenses control.


Graph 1: AEON's last 9 yearly results

Recent Financial Performance 

For QE31/12/2017, AEON's net profit rose 321% q-o-q or 26% y-o-y to RM39 million while revenue rose 11% q-o-q or 5% y-o-y to RM1.07 billion. The profit before tax increased by 28.5% q-o-q due to higher margin and better operation expenses control.


Table: AEON's last 8 quarterly results


Graph 2: AEON's last 44 quarterly results

Latest Financial Position

As at 31/12/2017, AEON's financial position is deemed weak with current ratio at only 0.34x and total liabilities to total equity at 1.25x. The extremely low current ratio is due to the use of short-term borrowings and suppliers' credit to finance its property, plant & equipment which amounted to RM3.50 billion as at 31/12/2017. This low level of liquidity can be addressed by capital-raising or by monetizing the shopping centers owned by the group.

Valuation

AEON (closed at RM1.61 yesterday) is now trading at a PE of 23 times (based on last 4 quarters' EPS of 6.86 sen). At this PER, AEON is fully valued. If profit recovery materializes, then PER would drop and the stock will be more attractive.

Technical Outlook

AEON has broken below its long-term uptrend line, SS at RM1.60. If it can recover back above this support, the slow recovery may begin.


Chart 1: AEON's monthly chart as at Mar 1, 2018 (Source: ShareInvestor.com)


Chart 2: AEON's weekly chart as at Mar 1, 2018 (Source: ShareInvestor.com)

Conclusion

Based on improved financial performance, AEON could be a good stock for a recovery play.

Note:
I hereby confirm that I do not have any direct interest in the security or securities mentioned in this post. However, I could have an indirect interest in the security or securities mentioned as some of my clients may have an interest in the acquisition or disposal of the aforementioned security or securities. As investor, you should fully research any security before making an investment decision.

Sunday, November 12, 2017

Petdag: Earnings Soared

Result Update

For QE30/9/2017, Petdag's net profit increased 210% q-o-q or 206% y-o-y to RM762 million while revenue rose 3% q-o-q or 22% y-o-y to RM6.694 billion. Revenue rose q-o-q mainly due to higher sales volume by 7%, offset by a decrease in average selling price by 3%.

Group operating profit rose by RM131.8 million mainly due to:

  • improved margin of RM151.4 million from Mogas in line with the increasing MOPS price trend during the quarter; and
  • higher other income of RM4.1 million mainly from Mesra income.
This was partially offset by higher operating expenditure by RM24.5 million attributable to increase in salaries, wages and benefits.

Group net profit jumped due to an extraordinary gain of RM424.6 million from the disposal of 100% equity interest in a subsidiary, PETRONAS Energy Philippines, Inc and 40% equity interest in an associated company, Duta Inc to P-H-O-E-N-I-X Petroleum Philippines, Inc., an external party of the Group for a fair value consideration of RM560.5 million.


Table: Petdag's last 8 quarterly results

 
Graph: Petdag's last 38 quarterly results

Valuation

Petdag (closed at RM21.60 last Friday) is now trading at a trailing PE of 19.6 times (based on last 4 quarters' estimated recurring EPS of 110 sen). Its dividend yield is decent at 3.6%. Overall, Petadg is deemed fairly attractive.

Technical Outlook

Over the past 2 weeks, Petdag has tumbled down to its intermediate uptrend line, S1-S1 support of RM21.50. If this support failed, Petdag may slide further to the psychological RM20.00 mark or even the long-term uptrend line, SS support at RM19.00.


Chart 1: Petdag's monthly chart as at Nov 10. 2017(Source: Malaysiastock.biz)


Chart 2: Petdag's daily chart as at Nov 10. 2017(Source: Malaysiastock.biz)

Conclusion

Based the improved financial performance and positive long-term technical outlook , I revised my rating for Petdag from HOLD to a BUY.

Note:
I hereby confirm that I do not have any direct interest in the security or securities mentioned in this post.
 However, I could have an indirect interest in the security or securities mentioned as some of my clients may have an interest in the acquisition or disposal of the aforementioned security or securities. As investor, you should fully research any security before making an investment decision.

Tuesday, July 18, 2017

Padini: Possible Bullish Breakout

Padini may have a bullish breakout at RM3.65. Its immediate target could be RM4.00. For those who are keen to trade this breakout, I would suggest that you stagger your entry by buying in 2-4 tranches between RM3.70-3.80. A pullback to RM3.70 is possible but a drop below the breakout level of RM3.65 should be a warning that the play is over. (Note: Padini is at RM3.75 as ta 4.40pm.)


Chart: Padini's daily chart as at July 18, 2017_4.30pm (Source: Shareinvestor.com)

Sunday, June 04, 2017

AMWAY: Earning Still Weak

Results Update

For QE31/3/2017, Amway's net profit dropped 18% q-o-q or 48% y-o-y to RM9.5 million while revenue dropped 6% q-o-q or 22% y-o-y to RM237 million. Revenue decreased by 5.5% q-o-q due to further consolidation following the conclusion of ABOs’ Performance Year 2016, which was driven by strong ABO momentum towards the 40th anniversary programs. Profit before tax decreased by 8.8% q-o-q mainly due to lower sales and higher import costs. These were partly offset by lower provisions for sales incentives and ABO incentive trips, as well as reduced operating expenses. (Amway's latest result was announced May 17.)


Table: Amway's last 8 quarterly results


Graph: Amway's last 39 quarterly results

A significant portion of Amway's products and/or inputs are sensitive to the movement of USD-MYR. Since the movement has been unfavorable for the past 2 years, this has affected Amway's revenue & profits. From the chart below, we can see that USD-MYR is at a crossroad. Any further weakness in USD could cause the uptrend of USD-MYR to reverse and that will bring about a favorable change in the pricing of its products, leading to improved sales & profitability. 


Chart 1: USD-MYR's weekly chart as at June 2, 2017 (Source: Investing.com) 

Valuation

Amway (closed at RM7.60 last Friday) is trading at a trailing PER of 27 times (based on last 4 quarters' EPS of 28 sen). While PER appears elevated, this may change with better performance if USD-MYR reverses. Meanwhile, investors may take comfort in receiving a decent dividend yield of 3.9%.

Technical Outlook


Amwayhas tested its long-term uptrend line at RM7.50. Further price run-up could trigger the MACD to hook-up. This may be the positive signal that shareholders are waiting for.


Chart 2: Amway's monthly chart as at June 2, 2016 (Source: ShareInvestor.com)

Good entry to this stock is at RM7.30-7.50. An upside breakout of the horizontal resistance at RM8.20 could signal the next upleg for the stock.


Chart 3: Amway's daily chart as at June 2, 2016 (Source: ShareInvestor.com)

Conclusion

Despite the weaker financial performance and demanding valuation, Amway could be a good stock to consider for recovery play. For reason stated above, I revised my rating from REDUCE to ACCUMULATE.

Note:
I hereby confirm that I do not have any direct interest in the security or securities mentioned in this post. However, I could have an indirect interest in the security or securities mentioned as some of my clients may have an interest in the acquisition or disposal of the aforementioned security or securities. As investor, you should fully research any security before making an investment decision.

Thursday, March 30, 2017

Haio: Earning Playing Catch-up!

Result Update

For QE31/1/2017, Haio's PBT rose 7% q-o-q or 65% y-o-y to RM21.7 million while revenue rose 7% q-o-q or 33% y-o-y to RM107 million. Overall revenue increased q-o-q due to higher revenue for the MLM, Wholesale & Retail divisions. Revenue for the MLM division rose 2.5% due to increased demand for personal care and household consumer products. Revenue for the Wholesale & Retail divisions rose 22% & 34% respectively, due to higher sales generated from the CNY sales promotion campaign.

PBT for the MLM & Retail divisions rose 6% & >100% respectively. The sharper increase in Retail division PBT was attributed to higher sales of house brand products with higher margin. PBT for Wholesale division dropped by 8% due to higher operating costs and A&P expenses incurred.

Despite higher PBT, NP dropped 3.4% q-o-q due to higher tax charge as deferred tax was recognized in profit or loss in the current quarter while capital and reinvestment allowance were utilized to reduce tax charge in previous quarter.


Table: Haio's last 8 quarterly results (Note: EPS, DPS & NTA ps have been adjusted for the latest 1-for-2 bonus issue.)


Graph: Haio's last 48 quarterly results

Valuation

Haio (closed at RM3.30 yesterday) is trading at a trailing PE of 18.4 times (based on last 4 quarters' EPS of 17.97 sen). Based on earning CAGR of 30% over the past 2 years, Haio's PEG ratio is about 0.6x. Thus, Haio is considered attractive as a growth stock.

Technical Outlook

Haio is a long-term uptrend. The share price has rallied substantially over the past 15 months. The last time this stock had such a strong rally was in 2010. That rally didn't end too well. Be careful!


Chart 1: Haio's monthly chart as at Mar 29, 2017 (Source: MalaysiaStock.biz)

If you compare the share price movement to the earnings from 2005 until the latest quarter, you will agree that share price may be running well ahead of fundamentals.

 
Chart 2: Haio's mthly chart as at Mar 29, 2017 with quarterly earning (Source: MalaysiaStock.biz)

Conclusion

Based on good financial performance & positive technical outlook, Haio is a good stock for long-term investment. However I would rate Haio as a SELL INTO STRENGTH as the share price is running ahead of the fundamentals as noted above.

Note:

I hereby confirm that I do not have any direct interest in the security or securities mentioned in this post. However, I could have an indirect interest in the security or securities mentioned as some of my clients may have an interest in the acquisition or disposal of the aforementioned security or securities. As investor, you should fully research any security before making an investment decision.

Thursday, February 23, 2017

Oldtown: Cashing In On the Cafe Society Crowd

Results Update

In QE31/12/2016, Oldtown's net profit rose 93% q-o-q or 120% y-o-y to RM24 million while revenue rose 16% q-o-q or 13% y-o-y to RM116 million. PBT rose q-o-q due to 33%-increase in PBT from café chain operation and 98%-increase in PBT for the Beverage Manufacturing operation mainly due to higher export sales.


Table 1: Oldtown's last 10 quarterly P&L


Table 2: Oldtown's Segmental Result for QE31/12/2016 & FYE31/12/2016

As a result of the big jump in the revenue & profits from the Beverages Manufacturing segment, Oldtown's Top-line & Bottom-line were lifted up significantly. I believe this is an earning event that should lead to re-rating of the stock.


Graph: Oldtown's last 13 quarterly P&L

Valuation

Oldtown (closed at RM2.03 yesterday) is now trading at a PER of 13 times (based on last 4 quarters' EPS of 15.33 sen). If the share price is adjusted for the net cash of RM0.33 per share, the PER would be lowered to 11 times. Assuming its final dividend for FY2017 is same as FY2016 (without the special dividend), Oldtown's dividend yield would be about 4.4%. Based on this DY & the adjusted PER, Oldtown is deemed very attractive for a consumer stock.

Technical Outlook

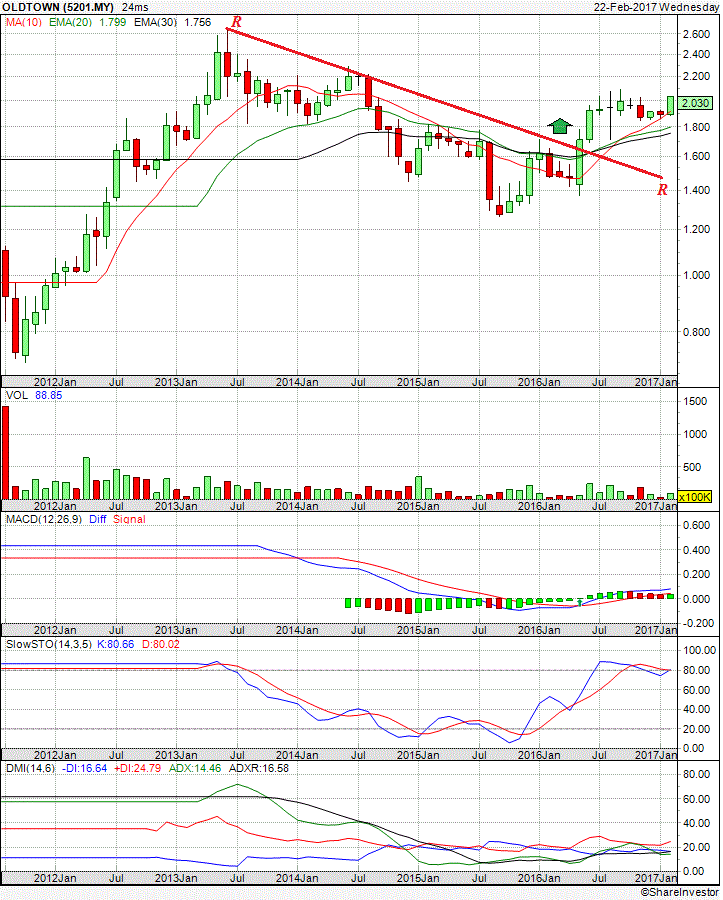
Oldtown has just broken above its triangle (ABC) at RM1.97. This upside breakout of a continuation pattern means that the stock is likely to continue with its prior uptrend.


Chart 1: Oldtown's weekly chart as at June 20, 2016 (Source: Kenanga/Chartnexus)

The monthly chart shows that Oldtown has broken above its intermediate downtrend line, RR at RM1.65 in May last year. Its next resistance will come form the horizontal line at RM2.20.


Chart 2: Oldtown's monthly chart as at Feb 22, 2017 (Source: ShareInvestor.com)

Conclusion
 
Based on satisfactory financial performance, attractive valuation & bullish technical outlook, Oldtown could be a good stock for long-term investment.

Note:

I hereby confirm that I do not have any direct interest in the security or securities mentioned in this post. However, I could have an indirect interest in the security or securities mentioned as some of my clients may have an interest in the acquisition or disposal of the aforementioned security or securities. As investor, you should fully research any security before making an investment decision.

Wednesday, February 22, 2017

Parkson: Net Profit From One-off Gain


Result Update

For QE31/12/2016, Parkson reported a net profit of RM72 million on the back of a revenue of RM1.046 billion. Revenue rose marginally y-o-y but gained 19% q-o-q mainly due to higher consumer spending during the year-end festivities and the holiday seasons.

Parkson returned to profitability due to gain of RM802.3 million on disposal of Beijing Huadesheng Property Management Co Ltd, a subsidiary in China less impairment losses on intangible assets and other receivables of RM313.2 million. Despite the return to profitability, Parkson is not out of the wood yet as its operating loss increased actually to RM30 million from RM11 millionincurred in the same quarter last year.


Table: Parkson's last 8 quarterly results

 
Graph: Parkson's last 40 quarterly results 

Valuation
Parkson (closed at RM0.70 yesterday) is now trading at a PBR of 0.29 times (based on last 4 quarters' NTA of RM2.38 per share). Parkson has a negative PER as it recorded a net loss of RM111 million in the past 4 quarters.

Technical Outlook

Since my last posting, Parkson went below its the 2003 low of RM0.90 to make a low of RM0.62-0.63 in the past 2 months. Judging by the gaps between the 3 moving average lines and the share price, Parkson could be poised to a sharp rebound. All it needs is a convincing turnaround story which alas did not come from the latest quarterly result (though the headline number may look seductive!).


Chart 1: Parkson's monthly chart as at Feb 21, 2017 (Source: ShareInvestor.com)

If we looked at the daily chart, we can see that Parkson has just tested its intermediate downtrend line at RM0.73. If it can break above this downtrend line, we may see a short rally to RM0.85-0.90. I doubt it can surmount the psychological RM1.00 mark.


Chart 2: Parkson's daily chart as at Feb 21, 2017 (Source: ShareInvestor.com)

Conclusion

Based on poor financial performance & bearish technical outlook, Parkson is a good stock for long-term contrarian investment. At the present depressed price, the stock has probably priced for the worst scenario- a winding up. If that happens, you would certainly not lose money as its PBR is at 0.29X. If you have this stock in your portfolio, you should just hold onto it.

Note:

I hereby confirm that I do not have any direct interest in the security or securities mentioned in this post. However, I could have an indirect interest in the security or securities mentioned as some of my clients may have an interest in the acquisition or disposal of the aforementioned security or securities. As investor, you should fully research any security before making an investment decision.

Tuesday, February 21, 2017

Padini: Earnings Soared


Result Update

for QE31/12/2016, Padini's bet profit rose 90% q-o-q or 65% y-o-y to RM54 million while revenue rose 38% q-o-q or 25% y-o-y to RM427 million. Revenues rose sharply q-o-q due to the Christmas season and the year-end school holidays. Operating expenses did not increase proportionately to the increase in revenue, resulting in the q-o-q improvement in profit before taxation by 83% (RM33.1million).


Table: Padini's 8 quarterly results

We can see clearly that Padini's net profit was way above the net profit achieved in QE31/12/2015. The acceleration in net profit could herald a new phase of earning growth for Padini.


Graph 2: Padini's P&L  for last 18 quarterly results

Financial Position

Padini's financial position is deemed satisfactory as at Dec 31, 2016 with current ratio at 2.1x and gearing ratio at 0.7x.

Valuation

Padini (closed at RM2.58yesterday) is now trading at a trailing PER of 11x (based on last 4 quarters' EPS of 23.65 sen). At this PER, Padini is very attractive.

Technical Outlook

Padini has broken above its intermediate downtrend line, RR at RM2.40 last week. MACD has hooked up and it could well re-enter the positive territory again. This would signal the co nitnuation of its prior uptrend.


Chart 1: Padini's weekly chart as at Feb 20, 2017 (Source: Shareinvestor.com)

From the monthly chart, we can see that Padini is still in a long-term uptrend line with support at RM2.20.


Chart 2: Padini's monthly chart as at Feb 20, 2017 (Source: Shareinvestor.com)

Conclusion

Based on good financial performance and satisfactory financial position, attractive valuation and positive technical outlook, Padini is a good stock to buy for long-term investment.

Note:

I hereby confirm that I do not have any direct interest in the security or securities mentioned in this post. However, I could have an indirect interest in the security or securities mentioned as some of my clients may have an interest in the acquisition or disposal of the aforementioned security or securities. As investor, you should fully research any security before making an investment decision.