Monday, January 27, 2020

ICON & ICON-OR: Designated Securities

Bursa has finally declared ICON & ICON-OR as designated securities (here). This means that you need to have sufficient cash balance in your trading account before you can buy any one of the securities, or conversely, you need to have sufficient free balance of the securities in your CDS account before you can sell any one of the securities.

Bursa took this drastic action in order to reduce excessive speculation, and to ensure a fair and orderly market. I can only say that this belated action should have been taken after the market close on Jan 22. In fact, a more pro-active course of action would have been to suspend the counter on Jan 22 for 30 minutes to caution market players about the effect of a 50-to-1 share consolidation on their shareholding.

By failing to take timely action, Bursa has allowed market players to carry on trading in a highly risky manner for another 2 more trading days. To add to this risky situation, Bursa allowed ICON-OR to be traded on Jan 24 at a ridiculously high reference price of RM0.69!! This gave market players the wrong impression that the value of the stock could be as high as RM0.795, which is arrived at by adding the reference price of ICON-OR to the subscription price of ICON Rights share of RM0.105.

Who are the losers in this unnecessarily debacle? 

They can be divided into 2 groups. The first group are the unfortunate shareholders of the company, which have seen their investment declined in value by almost 100% from its opening price of about RM6.50 in 2014 to its recent low of around 3.5 sen. They are victims of the 2-day delay in the implementation of the 50-to-1 share consolidation. As a result of the delay, they oversold their shares in their CDS account on either Jan 22 or Jan 23.

Unless you are well-informed about your stock's upcoming corporate exercises, you might not know that the correct share balance should be only 2% of the balance stated in your CDS account until Jan 24.

On Jan 22, these hapless shareholders would jump at the opportunity to sell ICON at 20-40 sen as compared to only 3.5 sen the day before. Alas, they would live to regret their quick action. Their losses can be computed the difference between the last done price on Jan 23, plus 5 sen (being additional 10 bid on top of the last done price on Jan 23) and their selling price on Jan 22.

Those who oversold on Jan 23 will be subject to market buy-in on Tuesday (Jan 28), which is the difference between the last done price on Jan 24, plus 5 sen (being additional 10 bid on top of the last done price on Jan 24) and their selling price on Jan 23.

The second group of losers are your typical market players who would be drawn to any speculative play in order to make trading profit. Just because they are speculators, that doesn't mean that they are any less a victim who deserves our support. They could have been misled by the potential fair value for ICON based on the high reference price set for ICON-OR.

What will likely happen to ICON & ICON-OR next week?

If you had read my first posting on Jan 22 (here), you may recall that the theoretical ex-right price of ICON is about 12 sen. Since you need to pay 10.5 sen to subscribe to subscribe for the Rights share, then ICON-OR should be about 1.5 sen. When you compare these values against the closing prices of ICON and ICON-OR of RM0.815 & RM0.39 respectively last Friday, you can see the potential losses if you have bought into these securities.

What lesson can BURSA take away from this sad debacle?

It is high time to cut off the 2-day delay in the implementation of non-cash share exercises, such as share consolidation, bonus issue, etc. There may be good reasons for a short delay in the past in implementing a cashless share exercise but those reasons must now be weighed against the risk that some market players may take advantage of the situation- resulting in untold damages to innocent investors. The alternative would be to suspend a stock during the 2-day period between the ex-date and the entitlement date to allow for the implementation of the non-cash share exercises. Now is the right time for Bursa to act decisively in the interest of orderly market and the protection of innocent investors and players alike.

Friday, January 24, 2020

Happy Chinese New Year

I like to wish all my Chinese readers a very happy new year.


ICON: Watch Out Below!

After my post 2 days ago, ICON rallied to a high of RM0.715 yesterday. Those who made the mistake of overselling after the 50-to-1 share consolidation, were hit with a hefty loss this morning when they had to buyback at RM0.72 to meet the delivery.

If these unfortunate players bought back their oversold position on the same day, their losses would be the difference between the buyback price (possibly, the limit-up price of RM0.415 on 22 Jan) and the price of their initial sale.

However, if they failed to do that on the same day, they would have to face the market buy-in this morning. If they had attempted to limit their losses by hedging themselves yesterday, they are playing a high risk game because the rally on this stock may suddenly stop and the share price may go in the reverse gear.

Bear in mind; prior to the ex-date for the entire exercise, there were 1.177 billion outstanding ICON shares. After the stock went ex for the exercise, the number of outstanding shares has initially dropped to a mere 23.5 million shares.

After the completion and listing of Rights issue shares on 20 Feb, the outstanding shares will jump back to 2.374 billion. Since this additional 2.35 billion shares cost only RM0.10 each, the ongoing play is unsustainable. Amazingly, ICON is now trading at RM0.91 at the time of writing this post.

If you have this stock, you would do what is best for you- sell it off as soon as possible. The trick is how? How to sell a stock when it is going higher and higher?!

[Update]

ICON Rights are traded today. They were traded at RM0.39, which is the limit-down price for the Rights! How did the exchange determine the reference price to be RM0.69? ICON is getting stranger and stranger everyday. 

Wednesday, January 22, 2020

ICON: Ex for a 50-to-1 Share Consolidation [WARNING!]

ICON has gone ex the 50-to-1 share consolidation today. This means that if a shareholder has 50,000 ICON shares yesterday, he/she would be owning 1,000 ICON shares now. Most shareholders may miss that, and when they see the share price shooting higher this morning, they would rush to sell the shares based on the quantity they thought they have. This will lead to overselling and subsequently a costly buyback.

To safeguard our clients, Kenanga  has posted a notice on its trading platform, Kentrade to alert the online traders. Remisiers are also informed to alert their non online clients about the share consolidation.


BEWARE! Don't oversell ICON shares you own!!

The share consolidation is one part of multiple proposal (here). In particular, you will note that there will be a Rights Issue of 100 shares at RM0.105 each for every 1 share owned after the share consolidation. If you choose to apply for this, you will receive 1 free warrant for every 4 Rights shares applied for. 

What would be the fair price of ICON today? 

Assuming yesterday closing price of RM0.035 is the fair price then (a bit of a stretch for most penny stocks), then the theoretical ex-right price is computed as follows:

Theoretical ex-rights price
= [(Initial cost cum rights) + (Additional cost to exercise the rights)] divided by (Total shares owned)

This is an incomplete formula as the free warrants are not included in the computation. The reasons for this are because:
1) I am unable to find the exercise price for the warrant. This is a real hassle which I hope Bursa will one day address. All pertinent information should be made easily accessible rather than hidden in another announcement or attachment. 
2) If the warrant exercise price is higher than market price, the warrant is deemed to be out-of-the-money and it can be excluded. In the circular sent to the shareholders in November last year (here), it was stated that the "warrants exercise price is proposed to be priced at not more than a premium of 25% to the TERP per Icon Share and have a tenure of 8 years"; while "the issue price for each Rights Share for the purpose of this Circular is RM0.060 (for illustration purpose), representing a discount of approximately 14% to the TERP based on the Maximum Intended Gross Proceeds"With these 2 points, it is highly likely that ICON market price under normal trading condition (unlike today) will be lower higher than the exercise price of the new warrant.
Based on the formula below, we can exclude the out-of-the-money warrant in computing theoretical ex-right price.

The theoretical ex-rights price
= [(0.035# x 50*) + (0.105## x 100**)] / (1*** + 100**)                                           
= [1.75 + 10.50] / 101                         
= 0.1213

Legends:
#     Last cum price
##   Rights share subscription price
*     Original shares owned before consolidation
**   Rights shares entitlement
*** Original shares owned after consolidation


Chart: ICON's intra-day chart as at Jan 22, 2020_12.30pm (Source: Kenanga BTX)

Why is ICON share price trading at RM0.38-0.39 now? Besides being played up, there is possibility that a short squeeze is on. Those who oversold this morning is now being forced (or, squeezed) to buyback at much higher prices. Over times, the share price of ICON should reflect the theoretical ex-right price as computed above, which is about RM0.12. 

Monday, January 20, 2020

CPO Prices to Consolidate

CPO sharp rally tested the line connecting its previous peaks at RM3118. The last 2-3 days of correction brought CPO prices below its medium-term uptrend line at RM3010-3015. It is likely that the price correction may continue in the medium-term.


Chart 1: CPO's monthly chart as at Jan 17, 2020 (Source: Investing.com)


Chart 2: CPO's daily chart as at Jan 17, 2020 (Source: Investing.com)

The sharp rally in CPO prices caused an upside breakout for Plant index at 6900 in early November. The ensuing rally brought Plant index to a high of 7900 in the final week of December last year. The last 3 weeks of correction has finally brought the Plant index below its medium-term uptrend line at 7550 last week. Unless CPO price recovers significantly next few days, Plant index is likely to go lower.


Chart 3; Plant's weekly chart as at Jan 17, 2020 (Source: Shareinvestor.com)


Chart 4; Plant''s daiy chart as at Jan 17, 2020 (Source: Shareinvestor.com)

Based on the above, I expect plantation share prices to continue to correct in the near term.

Thursday, January 16, 2020

INARI: A Bullish Sign!

One thing you may notice in the past 1-2 years is that share prices generally go lower when the stock is implementing a Right Issue. The reason is simple; no one wants to cough out money to subscribe for new shares.

On the same logic, an expiring warrant, especially company-issued warrants which must be converted to shares instead of cash-settled, would suffer the same fate. It can get so bad that these warrants would trade at a significant discount.

The last 1 month we have been seeing INARI-WB trading at a discount of less than 1%. This warrant has the following terms:
1. Exercise price: RM0.5333
2. Expiry date: Feb 17, 2020

For example, at the time of writing this post, INARI was trading at RM1.72 and INARI-WB was trading at RM1.17. If you were to buy the warrant and pay the exercise price of RM0.533 to own the share, you would save 1.67 sen or about 0.97%. No matter how difficult it is to make money in the stock market, a saving of less than 1% won't get many retail players excited. 

So, who is buying INARI-WB, and patiently & laboriously converting them to shares? The smart money, of course. In the stock market, if you choose to be on the side of the smart money, you will win more often than not. 

That's why INARI the share is worth watching. If it were to drift down to the line connecting its recent trough (or, low), it is worth owning some. Good luck!

Chart 1: INARI's daily chart as at Jan 16, 2020_3.30pm (Source: Malaysiastock.biz)


Chart 2: INARI-WB's daily chart as at Jan 16, 2020_3.30pm (Source: Malaysiastock.biz)

TAKAFUL: A Sudden Selldown!

Takaful opened at RM5.50 and dropped to a low of RM5.20 in just 13 minutes. A check on Bursa website and on the internet failed to reveal any new development that might explain the sudden selldown.

In my opinion, this selldown may be due to the upcoming corporate exercise proposed by BIMB, which includes inter alia a distribution of Takaful shares and Bank Islam shares held by BIMB to its shareholders. Unlike the shareholders of BIMB who may be looking forward to receiving Bank Islam and Takaful shares, the shareholders of Takaful can only look forward to having more small shareholders joining their rank. These small shareholders may simply sell off their free Takaful shares received, which may depress the share price going forward. 

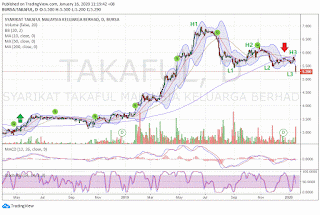
Having said that, it should be noted that Takaful's fundamentals are pretty good. See my recent post on its financial performance (here). However its technical outlook has turned negative with 50-day SMA line crossing under the 200-day SMA line (generally referred to as the death cross) and the current low going lower than the previous 2 lows, which together with the lower highs, would fulfill the requirement of a downtrend.

Chart 1: Takaful's daily chart as at Jan 16, 2020-11.20am (Source: Malaysiastock.biz) 

A similar technical set-up was observed in AEONCR in September last year when the lows and the highs were getting lower and the death cross took place. Despite the negative set-up in AEONCR had a big rally in October, which would have been an excellent selling opportunity. After that, the downtrend continued. What caused the change of investors' outlook for AEONCR? It's probably due to poorer financial performance which was highlighted in my recent post on its financial performance (here).

Chart 2; AEONCR's daily chart as at Jan 16, 2020-11.20am (Source: Malaysiastock.biz)

Based on the bearish technical outlook for Takaful, you may want to avoid buying into this good stock in the near term. 

Thursday, January 09, 2020

Market Observations after the 1st Round of Blows Between the U.S. & Iran

Following the Iranian retaliation - after the assassination of Iranian Major General Qasem Soleimani by U.S. forces - stock markets tumbled worldwide. Bursa suffered the same fate, with our FBMKLCI dropping 21.9 points to 1589.1. Losers outnumbered gainers by 883 to 171.

I have appended below is the table of gainers with volume. Ignoring the usual suspects, such as O&G stocks, gold trading stocks and Hang Seng put warrants, we have 2 gainers that warrant our attention, namely PMETAL and GHLSYS.


Table: Bursa's top gainers with volume on January 8, 2020

1) PMETAL

This stock is testing the line connecting its recent peaks at RM4.90-5.00. The likely reason for this hurried aggressive buying could be traders or investors positioning themselves to benefit for a bullish breakout in the price of aluminum.


Chart 1: PMETAL's weekly chart as at Jan 8, 2020 (Source: Malaysiastock.biz)


Chart 2: PMETAL and Aluminum's weekly chart as at Jan 8, 2020 (Sources: Malaysiastock.biz & Investing.com)

2) GHLSYS

2 days ago, GHLSYS, in partnership with Mastercard, has launched a tokenized e-payments solution that offers simpler, more secured and seamless digital payment experiences for consumers (here). This could be the next earning boost for the company, which has seen a steady rise in earnings since FY2012.


Chart 3: GHLSYS's weekly chart as at Jan 8, 2020 (Source: Malaysiastock.biz)


Graph: GHLSYS's rolling 4-Q revenue & profits for last 49 quarters

Based on the aggressive buying behavior observed yesterday, which was a pretty negative trading day, I say these 2 stocks could continue to see bullish buying support in the days ahead.