Monday, February 29, 2016

Chinwel: Earnings maintained

Results Update

In Qe31/12/2015, Chinwel's net profit rose 3% q-o-q or 124% y-o-y to RM19 million while revenue dropped 13% q-o-q or 2% y-o-y to RM123 million. Revenue dropped due to a drop in revenue in the fastener division of RM19 million which was partially offset by a rise in revenue in wire products division of RM1 million. PBT was unchanged as the drop in PBT in the fastener division of RM2 million was fully offset by RM1 million gain each recorded by the wire products division & the investment holdings division.


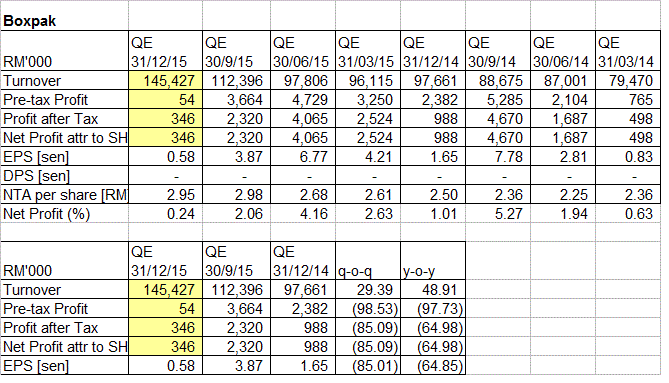
Table: Chinwel's last 11 quarters' P&L


Chart 1: Chinwel's last 11 quarters' P&L

Valuation

Chinwel (closed at RM1.81 last Friday) is now trading at a PE of 9X (based on last 4 quarters' EPS of 20.13 sen). Based on this PER, Chinwel is deemed fairly valued.

Technical Outlook

Chinwel broke above its strong horizontal resistance at RM1.73 in early November 2015. As noted earlier, the stock has broken above its 15-year triangle formation at the same time. Let's wait & see whether this bullish breakout may lead to a sustained rally.


Chart 2: Chinwel's weekly chart as at Feb 26, 2016 (Source: ShareInvestor)


Chart 3: Chinwel's monthly chart as at Feb 26, 2016 (Source: ShareInvestor) 

Conclusion

Based on good financial performance, reasonable valuation & bullish technical breakout, Chinwel could still be a good stock for long-term investment.

Note:
In addition to the disclaimer in the preamble to my blog, I hereby confirm that I do not have any relevant interest in, or any interest in the acquisition or disposal of, Chinwel.

Allianz: Earnings continued to rise

Result Update

For QE31/12/2015, Allianz's net profit increased by 10% q-o-q or 21% y-o-y to RM86 million while revenue increased by 3% q-o-q but declined 4% y-o-y to RM1.17 billion.

Revenue increased q-o-q due mainly to increase in gross earned premiums by RM28.3 million and higher investment income by RM6.8 million. PBT increased q-o-q  mainly to higher contribution from both insurance operations. PBT for general insurance operation rose by 16.1% or RM12.0 million to RM86.7 million due to one-off recognition of dis-allowance of GST input tax credit for certain motor claims since the implementation of GST on 1 April 2015. PBT for life insurance operation rose by 80.3% or RM17.9 million to RM40.2 million due to higher contribution from investment-linked business.


Table: Allianz's last 8 quarterly results

Allianz's net profit  for QE31/12/2015 has surpassed the previous high recorded in QE31/3/2014.


Chart 1: Allianz's last 40 quarterly results

Valuation

Allianz (closed RM9.93 last Friday) is now trading at a PE of 11 times (based on last 4 quarters' EPS of 90 sen). At this PE, Allianz is deemed fairly attractive.

Technical Outlook

Allianz is still in a long-term uptrend line with support at RM9.00. Its uptrend accelerated from mid-2012 to early 2014, culminated with a Triple Top reversal. This brought the stock down to just below the RM10.00 psychological level. Provided the share price stays above the RM9.00 mark, Allianz's long-term uptrend is intact.


Chart 2: Allianz's monthly chart as at Feb 26, 2016 (Source: ShareInvestor)

Conclusion

Based on satisfactory financial performance and fairly attractive valuation, Allianz remains a good stock for long-term investment.

Note: 
In addition to the disclaimer in the preamble to my blog, I hereby confirm that I do not have any relevant interest in, or any interest in the acquisition or disposal of, Allianz.

Kimlun: Earnings improved

Results Update

For QE31/12/2015, Kimlun’s net profit rose 9% q-o-q or 134% y-o-y to RM21 million while revenue was down 4% q-o-q or 17% y-o-y to RM232 million.

Revenue dropped q-o-q due to lower revenue being achieved by the construction division, partly offset by the increase in revenue achieved by the manufacturing and trading divisions. The decline in construction revenue was mainly due to some of the older projects were completed in the preceding quarter, while new projects secured had  yet  to  reach  the  stage  of  active  execution  during  the  current  quarter.

PBT inched up marginally due to a higher gross profit recorded in the current quarter, on the back of improved gross profit margin of the construction and manufacturing divisions. Higher other income was achieved in the current quarter mainly due to higher interest income earned, and income from the provision of products shop drawing and lab test services to our customers. Share of profit of a joint venture was higher in the current quarter as compared to the preceding quarter due to relatively higher construction progress during the current quarter. All these more than offset increased selling and administrative expenses which was mainly due to higher human resource costs and lower foreign exchange gains in the current quarter.  


Table: Kimlun's last 12 quarters' P&L accounts


Chart 1: Kimlun's last 12 quarters' revenue, profits & profit margins

Valuation

Kimlun (closed at RM1.52 last Friday) is now trading at a PER of 9.5 times (based on last 4 quarters’ EPS of 16 sen). At this PER, Kimlun is deemed fairly traded.

Technical Outlook

Kimlun has broken above its intermediate downtrend line, R2-R2 at RM1.35 in December last year. It rallied to the horizontal line at RM1.65 and then corrected back to the horizontal line at RM1.50.


Chart 2: Kimlun's monthly chart as at Feb 26, 2016 (Source: ShareInvestor.com)

Conclusion

Based on good financial performance, fair valuation & positive technical outlook, Kimlun could be a good stock for medium-term investment.

Note:
In addition to the disclaimer in the preamble to my blog, I hereby confirm that I do not have any relevant interest in, or any interest in the acquisition or disposal of, Kimlun.

Friday, February 26, 2016

TGuan: Earnings soared

Results Update

For QE31/12/2015, TGuan's net profit increased by 38% q-o-q to RM15.5 million while turnover increased by 7% q-o-q to RM196 million. The q-o-q increase in revenue was mainly due to higher export volume. The q-o-q increase in profit before tax was mainly due to the higher profit contribution from its plastic bags and PVC food wrap products.


Table: TGuan's last 8 quarterly results


Chart 1: TGuan's last 41 quarterly results

Valuation

TGuan (closed at RM2.98 yesterday) is now trading at a PE of 8.1 times (based on last 4 quarters' EPS of 36.6 sen). At this PER, TGuan is deemed very attractive.

Technical Outlook

TGuan is in a long-term uptrend, supported by its 40-week EMA line.


Chart 2: TGuan's monthly chart as at Feb 25, 2016 (Source: ShareInvestor.com)

TGuan had a sharp price run-up in the  past 6 months. Its immediate resistance is at RM3.40-3.50 while the immediate support is at RM2.80.


Chart 3: TGuan's weekly chart as at Feb 25, 2016 (Source: ShareInvestor.com)
 
Conclusion

Based on improved financial performance, attractive valuation & bullish technical outlook, TGuan could be a good stock for a long-term investment.

Note:
In addition to the disclaimer in the preamble to my blog, I hereby confirm that I do not have any relevant interest in, or any interest in the acquisition or disposal of, TGuan.

Mudajya: Is this recovery?

Result Update

QE31/12/2015 is the 2nd profit quarter for Mudajya after it reported a huge net loss of RM100 million in QE31/12/2014. In the latest quarter [QE31/12/2015], Mudajya's net profit increased by 13% q-o-q to RM16 million while revenue rose 52% to RM164 million. Its PBT grew 13% q-o-q due to improved PBT achieved by all the 4 segments: construction, property, power & others. Except for the power segment, the other segments saw sequentially higher revenue. The sharpest rise in revenue came from the construction segment due to the completion of major projects such as MRT & Pengerang Cogen.


Table: Mudajya's last 8 quarterly results


Chart 1:Mudajya's last 29 quarterly results

Valuation

Mudajya (closed at RM1.15 yesterday) is now trading at a PBR of 0.6 times (based on NTA of RM2.05 as at 31/12/2015). Mudajya has a negative EPS which makes its PER not meaningful.

Technical Outlook

Mudajya has broken above its intermediate downtrend line at RM1.10 in October last year. Despite the breakout, the share price slipped back to test the psychological RM1.00 mark before rallying to a high of RM1.50 in early January. A medium-term uptrend line has formed and its support is at RM1.15.


Chart 2: Mudajya's weekly chart as at Feb 25, 2016 (Source: ShareInvestor)


Chart 3: Mudajya's monthly chart as at Feb 25, 2016 (Source: ShareInvestor)

Conclusion

Based on improved financial performance & improving technical outlook, Mudajya could be a stock for a long-term investment.

Note:
In addition to the disclaimer in the preamble to my blog, I hereby confirm that I do not have any relevant interest in, or any interest in the acquisition or disposal of, Mudajya.

Thursday, February 25, 2016

Innity: The Next Jobstreet??

Background

Innity Corporation Bhd (Innity) is involved in the provision of online advertising solutions. According to Warren Raisch - quoting from GO-gulf.com - global online advertising is expected to grow to 18% of 2016's total advertising spending from 13% in 2011. At the same time, the online advertising in US is expected to grow from 25% to 37% of total advertising spending. For more go here.


Diagram 1: Global & US's Online Ad Spending

Experienced & Committed Shareholders

The shareholders of Innity include D.A. Consortium Inc, which is the online advertising specialist within the Hakuhodo DY Group of Japan. Hakuhodo is one of the world's leading advertising & marketing groups. In addition, it also counts Jobstreet Corp Bhd as one of its major shareholders. As you may know, Jobstreet is one of the great success stories of Malaysia IT industry.

I have tabulated the shareholding structure of Innity below. Besides the reduction/change in percentage shareholding in 2013 to accommodate the entry of D.A. Consortium Inc as a shareholder, we can see that over the past 1 year, some shareholders have raised their shareholding. This led to further concentration of shares held by these 8 shareholders, from 80% in 2011 to 84% today.


Diagram 2: Innity's Shareholding Structure  

Results Update

I have appended below the latest results for Innity for QE31/12/2015. The most 2 important things to note are:
1) Revenue are on rise
2) Net profit at RM1.48 million has surpassed the high achieved in QE31/12/2013.


Table: Innity's last 8 quarterly results


Chart 1: Innity's last 31 quarterly results

Financial Position

As at 31/12/2015, Inniti's financial position is deemed healthy. Current ratio stood at 2.0 times while gearing ratio is negligible at 0.9 time.

Valuation

Innity (closed at RM0.44 as at 4:00pm today) is now trading at a PE of 20 times (based on last 4 quarters' EPS of 2.12 sen). While this PER is still very high, Innity could well on the cusp of sharp rise in its revenue and earnings. If so, the PER could easily drop back to much more manageable level.

Technical outlook

Innity is trapped within a long-term uptrend line (support at RM0.30) and an intermediate downtrend line (resistance at RM0.43). A convincing breakout above the RM0.50 could signal the start of the upleg for this stock.


Chart 2: Innity's monthly chart as at Feb 25, 2015_3.00pm (Source: ShareInvestor)

Conclusion

Based on the favorable advertising trend, satisfactory financial performance and strong financial position, Innnity is a stock worth investing for long-term. Those seeking a quick trade should look somewhere else because Innity is not a liquid nor an active stock which makes exit very challenging.

Note:
In addition to the disclaimer in the preamble to my blog, I hereby confirm that I do not have any relevant interest in, or any interest in the acquisition or disposal of, Innity.

Hevea: Fantastic result!

Results Update

For QE31/12/2015, Hevea's net profit increased by 42% q-o-q or 188% y-o-y to RM26 million while revenue grew by 22% q-o-q or 31% y-o-y to RM151 million.

Revenue increased y-o-y contributed by  both  the  particleboard sector (due to higher  sales  of  higher grade products, increased sales in value added products and higher USD exchange rate to Ringgit during this reporting period) and RTA sector (due to process automation which resulted in higher productivity, efficiency and also the capability to produce higher value and wider range of products).

PBT increased y-o-y due mainly to better performance in the particleboard sector resulting from increased sale of higher value and value-added  products coupled with the strengthening of USD, and also achieving an unrealized exchange gain of RM 950,000 instead of  a  loss  of  RM3.3  million  for  the same quarter in FY2014.


Table: Hevea's last 8 quarterly results


Chart 1: Hevea's last 33 quarterly results

Corporate News

In January, Hevea share price tumbled sharply when there was a spate of allegations amde against the company. This includes non-payment of dividend by its substantial shareholder, quality problem of its products in South Korea & funny accounting of amount owing by related parties. All of these were addressed by the management (here). Except for the last item, I do not see these problems as serious red flags. Ingenious accounting treatment is always a no-no for investors and the last item may serve as a nagging issue for sometimes, notwithstanding the fact that the amount owing had been fully settled.
 
Valuation

Hevea (closed at RM1.40 yesterday) is now trading at a PE of 7.6 times (based on last 4 quarters' EPS of 18.4 sen. At this PER, Hevea is still deemed very attractive. It may command a PER of 10-12 times- giving the stock an upside of at least 30%.

Technical Outlook

Hevea has been on a strong uptrend since it broke above its long-term downtrend line, RR at RM0.23 in November 2013.


Chart 2: Hevea's monthly chart as at Feb 24, 2016  (Source: ShareInvestor)

The stock's immediate support is its 50-week EMA line at RM1.10. This was tested in January when the spate of allegations mentioned above surfaced. Despite the negative news, the stock held up very well and we can rely on this test as a guide in future trading of the stock.


 Chart 2: Hevea's weekly chart as at Feb 24, 2016  (Source: ShareInvestor)

Conclusion

Based on good financial performance, relatively attractive valuation & positive technical outlook, Hevea remains a good stock for long-term investment.

Note:
In addition to the disclaimer in the preamble to my blog, I hereby confirm that I do not have any relevant interest in, or any interest in the acquisition or disposal of, Hevea.

CBIP: Earnings soared

Results Update

For QE31/12/2015, CBIP's net profit rose 162% q-o-q or 61% y-o-y to RM39 million while revenue was mixed; rose 59% q-o-q but dropped 4% y-o-y to 197 million. Revenue increased q-o-q due to higher project billing by special purpose vehicles and palm oil mill equipment segments. PBT rose q-o-q due mainly attributable to improvement in project implementation and management by the special purpose vehicles and palm oil mill equipment segments, and a favorable foreign exchange during the current quarter & 21%-increase in shares of results of associates.


Table 1: CBIP's last 8 quarterly results


Despite the sharp swing, one can see that CBIP's revenue and profit are rising in line with the steady growth in the palm oil estates. This is supportive of the management's expectation of satisfactory results for FY2016.


Chart 1: CBIP's last 36 quarterly results 

Valuation

CBIP (closed at RM2.15 yesterday) is now trading at a PE of 12.1 times (based on annualized EPS of 17.7 sen). At this multiple, CBIP is deemed fairly valued.

Technical Outlook

CBIP has recently broken above its downtrend line at RM2.05  as well as the horizontal line at RM2.10. Its immediate resistance is at the horizontal line at RM2.23 & beyond that, the horizontal line at RM2.40.


Chart 2: CBIP's weekly chart as at Feb 24, 2016 (Source: ShareInvestor)

Below we can see that CBIP is in a long-term "uptrend line" with support at RM1.80.


Chart 3: CBIP's monthly chart as at Feb 24, 2016 (Source: ShareInvestor)

Conclusion

Based on good financial performance,reasonable valuation & bullish technical outlook, CBIP is a good stock for long-term investment.

Note: 
In addition to the disclaimer in the preamble to my blog, I hereby confirm that I do not have any relevant interest in, or any interest in the acquisition or disposal of, CBIP.

Tuesday, February 23, 2016

CSCSTEL: Earnings rebounded

Results Update

CSCStel's net profit increased by 179% q-o-q to RM28.5 million. Revenue increased by 9% q-o-q to RM243 million due to significant increase in sales volume of some of its steel products and marginal increase in selling prices of some of its steel products. In line with the higher revenue and the write-back of the doubtful debt provision of RM16.9 million, profits soared. If the write-back is excluded, the profits would still have been significantly higher: 67%  for PBT and 20% for net profit.


Table: CSCStel's last 8 quarterly results


Chart 1: CSCStel's P&L for last 33 quarterly results

Valuation

CSCStel (closed at RM1.28 yesterday) has a PE multiple of 8.8 times (based the last 4 quarters' EPS of 14.5 sen). This plus its DY of 6.2% make CSCTEL a fairly attractive stock.

Technical Outlook

CSCStel broke above its intermediate downtrend line at RM1.10 in early January. Its immediate resistance is the horizontal line at RM1.30. Beyond that, it may encounter resistance at RM1.50-1.60.


Chart: CSCStel's monthly chart as at Feb 22, 2016 (Source: ShareInvestor.cm)

Conclusion

Based on the improved financial performance, fairly attractive valuation & positive technical outlook, CSCStel could be a good stock for long-term investment. 

Note: 
 
In addition to the disclaimer in the preamble to my blog, I hereby confirm that I do not have any relevant interest in, or any interest in the acquisition or disposal of, CSCSTEL.

Boxpak: Earnings dropped due to goodwill write-off & forex losses

Result Update

For QE31/12/2015, Boxpak's net profit dropped by 85% q-o-q or 65% y-o-y to RM346k while revenue rose by 30% q-o-q or 49% y-o-y to RM145 million.

Revenue rose q-o-q due to pre-festive season sales in Malaysia and Vietnam. Revenue continued its steady rise y-o-y due to increase in customers' demand in Vietnam and the relative strengthening of Vietnam Dong ("VND") against Ringgit Malaysia ("RM").

PBT dropped due to higher operating cost, the write-off of goodwill of RM2.4 million and foreign currency exchange loss of RM5.9 million. If the latter 2 one-off items are excluded, PBT would rise to RM7.3 million- an increase of 99% q-o-q or 2-fold increase y-o-y.


Table: Boxpak's last 8 quarterly results


Chart 1: Boxpak's last 33 quarterly results

Valuation

Boxpak (closed at RM2.50 yesterday) is now trading at a PE of 38 times (based on last 4 quarters' EPS of 15.43 sen). If the 2 one-off items are excluded, Boxpak's EPS would rise to 28 sen and its PER would drop to 9 times. Based on its adjusted PER, Boxpak is deemed quite attractive.

Technical Outlook

Boxpakbroke above the strong horizontal resistance at RM2.50 in October 2015. It made a high of RM3.10 in early November. Since then, the share price has retraced back to RM2.60-2.70.


Chart 2: Boxpak's monthly chart as at Feb 22, 2016 (Source: ShareInvestor.com)

Conclusion

Based on "good" financial performance and "fairly" attractive valuation, Boxpak is a good stock for long-term investment.

Note: 
In addition to the disclaimer in the preamble to my blog, I hereby confirm that I do not have any relevant interest in, or any interest in the acquisition or disposal of, Boxpak

Friday, February 19, 2016

Hupseng: Eat Your Biscuits!

Background

Hup Seng Industries Bhd ('Hupseng') is involved in the manufacture and sales of biscuits, confectioneries & other foodstuffs.

Recent Financial Performance

For QE31/12/2015, Hupseng's net profit rose by 33% q-o-q or 22% y-o-y to RM15.4 million while revenue increased by 24% q-o-q or 9% y-o-y to RM80 million. The improved performance was attributed to higher biscuits sales in domestic and export market.

 
Table: Hupseng's last 8 quarters result

Historical Financial Performance

Hupseng's top-line and bottom-line as well as its profit margins have been in a slow & steady rise for the past 8-9 years.


Chart 1: Hupseng's last 8 quarters' P&L  

Financial Position

Hupseng's financial position as at 31/12/2015 is deemed healthy with current ratio at 2.5 times while total liabilities to total equity stood at 0.5 time. The company has no borrowing. Instead it has cash of RM120 million or RM0.15 per share.

Valuation

Hupseng (closed at RM1.32 yesterday) is now trading at a PER of 19 times (based on last 4 quarters' EPS of 6.84 sen). If the cash in hand is deducted from the share price, the PER would be lowered to 17 times. At this PER, Hupseng is deemed fairly valued.

Last year, Hupseng paid out dividend totaling 4.5 sen in 3 tranches. So far, it hd paid out dividend totaling 4 sen in 2 tranches this year. If it pays out a final dividend of 2 sen (equal to each one of the last 2 tranches), then Hupseng's DY would be a decent 4.5%.

Technical Outlook

Hupseng is in an intermediate uptrend line, with support at RM1.25. That uptrend line stretches back all the way to 2008 when it was trading at a low of RM0.05!! Since it has come a long way, the market is waiting for a compelling fundamental reason to buy into the stock. In the absence of a compelling reason to sell, the share price would likely to keep drifting higher.


Chart 2: Hupseng's weekly chart as at Feb 18, 2016 (Source: ShareInvestor.com)

 
Chart 3: Hupseng's monthly chart as at Feb 18, 2016 (Source: ShareInvestor.com)

Conclusion

Based on good financial performance, healthy financial position & positive technical outlook, Hupseng is a good stock for long-term investment. Good entry to the stock is when the share price drifts down to the uptrend line, currently at RM1.25.

Note: 
In addition to the disclaimer in the preamble to my blog, I hereby confirm that I do not have any relevant interest in, or any interest in the acquisition or disposal of, Hupseng.

Thursday, February 18, 2016

Genting: Positve technical signs

Market Observation

Over the past 3 weeks, we have seen a marked increase in the trading volume for Genting-WA which coincided with the warrant trading above its horizontal resistance at RM1.00. Genting-WA - convertible at RM7.96 on a 1-for-1 basis & expiring on 18/12/2018 - has a slight premium of about 11%.


Chart 1: Genting-WA's weekly chart as at Feb 18, 2016_3.00pm  (Source: ShareInvestor)

Technical Outlook

Genting recovered after it had tested its long-term uptrend line at RM6.50-6.70 in August last year. Is this the beginning of its next upleg or a technical rebounce?


Chart 2:Genting's monthly chart as at Feb 18, 2016_3.00pm  (Source: ShareInvestor)

Looking at the weekly chart, we can see that Genting has broken to the upside of its ascending triangle at RM8.00. The weekly MACD, which had crossed above its signal line, is poised to go above the zero line. When that happens, Genting's upleg will begin in earnest.


Chart 3:Genting's weekly chart as at Feb 18, 2016_3.00pm  (Source: ShareInvestor)

Result Update

Genting's top-line has been fairly stagnant at about RM4-5 billion a quarter for the past 4 years. At the same time, its bottom-line has been drifting lower due to slipping profit margins.


Table: Genting's last 8 quarterly results


Chart 1: Genting's last 38 quarterly results

Valuation

Genting (at RM8.17 as at 4.35pm) is trading at a PE of 19  times (based on its last 4 quarters' EPS of 42 sen). At this PER, Genting is deemed fully valued.

Conclusion

Despite the unimpressive financial performance & demanding valuation, Genting could be a good stock to trading purpose due to the developing positive technical outlook. 

Note:
In addition to the disclaimer in the preamble to my blog, I hereby confirm that I do not have any relevant interest in, or any interest in the acquisition or disposal of, Genting.

BAT: Earnings plunged

Result Update

For QE31/12/2015, BAT's net profit dropped by 24% q-o-q or 6% y-o-y to RM196 million while revenue dropped by 9% q-o-q or 12% y-o-y to RM1.06 billion. The revenue dropped sequentially due to a 19.4%-drop in Domestic and Duty Free sales volume as a result of a 36%-jump in excise duties. This is compounded by a 8.5%-drop in Contract manufacturing volumes. The sharply lower revenue plus increased costs & timing differences in expenditures resulted in a decline in Gross Profit of 15%. Higher expenses incurred as a result of trade retail contracts & brand initiatives added to the woes, which led to a 21.5%-decline in operating profits.


Table: BAT's last 8 quarterly results


Chart 1: BAT's last 36 quarterly results

Putting 4Q2015 in perspective

In the past, BAT's 4th quarters had shown poorer result due to two reasons: Firstly, the effect of higher sales in the immediate preceding quarter as retailers or stockists bought ahead of the budget where excise duties increase would normally be announced. Secondly, it is the quarter when lumpy expenditures are booked in.

The latest 4th quarter is no exception. If we plot the chart of the past 11 4th quarterly results, we can see that the trend of profits is up. Nonetheless, the sharp drop in revenue is very glaringly. That is the result of the unexpectedly huge jump in excise duties (off-budget!!) as well as a significant drop in Manufacturing contract. The domestic sales is expected to recover in the next few quarters- leading to the continuation of the uptrend for profits.


Chart 2: BAT's last 11 4th Quarterly results

Valuation

BAT (closed at RM56.08 yesterday) is now trading at a PE of 17 times (based on the last 4 quarters' EPS of 318 sen). BAT paid out a dividend of RM3.12 for the last 4 quarters; thus giving a Dividend Yield of 5.6%. At these PER & DY, BAT is deemed fairly attractive.

Technical Outlook

BAT is in an uptrend line, with support at RM55.00.


Chart 3: BAT's daily chart as at Feb 17, 2016 (Source: ShareInvestor)

Conclusion

Despite the poorer financial performance, BAT is still a good stock for long-term investment. Its valuation is fairly attractive and its technical outlook is still positive. Thus, I revise my rating for BAT from a HOLD to ACCUMULATE.

Note: 
In addition to the disclaimer in the preamble to my blog, I hereby confirm that I do not have any relevant interest in, or any interest in the acquisition or disposal of, BAT.