Friday, February 29, 2008

Century has a good FY2007

Century Logistics Holdings Bhd ('Century')is in the business of providing total supply chain management solutions that encompass all logistics functions, from production and transport to delivery. The company ventured into oil and gas in 2001 and is looking to this business segment to elevate it to the next level of growth. In the field of oil and gas, Century offers ship to ship transfers, moving bunker fuel from floating storage units to its ultimate destination.

Century has just announced its results for 4Q2007 ended 31/12/2007. For QE31/12/2007, its net profit increased by 231% y-o-y from RM1.8 million to RM6.0 million on the back of a 36.4%-increase in turnover from RM32.7 million to RM44.6 million. When compared to the immediately preceding quarter, its net profit has declined by 12.1%. The drop was attributable to the company recognizing some deferred tax assets in QE30/9/2007, thus boosting the net profit. As you can see, the pre-tax profit for QE31/12/2007 had in effect increased by 26.7% q-o-q from RM6.1 million to RM7.8 million.

For FY2007, Century's net profit declined by3 folds from RM5.1 million to RM20.7 million, while its turnover has increased by 30.0% from RM125 million to RM161 million.


Century (closed at RM1.65 as at Feb 28) is now trading at a trailing PE of 4.0 times (using its last 4 quarters' EPS of 41 sen) or at a Price to Book of 0.8 times (using its NTA per share of RM2.09 as at 31/12/2007). At these multiples, Century is deemed cheap.

Century had risen from 60 sen in October 2006 to a high of RM2.80 in September 2007, The current correction could see the share price testing the horizontal supports of RM1.60 & RM1.30. The uptrend line support is at RM1.35-40.


Chart: Century's daily chart as at February 27, 2008 (courtesy of Quickcharts)

Yesterday, Century-WA ceased trading due to its expiry. In the last few days of trading, this warrant appears to be accumulated at prices around 55-60 sen. Normally, an expiring warrant is purchased by knowledgeable investors or insiders. These buyers will have to pay RM1.00 to convert the warrants to shares; thus their cost is about RM1.60. They have to be fairly confident to go through this exercise, given the present bearish market outlook. As such, Century could be a BUY for the medium-term at prices near to RM1.60.

Note: Century closed at RM1.81 at the end of the morning session.

Thursday, February 28, 2008

Evergreen's net profit dropped in QE31/12/2007

Evergreen has just announced its results 4Q2007 ended 31/12/2007. For QE31/12/2007, Evergreen's net profit increased by 52.4% y-o-y from RM17.3 million to RM26.4 million on the back of a 24.0%-increase in turnover from RM137 million to RM170 million. However, when compared with the immediate preceding quarter, the net profit has dropped by 25.8% on the back of 16.1%-decline in turnover. The lower net profit was attributable to the increase in log prices as well as hike in glue prices and freight charges. No reason was given for the decline in turnover. It is possible that the drop in turnover is attributable to a fire in its Johor plant in mid-September that had partially damaged some production facilities.

For FY2007, Evergreen's net profit increased by 98.2% from RM59.8 million to RM118.5 million, while its turnover has increased by 38.5% from RM528 million to RM732 million.


Evergreen (closed at RM1.32 as at Feb 27) is now trading at a trailing PE of 5.3 times (using the last 4 quarters' EPS of 24.7 sen) or a Price to Book of 1.2 times (using the NTA per share of RM1.12 as at 31/12/2007).

Evergreen broke its uptrend line support at RM1.35 level a few days ago. It is now hanging onto its immediate horizontal support at RM1.32. The next horizontal support is at RM1.15.


Chart 1: Evergreen's weekly chart as at February 27, 2008 (courtesy of Quickcharts)


Chart 2: Evergreen's daily chart as at February 27, 2008 (courtesy of Quickcharts)

Based on the poorer financial performance (albeit in one quarter only) & a likely breakdown of its uptrend line, the earlier BUY recommendation for Evergreen should be put on hold. Let's watch & see whether the share price can recover above the uptrend line. An improvement in its financial performance in 1Q2008 would be another thing to watch out for.

Latitud recovery could begin?

Latitud has just announced its results for 2Q2008 ended 31/12/2007. For that quarter, Latitud reported a net profit of RM4.1 million as compared to a loss of RM271k recorded in the immediately preceding quarter. The turnaround was due to recovery in the results of its Malaysian operations and lower losses recorded by its Thailand operations.


Latitud (closed at RM1.27 as at Feb 27) is now trading at a PE of 8 times (using the annualized EPS of 15.7 sen) or at a Price to Book of 0.5 times (using a NTA per share of RM2.48 as at 31/12/007). Thus, Latitud is deemed inexpensive at these multiples.

Chartwise, Latitud appears to be bottoming out at the present price level of RM1.20-30. There is no sign yet that the stock will be reversing upwards anytime soon.


Chart: Latitud's daily chart as at February 27, 2008 (courtesy of Quickcharts)

Based on improving performance, Latitud is good for slow accumulation. I had noted earlier that the stock is a laggard (go here). A better categorization is that the stock is a possible contrary play.

MSNiaga's net profit improved in QE31/12/2007

MSNiaga has just announced its results for 4Q2007 ended 31/12/2007. For QE31/12/2007, MSNiaga's net profit increased by 148% q-o-q or 75% y-o-y to RM8.6 million. Turnover increased by 38% q-o-q or 36% y-o-y to RM119 million. For FY2007, MSNiaga's net profit declined by 14% from RM14.7 million to RM12.7 million, while its turnover has increased by 12.5% from RM316 million to RM356 million. The lower net profit for FY2007 was attributable to lower margins & increased investment in human resources.


MSNiaga (closed at RM1.47 as at Feb 27) is now trading at a trailing PE of 7 times (using its FY2007 EPS of 21 sen) or at Price to Book of 0.5 times (using its NTA per share of RM2.95 as at 31/12/2007). At these multiples, MSNiaga is deemed inexpensive.

Chartwise, MSNiaga is still trending lower, with horizontal support seen at RM1.45. There is no sign yet that the stock is about to reverse upwards.


Chart: MSNiaga's daily chart as at February 27, 2008 (courtesy of Quickcharts)

Based on improving performance, MSNiaga is good for slow accumulation. This stock was recommended as a possible contrary play earlier (go here).

Wednesday, February 27, 2008

Tongher's net profit dropped sharply in QE31/7/2007

Tongher's net profit for QE31/12/2007 dropped by 59.1% q-o-q or 66.8% y-o-y to RM6.2 million. For the same quarter, its turnover dropped by 29.8% q-o-q or 5.8% y-o-y to RM97.7 million. The lower revenue and net profit are due to a lower demand and selling price for the product as well as higher cost of raw materials purchased in the preceding quarters.


Tongher (closed at RM2.79 as at Feb 26) is now trading at a PE of 5.5 times (based on its EPS of 51 sen for FY2007) or at a Price to Book of 1.3 times (based on its NTA per share of RM2.17 as at 31/12/2007). While the share price may appear inexpensive, investors may take a cautious view towards this stock for the next few quarters to see whether the slump in its performance would continue.

The share price has recently broken below its uptrend line support of RM3.10 on January 18 and hit the horizontal support of RM2.60 before rebounding. while the rebound is quite weak compared to the sharpness of the fall, the share price has managed to break above the short-term downtrend at RM2.90. I think the share is likely to trade between RM2.60 & RM3.00 for a while until investors have a clearer view of the performance of the company.


Chart: Tongher's weekly chart as at February 26, 2008 (courtesy of Quickcharts)

Based on the technical breakdown & the sharp deterioration in its performance, Tongher should be avoid until a clearer picture has emerged.

Note: Previously, I have erroneously commented that the company had completed a 1:3 bonus issue in October last year. The bonus issue completed was a 1:2 bonus issue.

HLInd's net profit jumped in QE31/12/2007

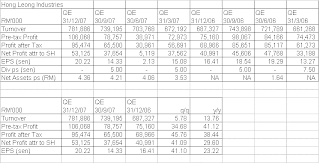
HLInd's main businesses are in semiconductor, motorcycles & building materials. It has just reported its results for 2Q2008 ended 31/12/2007, where its net profit increased by 41.1% q-o-q or 29.6% y-o-y to RM53.1 million, while its turnover increased by 5.8% q-o-q or 13.8% y-o-y to RM782 million.

Two of its main business segments, i.e. the semiconductor & motorcycles had improved their operating profit in 2Q2008. The semiconductor division- carried out by its subsidiary, MPI- had reported a 64.6% q-o-q increase in pre-tax profit from RM41.0 million to RM67.5 million on the back of a 9.9% increase in turnover from RM386 million to RM424 million. Due to a poorer performance in 1Q2008, the semiconductor division's 1H2008 reported a 7.9% y-o-y decline in operating profit from RM125.5 million to RM115.6 million. The motorcycles division maintained its steady performance in 2Q2008. For 1H2008, this division reported a 60.6% y-o-y increase in operating profit from RM52.7 million to RM84.7 million.


Based on its closing price of RM4.30 as at February 26, HLInd is trading at a forward PE of 7.2 times (based on an annualized EPS of 69 sen) or at a Price to Book of only 1 times (based on NTA per share of RM4.36 as at 31/12/2007). At these multiples, HLInd is considered inexpensive.

HLInd has dropped back from its recent high of RM6.10 recorded in November last year. Its immediate resistance is RM4.40, while support can be seen at RM4.10 & RM3.80. A tentative uptrend line can be drawn from its low of RM2.82 recorded in November 2005 & this uptrend line may provide support at RM3.76-80.


Chart: HLInd's weekly chart as at February 26, 2008 (courtesy of Quickcharts)

Based on improving performance, HLInd maybe a good BUY for the long-term. The catalyst for a re-rating of this stock could be a more sustained good performance from its semiconductor division and a pick-up in housing development sector, which may boost HLInd's underperforming building materials division.

Monday, February 25, 2008

Gamuda just broke its uptrend line at RM3.60

At 10.20 am, Gamuda broke its uptrend line that stretched back to June 2006. That uptrend line support was at RM3.60. Earlier at 9.35 am, it broke its strong horizontal support of RM3.74-76 level. The next strong horizontal support is at RM2.95-3.00.


Chart: Gamuda's weekly chart as at February 22, 2008 (courtesy of Quickcharts)

Many would be very tempted to buy this stock for a quick recovery. As a technical trading rule, one should avoid buying into a stock that had suffered the kind of breakdown that Gamuda has just sustained.

Gamuda was recommended as a BUY in July 2006 (go here). Since then, the share price has more than doubled. The present share price has been adjusted for a 1-for-1 bonus issue that was completed in October last year.

Kwantas' net profit soared in QE31/12/2007

I have posted a BUY call on Kwantas in May 2007 (go here). Like most plantation stocks, Kwantas' performance has improved steadily in line with the improved prices for palm oil. Nonetheless, the latest financial results for QE31/12/2007 is still very stunning & worth a post.

For QE31/12/2007, Kwantas' net profit jumped by 157% q-o-q or 347% y-o-y to RM54.4 million. Turnover jumped 82% q-o-q or 134% y-o-y to RM1.02 billion. The improvement in both topline & bottomline was attributable to increased CPO prices, better product margin & higher volume of palm & soya oil processed by its China operation.


Note: Kwantas carried out a 2:1 share split in December 2007.

Based on last Friday's closing price of RM4.14, Kwantas is now trading at a trailing PE of 10 times (using its last 4-quarter EPS of 41 sen) or at a Price to Book of 1.8 times (using its NTA per share of RM2.32 as at 31/12/2007). However, if the better performance of QE31/12/2007 can be sustained going forward, Kwantas' forward PE could be much lower- as low as 6 times.

Chartwise, Kwantas is in an uptrend line, with support at RM4.00-4.10.


Chart: Kwantas' daily chart as at February 22, 2008 (courtesy of Quickcharts)

Based on its exciting prospective earning, Kwantas could be a good BUY for the medium-term.

You may get more information on Kwantas' business operations from this article in Starbiz.

Thursday, February 21, 2008

Market Outlook as at February 21, 2008

It has been nearly one month since my last Market Outlook posting (go here). The long-awaited election announcement on February 13th had effectively put an end to the timid recovery. The selling that followed has brought the KLCI to a low of 1401.95 as at 12.00 noon, today. The market may test the psychological 1400 level very soon.


Chart 1: KLCI's daily chart as at February 20, 2008 (courtesy of Quickcharts)

In my last Market Outlook, I had mentioned that the technical picture might have turned bearish for many major markets & this rebound could be a correction (i.e. an oversold rally) within a bear market. I like to expand on this bearish outlook for the local market here.

One of the indicator that I rely on to determine the market's long-term outlook is the monthly MACD. I normally calibrate my MACD using weighted moving average, whereas others may use the exponential moving average. How reliable is this indicator?

From Chart 2a below, we can see that every time the MACD has hooked up, the KLCI would trend upward. That happened in 4 out of 4 occasions.


Chart 2a: KLCI's monthly chart as at February 20, 2008 (courtesy of Quickcharts)

From Chart 2b below, we can see that there are 5 occasions where the MACD had hooked down, including the present one. In the first 2 occasions (marked as A & B), the KLCI went into a sharp downtrend. In the other 2 occasions, the KLCI did not trend downward. In 2003, the KLCI moved sideway (marked as C). In 2005 & 2006, the KLCI also moved sideway but with a upward bias (marked as D). The latter 2 occasions may be explained by the overall bullish sentiment in global equity, which provided some buoyancy to our market.


Chart 2b: KLCI's monthly chart as at February 20, 2008 (courtesy of Quickcharts)

Would the KLCI trend downward or move sideway? That's the question. Since it is more likely to trend downward than move sideway, I believe that we should be very cautious & we should underweight our exposure to the equity market until a clearer picture emerges.

Unisem's net profit jumped in 4Q2007

Unisem has just reported its results for 4Q2007. Its net profit jumped 84% q-o-q or 268% y-o-y to RM57.2 million, while its turnover has increased by 18% q-o-q or 110% y-o-y to RM360 million. The sharp improvement in net profit was attributable to higher turnover, profit contribution from both Unisem Mauritius & Chengdu as well as higher unrealized forex gains.

Due to the substantial jump in turnover in 2H2007, Unisem's results for FY2007 is significantly better than FY2006. Net profit increased by 66% from RM71.5 million to RM118.6 million on the back of a 40%-increase in turnover from RM693 million to RM973 million. While expecting a seasonal softening in 1Q2008, Unisem's management expects its performance for FY2008 to be better than FY2007 on account of its acquisition of Unisem Mauritius & expanded operation in Unisem Chengdu.


Based on yesterday's closing price of RM1.51, Unisem is now trading at a trailing PE of 6 times (basing on FY2007 EPS of 25 sen) or Price to Book of 0.9 times (basing on NTA per share of RM1.73 as at 31/12/2007). As at, Unisem is trading at a relatively undemanding multiples.

Technical speaking, Unisem has been range-bound between RM1.40 & RM2.00 for most part of 2006 & 2007. It did break above the range for a short period in the 1st quarter of 2007 but this breakout was not followed through by any rally.

The long-term downtrend line will still act as a resistance at the RM1.90 level. A break above this resistance could signal the beginning of better price for Unisem going forward.


Chart 1: Unisem's monthly chart as at February 20, 2008 (courtesy of Quickcharts)


Chart 2: Unisem's weekly chart as at February 20, 2008 (courtesy of Quickcharts)

Based on good financial performance & undemanding valuation, Unisem is a good BUY for long-term investment.

Monday, February 18, 2008

Dry Bulk Freight Rates' recovery gained traction

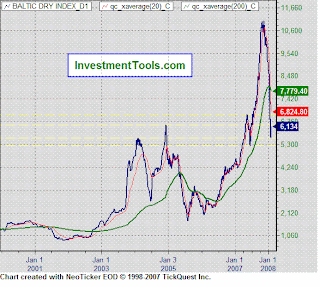
On February 4th, I have posted on the possible recovery of the Dry Bulk Freight Rates as reflected by the Baltic Drybulk Index, BDI (go here). In the past 2 weeks, the BDI has recovered further (see Chart 1 below).


Chart 1: Baltic Drybulk Rates' daily chart as at February 15, 2008 (courtesy of Investment.tools.com)

At the same time, the 2 shipping stocks that I have mentioned, i.e. Maybulk & Hubline has rebounded quite strongly (see the 2 charts below). In fact, Maybulk has broken to the upside of its short-term downtrend line at the RM4.00 level, while Hubline is still below its short-term downtrend line (with breakout at RM0.51-53 level).


Chart 2: Maybulk's daily chart as at February 15, 2008 (courtesy of Quickcharts)


Chart 3: Hubline's daily chart as at February 15, 2008 (courtesy of Quickcharts)

Based on the above, I would reiterate that shipping stocks could be a good BUY for the medium-term.

Sunday, February 17, 2008

Friday, February 15, 2008

PBBank had a good FY2007

On January 21, PBBank has announced its results for FY2007. The results for FY2007 was very impressive with continuous quarterly growth in revenue for 8 quarters and nearly continuous growth in net profit for the same periods (except for a drop in QE30/9/2006*).

For the 4Q2007, its net profit increased by 6.7% q-o-q or 30.3% y-o-y to RM580 million, while turnover increased by 6.6% q-o-q or 17.8% y-o-y to RM2573 million.

Based on yesterday's closing price of RM11.60, PBBank is now trading at a trailing PE of 18.4 times (using the past 4 quarters' EPS totaling 63 sen) & at a P/Book of 4.2 times (using its NTA per share of RM2.79 as at 31/12/2007). At these multiples, PBBank is relatively high priced.


Looking at the chart below, you can see that the price run-up has been quite sharp in the past 1-2 years. If the 1999 & 2004 run-up can be used as a guide, the present run-up could be nearing the tail end.


Chart: PBBank's monthly chart as at February 14, 2008 (courtesy of Quickcharts)

Despite its strong fundamental (not discussed here) & its very steady growth track record, I believe that the stock maybe fully priced. For those looking for steady yield & who has a long time horizon, PBBank may still be a good investment. If you are looking for capital gain, you should look at other stocks.

*The drop was mainly due to a gain on disposal of shares in a subsidiary of RM22.1 million in the preceding quarter (QE30/6/2006) coupled with an additional specific allowance of RM12.2 million made during the 3rd quarter (QE30/9/2006) resulting from the adoption of 20% specific allowance on all non-performing loans which are less than 6 months in arrears. Excluding these one-off effects, the pre-tax profit had grown by RM26.0 million or 4.4% due to a growth in net interest income and income from Islamic Banking operations by RM26.2 million and other operating income by RM8.0 million, partially offset by a higher operating expenses by RM7.2 million.

HLFG reported better 2Q2008

HLFG has just announced its results for 2Q2008, which ended 31/12/2007. Its net profit increased by 14.0% q-o-q or 24.6% y-o-y to RM144.3 million, while turnover increased by 11.4% q-o-q or 18.0% y-o-y to RM574 million.

Based on yesterday's closing price of RM5.00, HLFG is now trading at a trailing PE of 9.4 times (using the past 4 quarters' EPS totaling 53 sen) & at a P/Book of 1.33 times (using its NTA per share of RM3.76 as at 31/12/2007). At these multiples, HLFG is not expensive.

From the chart below, we can see that HLFG is trading very near its long-term uptrend line, with support at RM4.80, which is also a strong horizontal support as well.


Chart: HLFG's monthly chart as at February 14, 2008 (courtesy of Quickcharts)

Based on undemanding valuation & attractive technical picture, HLFG maybe a good medium-term BUY.

HLBank's net profit continued to climb

HLBank has also just announced its results for 2Q2008, which ended 31/12/2007. Its net profit increased by 13.6% q-o-q or 37.5% y-o-y to RM213.8 million, while turnover increased by 10.4% q-o-q or 20.0% y-o-y to RM524 million.

Based on yesterday's closing price of RM6.00, HLBank is now trading at a trailing PE of 12.0 times (using the past 4 quarters' EPS totaling 50 sen) & at a P/Book of 1.79 times (using its NTA per share of RM3.35 as at 31/12/2007). At these multiples, HLBank is not expensive.


From the chart below, we can see that HLBank has been moving upward since making a low of RM0.52 in September 1998. After an initial sharp rise, the uptrend has been decelerated over time & one may draw three fan lines onto the chart. Currently, the price action is supported by the third fan line at RM5.80. In between, we can see 2 triangles where price consolidation took place. The stock broke to the upside of the second triangle in January 2007 (which was highlighted in this post), but that breakout did not lead to a steady uptrend. Instead the share price appears to be trapped in a range between RM5.80 & RM6.70.


Chart: HLBank's monthly chart as at February 14, 2008 (courtesy of Quickcharts)

Based in undemanding valuation, HLBank could be a good medium-term BUY. Its technical picture is not clearcut. While it is still in a long-term uptrend, its current price action is poor. Until the stock has recruited enough buying support, it maybe trapped in the range of RM5.80-6.70 for a while.

Tuesday, February 12, 2008

Bull ELS- where is the beef?

CIMB has issued 2 instruments, i.e. IOI & Sime Bull Equity-linked Structures ('ELS') that will be listed shortly as IOI-SA & Sime-SA. The term 'Bull ELS' implies that a subscriber or purchaser of this instrument takes a bullish view of the underlying stock. On further reading of the Terms & Conditions of a Bull ELS, one will come away with a very different impression. This seems to be the view shared by the columnist who penned the article entitled "Equity-linked Structures to be listed on Bursa after festivities" in the Starbiz on February 9th.

Let's go thru the numbers, using the Sime-SA. An investor who buys a Sime-SA will fork out RM11.107 per ELS. At the end of the 1-month tenure, the investor will come to the settlement stage. The settlement will depend on the closing price of Sime one day before the Expiry Date. If the Settlement Price is equal or greater than the Exercise Price of RM11.21, the investor will receive a sum equivalent to the Exercise Price, less expenses. Presumably, the expenses will be insignificant, the investor will make a gain of RM0.103 for a holding period of 35 days. If the Settlement Price is less than the Exercise Price of RM11.21, the investor will receive Sime share as physical settlement.

From this, it is easy to make a case for someone who wants to issue a Bull ELS. If the underlying share stayed above the Exercise Price (which was set at 5% discount to the market price on the Issue Date), he would still get to keep his share. If the underlying share went below the Exercise Price, he might not be too sad to exchange his share for a sum equivalent to the Exercise Price (because he would be getting a better price for his share than the prevailing market price on the Expiry Date). All this for a small fee of RM0.103 for a period of 35 days (or, 9.1% per annum, calculated based on the Reference Price). It is very much like an insurance policy for the rainy days.

What about the subscriber or purchaser? You may want to invest in an ELS if you think there is likely to be sunshine or only slight drizzle over the next 1 month. For that cautiously bullish view, you would receive a return of RM0.103 for a period of 35 days (or, 9.7% per annum, calculated based on the Issue Price). In the event of a heavy downpour, you would end up owning the share at a price higher than the prevailing market price on the Expiry Date.


So, should you buy a Bull ELS? If you are really bullish about the market or the underlying stocks, just buy the stocks or the related CWs, instead of a Bull ELS. If you are bearish, you shouldn't touch any Bull ELS. If you are not sure, then don't do anything.

Wednesday, February 06, 2008

Gong Xi Fa Cai

I like to wish everyone a happy and prosperous Chinese New Year. Gong Xi Fa Cai.

Tuesday, February 05, 2008

Proton may have a bullish breakout

Proton has been drifting lower in a downtrend where the breakout level is at RM4.30. This afternoon, it has broken above this level on a volume of 23k lots as at 4.40 pm. While this volume is higher than the previous trading days, I would like to see a much higher volume (say, 50k or more) to confirm this short-term downtrend breakout. I see resistance at RM4.60 & if there is sufficient strength, an attempt to close the gap at RM4.92.


Chart: Proton's daily chart as at February 4, 2008 (courtesy of Quickcharts)

Orient- an attractive value stock

Background

Oriental Holdings Bhd ('Orient') is well-known for its automotive business. The other businesses of the group may attract more attention soon. Of these other businesses, plantation has now gained more prominent due to the sharp jump in profit contribution in the past few quarters. I have tabulated below the revenue & pre-tax profit contribution from the main business segments of Orient. As you can see, Orient's plantation division has a pre-tax profit equivalent to some medium-size plantation companies listed on the exchange, such Hap Seng Plantation Holdings Bhd or Sarawak Plantation Bhd.


Recent Financial Results

In QE30/9/2007, Orient's net profit has increased by 23.6% q-o-q to RM104.6 million while turnover has gained 14.1% to RM1.2 billion. Net profit has however declined by 15.0% y-o-y from RM123.0 million, despite a 20.4%-jump in turnover. The lower net profit is attributable to lower effective tax rate enjoyed in QE30/9/2006.


Valuation

Based on yesterday's closing price of RM5.90, Orient is now trading at a trailing PE of 9.4 times (using the last 4 quarters' EPS of 62.87 sen). Its Price to Book is at 0.9 times (using its NTA per share of RM6.34 as at 30/9/2007). The stock has an acceptable dividend yield of 3.9% (which is better than FD rates).

Technical Outlook

The share price of Orient has risen from a low of RM4.00 in November 2006 to hit a high of RM7.45 in July last year. Since then, the share price has corrected back to its medium-term uptrend line support, at RM5.80-6.00.


Chart: Orient's weekly chart as at February 4, 2008 (courtesy of Quickcharts)

Conclusion

Based on attractive valuation & good technical set-up, I believe Orient is a good BUY for the medium-term. A catalyst for a revaluation of Orient may be a spin-off of its plantation division (like the listing of Hap Seng Plantation Holdings Bhd by Hap Seng Consolidated Bhd) or a strong pick-up in the automotive sector (which is quite likely to happen this year).

Monday, February 04, 2008

Imaspro has a better 2Q2008

Imaspro is involved in the manufacturing of pesticides and plant micronutrients, distribution and agency of pesticides and other agrochemicals, and trading of pesticides and other agrochemicals.

Imaspro has just announced its results for 2Q2008 which ended 31st December 2007. Its net profit has increased by 67.2% q-o-q or 60.7% y-o-y to RM4.4 million, while turnover has jumped by 49.1% q-o-q or 41.6% y-o-y to RM33.6 million. The big improvement in Imaspro's performance is attributable to significant increase in its export sales. Imaspro's export sales for 1H2008 account for about 54% of its total sales, as compared to about 42% for the same period last year.


If Imaspro can maintain its performance, its full-year EPS may exceed 20 sen. Based on its closing price as at February 4th of RM1.29, it is now trading at a PE of 6.5 times.

From the chart below, we can see that Imaspro share price has been drifting lower for the past 12 months. It hit a high of RM1.76 in January 2007 and recorded a recent low of RM1.04 about 2 weeks ago. Imaspro share price must surpass the downtrend line resistance at RM1.30, failing which its near term technical outlook remained bearish.


Chart: Imaspro's weekly chart as at January 31, 2008 (courtesy of Quickcharts)

Based on its improved financial performance, Imaspro could be a good medium-term BUY. However, its share price must surpass the RM1.30 level before the technical picture can turn positive.

Evergreen is nearing its uptrend line

I have first called a BUY on Evergreen in May 2006, when the share price broke to the upside of the then prevailing downtrend line at RM0.90 (go here). Since then the stock has done fairly well as its financial performance has improved steadily.

The last financial results available was the results for QE30/9/2007. The net profit has increased by 77.4% y-o-y from RM18.3 million to RM31.6 million, while its turnover has gained 46.7% from RM137.9 million to RM202.4 million. The net profit was however lower than the preceding quarter's net profit of RM32.1 million, even though turnover was 5.1% higher. The decline in net profit was attributable to higher log price in Thailand (due to the rainy season); higher freight charges; and partial loss of production in its Johor plant due to a fire.


If Evergreen can maintain its current EPS of 6 sen per quarter, it will net a full-year EPS of 24 sen. At the present price of RM1.37, the stock is trading at a PE of 5.7 times. This is very attractive.

The technical outlook for Evergreen is not too bad. It has corrected back to its medium-term uptrend line support RM1.30-35. This is also a strong horizontal support for the stock.


Chart: Evergreen's weekly chart as at January 31, 2008 (courtesy of Quickcharts)

Based on attractive valuation & nice technical set-up, Evergreen could be a good BUY.

Dry Bulk Freight Rates may rebound

In November last year, I have posted about the reversal in Dry Bulk Freight Rates as reflected by the Baltic Drybulk Index, BDI (go here). Since then, the BDI has dropped about 50% from its peak of 11000 to 5500 (see Chart 1 below). From Chart 2 below, it appears that the BDI has just hooked up & is about the rebound. Whether the rebound can sustain or not, that's the big question. A recovery in BDI is fairly hard to believe, given the gloomy outlook for the global economy, which is expected to be negatively impact by a possible recession in the US.

If Dry Bulk Freight Rates' recovery can sustain, we may see a recovery in the share price of shipping stocks. As such, Maybulk & Hubline may be a good BUY at this moment. From Chart 3 & 4 below, we can see that Maybulk & Hubline have recently tested & rebounded from its medium-term uptrend line.


Chart 1: Baltic Drybulk Rates' weekly chart as at January 31, 2008 (courtesy of Investment.tools.com)


Chart 2: Baltic Drybulk Rates' daily chart as at January 31, 2008 (courtesy of Investment.tools.com)


Chart 3: Maybulk's weekly chart as at January 31, 2008 (courtesy of Quickcharts)


Chart 4: Hubline's weekly chart as at January 31, 2008 (courtesy of Quickcharts)