Monday, August 31, 2015

PBA: Profits Soared on Higher Tariffs


Results Update

For QE30/6/2015, PBA's net profit soared 8 folds q-o-q or 77% y-o-y to RM14.6 million. At the same time, revenue increased 17% q-o-q or 12% y-o-y to RM75 million. The increased revenue was mainly due to the review in water tariffs which were raised with effect from 1 April  2015 for domestic and trade consumers. The increase in water revenue led to a jump in profits.  


Table: PBA's last 8 quarterly results


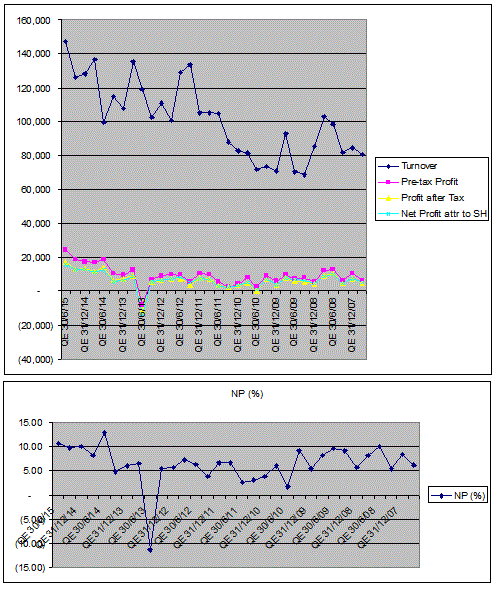
Chart 1: PBA's last 41 quarterly results

Valuation
 
PBA (closed at RM0.95 on Aug 28, 2015) is now trading at a trailing PER of 13 times (based on last 4 quarters' ESP of 7.4 sen). If we assume that the last quarter's EPS of 4.4 sen can sustain for the next 3 quarters, then its forward PER is 5.4 times. At that PER, PBA is deemed fairly attractive. In addition, PBA also pays a dividend totaling 3.75 sen a year or giving a DY of 3.9%.

Technical Outlook

PBA has been in a downtrend for the past 17 months after it made a high of RM1.67 in March 2014. It has good support at RM0.80-0.85 & resistance at RM1.00.


Chart 2: PBA's monthly chart as at Aug 28, 2015 (Source: ShareInvestor.com)

Conclusion

Based on good financial performance & attractive valuation,PBA is rated a good stock for medium-term investment.

Note:
In addition to the disclaimer in the preamble to my blog, I hereby confirm that I do not have any relevant interest in, or any interest in the acquisition or disposal of, PBA.

Kianjoo: Good Value Stock

Result Update

For QE30/6/2015, Kianjoo's net profit increased by 25% q-o-q or 28% y-o-y to RM35 million while revenue increased by 13% q-o-q or 18% y-o-y to RM392 million. The sequential rise in net profit was attributable to improved performance by all 3 divisions: can, carton & contract oackaging.


Table 1: Kianjoo's last 8 quarterly results

 
Table 2: Kianjoo's segmental results for 2Q2015 vs. 1Q2015


Chart 1: Kianjoo's last 35 quarterly results

Valuation

Kianjoo (closed at RM2.98 on Friday) is now trading at a PE of 9.6 times (based on last 4 quarters' EPS of 31 sen). At this multiple, Kianjoo is deemed attractively valued.

Outstanding Privatization Proposal

In 2013, Aspire Insight- a 60:40 JV between Kianjoo's former COO, Chee Kay Leong & EPF) made an offer to privatize Kianjoo at a price of RM3.30  per share. This offer faced legal challenges from substantial shareholders, such as Anthony See, which had since been resolved.

The offer made by Aspire Insight was based on FY2013 PER of 12.4 times & 1.4 times NTA. If the offeror wishes to secure an easier acceptance, it might want to revise its offer price after taking into consideration the improved financial performance of Kianjoo in Fy2014 & Fy2015. If so, the revised price could be RM3.80-3.84.

Technical Outlook

Kianjoo is in an "uptrend" line with support at RM2.90-3.00.


Chart 2: Kianjoo's monthly chart as at Aug 28, 2015 (Source: ShareInvestor.com)

Conclusion

Based on good financial performance, attractive valuation & positive technical outlook, Kianjoo is a good stock to consider for long-term investment. If Aspire Insight carries out its offer at the original price of RM3.30, you will get a decent return of 10% for a month holding period of 4-6 months.

Note:
In addition to the disclaimer in the preamble to my blog, I hereby confirm that I do not have any relevant interest in, or any interest in the acquisition or disposal of, Kianjoo.

Selamat Merdeka!

Merdeka means freedom and liberty to live our lives in peace. Merdeka means nothing if our minds are closed and we live in fear in our home. We would merely be exchanging one form of colonization for another; colonization from within in place of external form of colonization.

On this auspicious day, let's cherish the sacrifices made by our forefathers. If not them, we would not have the freedom & liberty that we enjoy today. Thus, it is beholden upon us to defend this nation and to safeguard our freedom & liberty for our children and future posterity!!


Source: KLGreetings

WTIC & CPO: Outlook as at August 31, 2015

WTIC charged back after testing the lower line of the expanding triangle ('ABCD'). In the process, it broke above its intermediate downtrend line, RR at USD40.50 as well as the horizontal resistance at USD44.00. Its next resistance levels are USD49 & USD54. For now, if it can hold above USD44, that's good enough.


Chart 1: WTIC's daily chart as at Aug 28, 2015 (Source: Stockcharts.com)

The recovery in WTIC also gave impetus to our CPO to stage a rebound. The sighting of a hammer is a bullish sign. This means that CPO is likely to recover for the near term.


Chart 2: CPO's daily chart as at Aug 28, 2015 (Source: ifs.marketcenter.com)

The near term bullish outlook for crude oil & CPO would augur well for O&G and plantation stocks.

GDEX: Top-line & Bottom-line Continued to Rise

Recent Results

For QE30/6/2015, GDEX's net profits rose 40% q-o-q or 57% y-o-y to RM9.2 million while revenue increased marginal by 1% q-o-q or 25% y-o-y to RM52 million. Profits improved mainly due to the group achieved cost efficiency through better cost control and monitoring.


Table 1: GDEX's last 8 quarterly results

 
Chart 1: GDEX's last 26 quarterly results
 
Financial Position

As at 30/6/2015, GDEX's financial position is deemed satisfactory with current ratio at 5.7 times & gearing ratio at 0.3 time. In addition, it has a net cash holding of RM51 million.

Valuation

GDEX (closed at RM0.865 on August 28, 2015) commands a PER of 40 times (based on last 4 quarters' EPS of 2.38 sen). At this PER, GDEX is very expensive. If after we had factored in the growth rate of 20%, the stock is still pricey with a PEG ratio of 2 times.


Technical Outlook

GDEX had a scorching run after it broke above its horizontal line at RM0.47 in August 2012. It rose all the way to RM1.80 in April 2015. From this peak, its descent began. It broke below its "uptrend" line at RM1.40 in early August and quickly tested its horizontal line support at RM0.85. Can this support hold up the stock?


Chart 2: GDEX's monthly chart as at August 28, 2015 (Source: ShareInvestor.com)

Conclusion

Based on the good financial performance & healthy financial position, GDEX is a good stock to consider for long-term investment. However it is fairly expensive, even after the sharp drop in the past 4 months. If you choose to buy this stock, you need to have a fairly long term investment horizon.

Note:
In addition to the disclaimer in the preamble to my blog, I hereby confirm that I do not have any relevant interest in, or any interest in the acquisition or disposal of, GDEX.

Friday, August 28, 2015

Market Outlook as at August 28, 2015

The rally across the board in stock markets worldwide has been very impressive. The same can be said for our Malaysian market. In addition to the 2 moving average lines (20 & 40-day EMA lines) acting as resistance, we have two gaps at 1635 & 1677 which could also serve the same purpose. With BERSIH 4 taking place this weekend, market players may play it safe by taking profit in the afternoon. I believe that's a good idea as FBMKLCI is nearing my target of 1640-1650 for this rally.


Chart: FBMKLCI's daily chart as at Aug 28, 2015_12.30pm (Source: ShareInvestor.com)

Meanwhile DJIA may have another 2-4% upside before it has to face the resistance at 17000-17350.


Chart 1: DJIA's daily chart as at Aug 27, 2015 (Source: Stockcharts.com)

Thursday, August 27, 2015

Silverlake Axis: Targeted for a Short?

Silverlake Axis is one of Malaysia's most successful software companies whose products, systems, and solutions serve many major financial institutions in the Southeast Asia. It is listed in SGX. 

On August 21, the stock came under heavy selling due to a report that its profit record was built on related party transactions that may not be genuine. For more, go here. As a result of this heavy selldown, the stock tumbled from S$0.80 to a low of S$0.40.


 Table: Silverlake Axis's Key Statistics (Source: Yahoo Finance)

We do not know where the truth lies. Silverlake Axis has appointed Deloitte Singapore to undertake an audit to clarify this matter. Notwithstanding this positive action, once the psychology behind any growth stock is broken - where the investors now have doubt about their basis of investing in the stock - that stock will take a long time to recover.

From the chart below, we can see that Silverlake Axis is a trending stock. The good thing about a trending stock is that you will roughly know when it is in a trend and when that trend has reversed. We can see clearly that Silverlake Axis broke its "uptrend line" at S$1.10 in early June. While its recent volatile price swing makes for difficult reading, I am pretty sure we have not seen the bottom for this stock. Its immediate support level is at S$0.30 while its immediate resistance is at S$0.55. At the time of writing this post, the stock is trading at S$0.545. If you have bought it for a quick trade, this is a good level to take profit.


 Chart: Silverlake Axia's weekly chart as at Aug 27, 2015_3.30pm (Source: Yahoo Finance)

Note:
In addition to the disclaimer in the preamble to my blog, I hereby confirm that I do not have any relevant interest in, or any interest in the acquisition or disposal of, Silverlake Axis.

A Glimmer of Hope...

 DJIA rebounded yesterday to close at 16286- a gain of 619! Its objective for today will be to close the gap & challenge the horizontal resistance at 16500.

 
 Chart 1: DJIA's daily chart as at Aug 26, 2015 (Source: Stockcharts)

The hapless China A50 put in a not-so-imprressive gain of 191 to close at 8766. Its recovery is a tad uncertain but I believe that it should be able to at least test the horizontal resistance at 9500 this few days.


  Chart 2: China A50's daily chart as at Aug 26, 2015 (Source: Stockcharts)

WTIC is exhibiting an expanding triangle- a rare pattern- with support at USD37. I believe that there is a fair chance that it may put in a decent rebound from here.

 
 Chart 3; WTIC's daily chart as at Aug 26, 2015 (Source: Stockcharts)

The collective recovery of these 3 indices could help our market. We may see our FBMKLCI punches through the 1600 & possibly reaching its goal of 1650. It is hard to see beyond that.

Parkson: Finally, the loss surfaced

Result Update

For QE30/6/2015, Parkson reported a net loss of RM91 million on the back of a revenue of RM859 million. Revenue dropped 18% q-o-q in the absence of major festivities. Parkson's Malaysian operations were further affected by the soft consumer sentiments following the introduction of GST on 1 April 2015. The lower sales performance and loss on an exceptional item of RM149 million have resulted in the Group reporting a loss before tax of RM156 million.

The loss on the exception item is the contingent compensation payable to the property owner for the closure of a store by Parkson Hanoi Co Ltd. If you read the explanation below, it seems that this amount may be reversible in the next financial year because Parkson Hanoi Co Ltd has now ceased to be a subsidiary of Parkson Retail Asia Ltd, which is a subsidiary of Parkson. While investors may take comfort in this potential reversal, the question to ask is this: Wouldn't the selling price of Parkson Hanoi Co Ltd be reduced by the potential loss. If so, the exceptional loss is still a loss however it is presented.


Diagram: Note on Exceptional Loss


Table 1: Parkson's last 8 quarterly results


Chart 1: Parkson's last 34 quarterly results 

Valuation

Parkson (closed at RM1.12 yesterday) is now trading at a PER of 28 times (based on last 4 quarters' EPS of 4 sen). This elevated PER is due to exceptional circumstances which may or may not continue. Its PBR of 0.5 time only (based on NTA od RM2.43 as at 30/6/2015). Based on low PBR, Parkson could be an attractive stock for contrarian investing.

Technical Outlook

Parkson is fast approaching its low of RM0.90 recorded in 2003. Yesterday it made an intraday low of RM1.01 before rebounding. With this set of poor result, a retest of the lows - yesterday's low or 2003 low - cannot be ruled out.


Chart 2: Parkson's monthly chart as at Aug 26, 2015  (Source: ShareInvestor.com)

Conclusion

Based on poorer financial performance & bearish technical outlook, Parkson is a stock to be avoided for now. However, those with a contrarian streak may consider this stock for long-term investment at the present depressed price while those who had bought earlier, should hold onto their investment.

Note:
In addition to the disclaimer in the preamble to my blog, I hereby confirm that I do not have any relevant interest in, or any interest in the acquisition or disposal of, Parkson.

Wednesday, August 26, 2015

Market Outlook as at Aug 26, 2015

Despite the negative longer term view, the current rebound in FBMKLCI is surprisingly strong- albeit confined to blue chip stocks. If the rebound can sustain, FBMKLCI may recover back to the 30-day EMA line at 1640-1650. We have seen a similar rebound in December 2014. The indicators, MACD and Slow Stochastics, are poised to hook up.

In view of this, I would recommend that you hold back your selling for better prices. For those, who have been waiting to get into some blue chip stocks, you may accumulate a bit if their prices have not run up too much. Good luck!


Chart: FBMKLCI's daily chart as at Aug 26, 2015_3.00pm (Source: ShareInvestor.com)

SCABLE: Top-line & bottom-line soared

Background

Sarawak Cable Berhad ("SCABLE") is mainly a provider of power solutions. It manufactures power cables, wires & conductors that are used in distribution lines, as well as inside in homes, offices and factories. It also produces steel poles, street lighting column and highway guardrails, structural steel, tower/ poles and steel bridges.

Recent Financial Performance

SCABLE's financial performance has been relatively pedestrian until the last 2-3 quarters. That's when it completed its acquisition of 2 subsidiaries, Universal Cable (M) Berhad and Leader Cable Industry Berhad. These companies boosted its revenue and profit substantially.


Table: SCABLE's last 10 quarters' P&L


Chart 1: SCABLE's last 10 quarters' P&L

Financial Position

As at 30/6/2015, SCABLE's financial position is very weak, with current ratio at 0.93 time and Total Liabilities to Total Equity at 2.74 times or Total Borrowings to Total equity at 1.61 times.

Valuation

SCABLE (closed at RM1.22 yesterday) is now trading at a PER of 8 times (based on annualized EPS of 14.9 sen). At this PER, SCABLE is considered fairly valued.

Technical Outlook

SCABLE is resting on its tentative uptrend line SS support at RM1.20-1.22. If it can break above its intermediate downtrend line, RR resistance at RM1.45-1.48, the share price may rally.


Chart 2: SCABLE's monthly chart as at Aug 25, 2015 (Source: ShareInvestor,com)

Conclusion

Based on improved financial performance, attractive valuation  & mildly positive technical outlook, SCABLE PetronM could be a good stock for a medium-term investment. However, your exposure should be optimized to take into consideration the group's weak financial position.

Note: 

In addition to the disclaimer in the preamble to my blog, I hereby confirm that I do not have any relevant interest in, or any interest in the acquisition or disposal of, SCABLE.

PetronM: Earning starts to roll in

Latest Quarterly Results

PetronM's net profit rose 29% q-o-q to RM73 million on the back of a 23%-increase in revenue to RM2.265 billion. Revenue increased q-o-q due to higher selling prices of finished products & increased output of 7.9 million barrels (compared to 7.2 million barrels in QE31/3/2015). The company attributed the improved bottom-line to operational efficiency and improved margins (flowing from continued cracking margin recovery).

Cracking margins or crack spreads represent the price difference between refiners’ revenues—achieved through the sale of finished refined products—and refiner costs—that is, the price of crude oil. Crack spreads increase when product prices increase more than the price of crude oil, or when the price of crude oil falls more than product prices.


Table: PetronM's last 11 quarterly results


Chart 1: PetronM's last 11 quarterly results

Valuation

PetronM (closed at RM2.86 yesterday) is now trading at a PER of 3 times (based on annualized EPS of 96 sen). The exceptionally high earning is likely to reverse once the crude oil prices recover and the crack spreads narrow.

Technical Outlook

PetronM tested its uptrend line support at RM2.50 last few months. It has now broken above its intermediate downtrend line, RR at RM2.80. This means that the stock could rise further.


Chart 2: PetronM's monthly chart as at Aug 25, 2015 (Source: ShareInvestor,com)

Conclusion

Based on turnaround in financial performance, attractive valuation  & mildly positive technical outlook. PetronM could be a good stock for a medium-term investment.

Note: 

In addition to the disclaimer in the preamble to my blog, I hereby confirm that I do not have any relevant interest in, or any interest in the acquisition or disposal of, PetronM.

Tuesday, August 25, 2015

DLady: Top-line & bottom-line rebounded

Result Update

For QE30/6/2015, DLady's net profit increased by 186% q-o-q or 101% y-o-y to RM49 million while its revenue increased by 41% q-o-q or 4% y-o-y to RM278 million. PBT increased q-o-q due to improved revenue and lower raw material prices while the sequential increase in revenue was due to the new relaunch of Dutch Lady Children Formula Milk.


Table: DLady's last 8 quarterly results


Chart 1: DLady's last 29 quarterly results

Valuation

DLady (closed at RM45.80 yesterday) is now trading at a PE of 22 times (based on last 4 quarters' EPS of 200 sen). At this PER, DLady is deemed fairly attractive. Its DY is fairly decent at 4.8%.

Technical Outlook

Since October 2012, DLady has been moving sideways around RM40-48. Its indicators gave mixed reading, with monthly MACD hooked down. A breakout of the trading range of RM46-48 will point the way forward for the stock.


Chart 2: DLady's monthly chart as at Aug 24, 2015 (Source: Share Investor)

Conclusion

Based on improved financial performance and attractive valuation, I would revise DLady's rating from REDUCE to BUY.

Note:
In addition to the disclaimer in the preamble to my blog, I hereby confirm that I do not have any relevant interest in, or any interest in the acquisition or disposal of, DLady.

Panamy: Top-line & bottom-line recovered

Results Update

For QE30/6/2015, Panamy's net profit increased by 33% q-o-q or 37% y-o-y to RM32million while revenue increased by 48% q-o-q or 7% y-o-y to RM267 million. Revenue & profits increased q-o-q due to higher sales in domestic markets for both Home Appliances and Fan products contributed from sales momentum gained post GST implementation.


Table: Panamy's last 8 quarterly results


Chart 1: Panamy's last 34 quarterly results

Valuation

Panamy (at RM21.42 yesterday) is trading at a PE of 12 times (based on last 4 quarters' EPS of 178 sen). At this PER, Panamy is deemed attractively valued. In addition, Pananmy has announced dividend totaling 127 sen (here & here). This means the DY for the stock is 5.9%.


Chart 2: Panamy's dividend record for last 34 quarterly results

Technical Outlook

Panamy is a long-term "uptrend line", with support at RM22.00. It also has horizontal support at RM20.00 and the line connecting its recent low for the past 4 years (A-B) at RM18.50.


Chart 3: Panamy's monthly chart as at Aug 25, 2015 (Source: ShareInvestor)

Conclusion

Based on good financial performance, attractive valuation and positive technical outlook, Panamy is still a good stock for long-term investment.

Note:
In addition to the disclaimer in the preamble to my blog, I hereby confirm that I do not have any relevant interest in, or any interest in the acquisition or disposal of, Panamy.

Harbour: Top-line & bottm-line increased

Result Update

For QE30/6/2015, Harbour's net profit increased by 26% q-o-q or 23% y-o-y to RM15.6 million while its revenue increased by 17% q-o-q or 48% y-o-y to RM147 million. Revenue & profits increased q-o-q due mainly to higher revenue & profits from the logistics services and machinery division- resulted from higher volume of cargo freighting and project cargoes handled.


Table: Harbour's last 8 quarterly results


Chart 1: Harbour's last 32 quarterly results

Valuation

Harbour (closed at RM2.19 yesterday) is now trading at a PE of 7.7 times (based on last 4 quarters' EPS of 28.6 sen). At this PER, Harbour is deemed attractively  valued. 

Technical Outlook

Harbour is in an uptrend. Its immediate support is at the horizontal line at RM2.00.


Chart 2: Harbour's monthly chart as at Aug 24, 2015 (Source: Share Investor)

Conclusion

Based on good financial performance, attractive valuation & still positive technical outlook, I would revise my rating for Harbour from TAKE PROFIT to BUY.

Note:
In addition to the disclaimer in the preamble to my blog, I hereby confirm that I do not have any relevant interest in, or any interest in the acquisition or disposal of, Harbour.

Sign: Top-line & bottom-line plummeted

Results Update

For QE30/6/2015, Sign's net profit dropped 71% q-o-q or 62% y-o-y to RM3.8 million while revenue dropped by 37% q-o-q or 18% y-o-y to RM55 million. Revenue & PBT dropped q-o-q as a result of lesser in project revenue being recognized from both Kitchen & Wardrobe and Glass & Aluminium segments.


Table: Sign's last 8 quarterly results

 
Chart 1: Sign's last 30 quarterly results

Valuation

Sign (closed at RM2.36 yesterday) is now trading at a trailing PE of 7.8 times (based on last 4 quarters' EPS of 30.2 sen). However, if the earnings continue to remain weak- like QE30/6/2015- then its full-year EPS would drop to 12.8 sen. This will push its PER to 18 times. Thus, Sign's valuation could be considered as expensive.

(Note: Sogn is trading at RM2.00 as at 9:15am)

Technical Outlook

Sign is trading at its uptrend line at RM2.00. A drop below this level could signal a bearish reversal in the stock.


Chart 2: Sign's monthly chart as at Aug 25, 2015_9.15am (Source: ShareInvestor.com)

Conclusion

Based on poorer financial performance and potentially demanding valuation, Sign's rating is revised from a BUY to a HOLD. Further decline in its share price below the uptrend line could tip the rating to a SELL.

Note: 
In addition to the disclaimer in the preamble to my blog, I hereby confirm that I do not have any relevant interest in, or any interest in the acquisition or disposal of, Sign.

Market Outlook as at August 25, 2015

In an earlier post, I posit that FBMKLCI may find some support at the middle line (B-B1) of the upward channel (here). The market had a short rebound on August 18 and the selling returned. Yesterday, FBMKLCI crossed below the middle-line into the lower half of the upward channel. The crossing of this line signals further downside for the market. Unless a strong recovery happens, the market may go all the way to the lower line (C-C1) at 1200. (Note: The middle-line dissects the upward channel into 2 halves: the upper portion is denoted as "1" while the lower portion is denoted as "2".)


Chart: FBMKLCI's daily chart as at Aug 24, 2015 (Source: ShareInvestor.com)

Everything falls...

So much has changed in just a short 2 days! FTSE CHINA A50 punched thru its horizintal support at 10200. It is now hanging onto ot its 9000-9200 horizontal/psychological support. If this fails, the next strong support is at 8500.


Chart 1: FTSE CHINA A50's daily chart as at Aug 24, 2015 (Source: uk.investing.com)

DJIA, which broke below its long-term uptrend line, SS at 18000 in mid-June, finally careened off the cliff in the past few days. It violated its horizontal support at 15700 & rebounded back some yesterday. I believe DJIA will try to hold onto this support for now. Its next support is at the horizontal line at 14800.


 Chart 2: DJIA's weekly chart as at Aug 24, 2015 (Source: Stockchart.com)

WTIC joined in the selldown. It broke the psychological USD40 yesterday. Its next support levels are USD34 (its 2009 low); the psychological level of USD30; and USD25 (its 2003 low).


Chart 3: WTIC's monthly chart as at Aug 24, 2015 (Source :investorshub)

After the furious selldown for the past 2 trading days, markets are poised for some technical rebound. The strength of this rebound will reflect market's confidence in central bankers' ability to handle the financial maelstrom. After the big screw-up in Beijing, I hope that the Fed will do a better job at managing the financial markets.

    Turning and turning in the widening gyre
    The falcon cannot hear the falconer;
    Things fall apart; the centre cannot hold;

                                                 (William Butler Yeats's The Second Coming)

Monday, August 24, 2015

Scicom: A decent stock for the long run, not now

Background

Scicom (MSC) Bhd ('Scicom') is mainly involved in the provision of customer service outsourcing services

Recent Yearly Results

Scicom's top-line and bottom-line have been growing steadily over the past 10 years.


Chart 1: Scicom's last 10 yearly results

Recent Quarterly Results

From the table & chart below, we can see that revenue & profits exhibit slow & steady growth in the past 10 quarters. For QE30/6/2015, revenue increased q-o-q due to due to increase in billable headcounts for existing projects (RM5.31 million), ad-hoc projects (RM1.79  million) and new projects secured  (RM1.39million). PBT rose q-o-q due to an increase in profitability  for outsourcing projects coupled with the recognition of a higher foreign exchange gain.


Table: Scicom's last 10 quarterly results


Chart 2: Scicom's last 10 quarterly results

Financial Position

Scicom's financial position is deemed satisfactory as at 30/6/2015. Its current ratio stood at 14 times while gearing 0.2 time.

Valuation

Scicom (closed at RM1.75 last Friday) is now trading at a PER of 17 times (based on last 4 quarters' EPS of 10.2 sen). At this PER, Scicom is fairly valued.

Scicom paid dividend totaling 7.5 sen and 7.0 sen for FY2015 & FY2014. Based on the latest dividend payout, its DY is quite decent at 4.3%.

Techncial Outlook

Scicom broke above its strong horizontal resistance at RM0.50 in October 2013 and rallied to a high of RM2.36 in April 2015. The stock then dropped back & broke its uptrend line support at RM2.00 in June. The MACD signal line is poised to cut below the MACD while ADX indicates the upward momentum is gone. All in all, I think the top is probably in for Scicom. Its immediate strong support is at RM1.20- which is quite a distance from the current price of RM1.64.


Chart 3: Scicom's monthly chart as at Aug 21, 2015 (Source: ShareInvestor.com)

Conclusion

Based on good financial performance & position; steady growth; and, decent valuation, Scicom is a good stock for long-term investment. Given its bearish technical outlook, you can wait for the prices to roll down before committing.

Note: 
In addition to the disclaimer in the preamble to my blog, I hereby confirm that I do not have any relevant interest in, or any interest in the acquisition or disposal of, Scicom.