Friday, March 29, 2013

Tecguan- hit by weaker CPO & cocoa prices

Result Update

For QE31/1/2013, Tecguan incurred a pre-tax los of RM15.9 million on a revenue of RM35.8 million. Its profit attributable to shareholders came in at RM23.4 million after it recorded a surplus of RM39.3 million from the revaluation of land, building & biological assets.


Table 1: Tecguan's last 8 quarterly results

Looking at Chart 1, we can see that Tecguan's losses for the current year was due to losses from both its Oil Palm & Cocoa products division. This is a complete reversal from last year when both divisions recorded positive result. How did Tecguan record a loss in the Oil Palm division?


Chart 1: Tecguan's Segmental Performance for 9-month for FY2013, FY2012 & FY2011


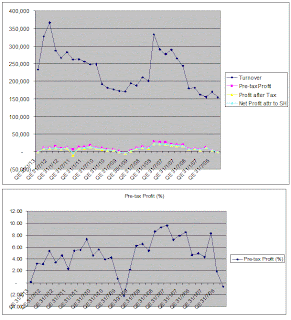
Chart 2: Tecguan's last 23 quarterly results

Financial Position

Tecguan's financial position as at 31/1/2013 is deemed weak, with current ratio barely above unity and gearing ratio at an elevated level of 0.82 time.

Valuation

Tecguan (closed at RM0.67) is now trading at a PB of 0.4 time (based on NTA of RM1.68 ps. as at 31/1/2013). Being a loss-making company, Tecguan does not have a PE ratio.

Technical Outlook

Tecguan is in a long-term downward channel. In addition, the stock is range-bounce between RM0.50 & RM0.80.


Chart 3: Tecguan's monthly chart as at Mar 28, 2013 (Source: Tradesignum)

Conclusion

Based on poor financial performance, weak financial position and poor technical outlook, I revise the rating for Tecguan to a SELL.

Note:
In addition to the disclaimer in the preamble to my blog, I hereby confirm that I do not have any relevant interest in, or any interest in the acquisition or disposal of, Tecguan.

Apollo- export boosted the top-line & bottom-line

Result Update

For QE31/1/2013, Apollo's net profit increased by 21% q-o-q or 64% y-o-y to RM9.3 million while revenue increased by 9% q-o-q or 14% y-o-y to RM57 million.


Table 1: Apollo's last 8 quarterly results

We can see from Chart 1 below that revenue from both the domestic & export markets had increased for the 9-month ended 31/1/2013 as compared to the same period last year. Segmental result shows a huge jump in the contribution from the export market.


Chart 1: Apollo's Segmental Performance for 9-month for FY2013, FY2012 & FY2011

From Chart 2 below, we can see that Apollo's bottom-line had been rising over the past 2 years due to rising revenue (or, sales) as well as rising profit margin. All in all, a very healthy development for this company.


Chart 2: Apollo's last 22 quarterly results

Valuation

Apollo (at RM3.74 as at 3:00pm) is now trading at a PE of 9 times (based on last 4 quarters' EPS of 42 sen). At this PE, Apollo is deemed fairly attractive. It could command a PE of 10-12 times.

Technical Outlook

Apollo is in a gradual long-term uptrend. It has just surpassed its 2010 high of RM3.50. Thus, the stock is poised to continue in its uptrend, with its next resistance at RM4.00.


Chart 3: Apollo's monthly chart as at Mar 28, 2013 (Source: Tradesignum)

Conclusion

Based on good financial performance, attractive valuation and interesting technical outlook, Apollo could be a good stock for a long-term investment.

Note:
In addition to the disclaimer in the preamble to my blog, I hereby confirm that I do not have any relevant interest in, or any interest in the acquisition or disposal of, Apollo.

Tienwah- uptrend to continue

Tienwah broke above its horizontal resistance at RM2.15 on March 25. The breakout was not accompanied by increased but not significant volume. Then again, this stock is relatively quiet. For more on this stock, go here.

Based on this breakout, Tienwah may rise to RM2.40-2.50. As such, this stock could be a good trading BUY.


Chart: Tienwah's weekly chart as at Mar 28, 2013 (Source: quickcharts)

Note:
In addition to the disclaimer in the preamble to my blog, I hereby confirm that I do not have any relevant interest in, or any interest in the acquisition or disposal of, Tienwah.


Thursday, March 28, 2013

Scientex- bottom-line improved

Result Update

Yesterday, Scientex announced its results for QE31/1/2013. Its net profit increased by 3% q-o-q or 27% y-o-y to RM25.6 million while its revenue increased by 12% q-o-q or 26% y-o-y to RM271 million. The improved bottom-line on a q-o-q basis was attributable to one-month contribution from the newly-acquired manufacturing businesses of GW Plastic & GW Packaging.


Table: Scientex's last 8 quarterly results


Chart 1: Scientex's last 30 quarterly results

Valuation

Scientex (at RM3.90 as at 10.30am) is now trading at a PE of 9 times (based on last 4 quarters' EPS of 43.53 sen). Its PEG ratio is about 0.6 time, since the earning grew at 14-16% over the past 2 years. At this CAGR, Scientex may command a PE of 12 times or a fair price of RM5.20.

Technical Outlook

The stock is in an uptrend. Last week, it broke above r2-r2, the line connecting the high over the past 2 years. The previous breakout of a similar line (R-r1), the stock rose from RM1.95 to RM2.70. I expect the stock to rise steady to test the line, RR which connect the peak over the past 4 years. If that pans out, this stock's medium-term resistance would be RM4.50-4.70.


Chart 2: Scientex's weekly chart as at Mar 27, 2013_10.30am (Source: Quickcharts)

Conclusion

Based on good financial performance, attractive valuation & positive techncial outlook, Scientex is a good stock for medium to long-term investment.

Note:
In addition to the disclaimer in the preamble to my blog, I hereby confirm that I do not have any relevant interest in, or any interest in the acquisition or disposal of, Scientex.

Gamuda- uptrend to continue

Gamuda broke above its strong horizontal resistance at RM4.00 yesterday. With this breakout, the stock is likely to continue its prior uptrend. Its next resistance is at RM4.50 & then the 2008 high of RM5.00.


Chart 1: Gamuda's weekly chart as at Mar 27, 2013_10.00am (Source: Quickcharts)

Gamuda-WD has broken above its horizontal resistance at RM1.20 & its long-term downtrend line at RM1.22. With these double breakout, the warrant's next resistance is at RM1.30 (which it has just surpassed this morning) and then its 2012 high at RM1.50-1.52.


Chart 2: GAmuda-WD's weekly chart as at Mar 27, 2013_10.00am (Source: Quickcharts)

Based on the above technical breakout, Gamuda and its warrant are both good trading BUY.

Note:
In addition to the disclaimer in the preamble to my blog, I hereby confirm that I do not have any relevant interest in, or any interest in the acquisition or disposal of, Gamuda & Gamuda-WD.

Wednesday, March 27, 2013

Construction stocks may continue to rally

Construction index broke above its strong horizontal resistance at 245 today. At the time of writing, Construction index is at 246. Last week, this index broke above its downtrend line at 240. With these double breakouts, Construction sector is likely to begin its next upleg.

Based on this, we can consider investing or trading in construction stocks, such as IJM, Gamuda & WCT.


Chart: Construction's weekly chart as at Mar 27, 2013_4.00pm (Source: Quickcharts)

Note:
In addition to the disclaimer in the preamble to my blog, I hereby confirm that I do not have any relevant interest in, or any interest in the acquisition or disposal of, IJM, Gamuda & WCT.

VS- bottom-line continues to deteriorate


Result Update

For QE31/1/2013, VS's net profit plummeted 100% q-o-q & y-o-y to RM40k while revenue dropped 29% q-o-q or 12% y-o-y to RM234 million. VS's bottom-line dropped caused by lower sales & lower profit margin (due to fierce competition) and loss arising from dilution of interest in an associate in China amounting to RM5.9 million.


Table 2: VS's last 8 quarterly results


Chart 1: VS's last 32 quarterly results

Valuation

VS (closed at RM1.39 yesterday) is trading at a PE of 8.7 times (based on last 4 quarters' EPS of 16 sen). If the bottom-line continued to deteriorate, VS's PE ratio may expand in the next few quarters.


VS- an integrated electronics manufacturing services (EMS) provider- is a cyclical stock. As such, a good gauge of VS's potential low in a down cycle would be its Price to Book (PB) ratio. In the previous trough in early 2009, the PB ratio hit a low of 0.4 time. Currently, the PB ratio is at 0.6 time. VS would only revisit the low of 2009 if its financial performance continued to deteriorate. In such a scenario, VS may hit a low of 80-90 sen (assuming a PB ratio of 0.4 time).

Such a negative scenario may not pan out given signs that the global economy is slowly recovering. In my opinion, the likely scenario is that VS's financial performance may recover in the next few quarters.


Technical Outlook

VS is now in a downtrend line (R2-R2), with resistance at RM1.70. Its support may come from the curving line, C-C2 at RM1.30. If this curving line is violated, VS's next support would be the horizontal lines at RM1.20 & then at RM1.00. In an extreme situation, it may test the 'horizontal' line, SS at RM0.85-0.90.


Chart 2: VS's monthly chart as at Mar 26, 2013 (Source: Tradesignum)

Conclusion

Despite poor financial performance, VS is rated a HOLD based on possible technical support and potential recovery in the next few quarters. However, if the share price were to drop to RM1.00 level, the stock could become a good stock to accumulate for recovery play.

Note:
In addition to the disclaimer in the preamble to my blog, I hereby confirm that I do not have any relevant interest in, or any interest in the acquisition or disposal of, VS.

Prlexus- a very attractive stock

Background

Prolexus Bhd ('Prlexus') is involved in the manufacture & sale of apparel (here). It also has a small division that is involved in outdoor advertizing (here). The corporate structure is given in the table below:


Table 1: Prlexus's Corporate Structure

Recent Financial Performance

Prlexus's net profit rose 43% q-o-q or 67% y-o-y to RM4.9 million while revenue increased by 30% q-o-q or 32% y-o-y to RM64 million. The "increase in revenue is due to the increase in revenue of the garment division while profit for the current quarter is a significant increase when compared with that of the preceding quarter due to improved profits from both the Malaysian and China plant".


 Table 2: Prlexus's last 8 quarterly results

 
 Chart 1: Prlexus's last 18 quarterly results

Financial Position

Prlexus's financial position as at 31/1/2013 is deemed healthy with current ratio at 2.6 times while gearing ratio is negligible at 0.03 time. It has a substantial cash balance of RM33 million (or, 86 sen per share- arrived at by dividing cash balance with shares outstanding of 38.51 million, after deducting Treasury shares).

Valuation

Prlexus (closed at RM0.91 yesterday) is now trading at a PE of 2.5 times (based on last 4 quarters' EPS of 36 sen) or at a Price to Book of 0.44 time. If we deduct the cash of RM0.86 from the share price of RM0.91, we are paying 5 sen for this stock which earns 36 sen. I haven't seen anyone cheaper for a long time.

Technical Outlook

Prlexus is in an uptrend. Its immediate resistance is the horizontal lines at RM1.00 & then at RM1.50.

 
 Chart 2: Prlexus's weekly chart as at Mar 26, 2013 (Source: Tradesignum)

 
 Chart 3: Prlexus's monthly chart as at Mar 26, 2013 (Source: Tradesignum)

 Conclusion

Based on good financial performance & position, attractive valuation and positive technical outlook, Prlexus is a good stock for medium to long-term investment.

Note:
In addition to the disclaimer in the preamble to my blog, I hereby confirm that I do not have any relevant interest in, or any interest in the acquisition or disposal of, Prlexus

Tuesday, March 26, 2013

Maybank may have a bullish breakout

Maybank has just broken above its strong horizontal resistance at RM9.30. Its target is likely to be its next resistance at RM10.00. The run-up would coincide with the announcement of the ex-date for its 33-sen dividend which was proposed in February. The likely ex-date will in in April.

Based on technical consideration and the fact that Maybank is a fairly attractive banking stock (here), the stock could be a good trading BUY.


Chart: Maybank's weekly chart as at March 26, 2013_9.30am (Source: quickcharts)

Note:
In addition to the disclaimer in the preamble to my blog, I hereby confirm that I do not have any relevant interest in, or any interest in the acquisition or disposal of, Maybank.

Monday, March 25, 2013

IHH- uptrend acceleration possible

IHH broke above its irregular upward channel at RM3.55 on good volume. This breakout could signify an acceleration of the present gradual uptrend. Since the closing price at RM3.62 is not substantially higher than the breakout level, gaining a small position in the stock looks like a good bet. If the breakout falters - with the stock slipping back into the upward channel- the play would be deemed to have been aborted. Until then, this could be a potential trading BUY.

 
Chart: IHH's daily chart as at Mar 25, 2013 (Source: quickcharts)

Note:
In addition to the disclaimer in the preamble to my blog, I hereby confirm that I do not have any relevant interest in, or any interest in the acquisition or disposal of, IHH.


Presbhd- poised for breakout?

Presbhd may have a bullish breakout above its intermediate downtrend line at RM1.20. Despite the bullish breakout which came in the early morning, its trading for the rest of the day shows persistent selling. Let's wait & see whether the stock can stay above the RM1.20 mark. If so, the breakout is valid and one can take up a small position & wait for the next push. Potential gain is about 15-20 sen.


Chart: Presbhd's daily chart as at Mar 25, 2013 (Source: quickcharts)

Note:
In addition to the disclaimer in the preamble to my blog, I hereby confirm that I do not have any relevant interest in, or any interest in the acquisition or disposal of, Presbhd.

CPO- bottoming or bottomed?

In the Star newspaper today, the Chairman of IOI, Tan Sri Lee Shin Cheng was quoted as saying that the worst is over for plantation cycle (here). The reasons given by the IOI boss for calling the bottom for CPO are:
1. falling inventory levels (due to changes in export tax)
2. renewed B10 biodiesel programme
3. price differential between CPO and soyabean oil
Personally, I think the jury is still out on whether CPO prices had indeed made a bottom. To get a better feel of CPO, let's compare the current trough with the trough/bottom of 2008 (see Chart 1 & 2). From Chart 1, we can see that CPO bottomed & reversed in late 2008 after it had broken to the upside of a pennant formation. Today, CPO is still trapped in a bottoming formation known as a flag (or, some may call it a potential triple bottom). To break above the flag formation, CPO needs to surpass the RM2500-2550 level. Even after CPO has broken above that mark, it would immediately face resistance from the intermediate downtrend line at RM2700.


Chart 1: CPO's weekly chart as at October 2009 (Source: ifs.marketcenter)


Chart 2: CPO's weekly chart as at March 2013 (Source: ifs.marketcenter)
We must note that the breakdown of the long-term uptrend line in May 2012 is a very significant technical event. It is comparable to the breakdown of the long-term uptrend line in 2008 when the market took quite a while to stage a decent recovery. As such, Tan Sri Lee's target of RM2900 for CPO by year end looks rather bullish.


Chart 3: CPO's weekly chart October 2008-March 2013 Source: ifs.marketcenter)

Incidentally, after screening a few of the major plantation stocks- most of which are in various stage of consolidation- the only stock that caught my attention was Utdplt. The stock is trying to break above its all-time high at RM27.50. There are steady buying by its major shareholders, Aberdeen & Mitbubishi UFJ Financial Group. Is Utdplt at the cusp of another breakout? The last two breakouts - July 2010 & February 2012- preceded bullish technical breakout in the CPO in October 2010 & March 2012. Is Utdplt flagging another bullish breakout for CPO? Utdplt is well-acknowledged as one of the best managed plantation group in Malaysia, commanding a PE of 17 times.


Chart 4: Utdplt's weekly chart as at Mar 22, 2013 (Source: Qyuickcharts)

Note:
In addition to the disclaimer in the preamble to my blog, I hereby confirm that I do not have any relevant interest in, or any interest in the acquisition or disposal of, Utdplt.

IJM- testing its downtrend line

IJM has broken above the strong horizontal resistance at RM5.25. It is now pressing against the downtrend line, RR at RM5.32-5.34. If it can break above the downtrend line, the outlook for IJM would turn positive.

Based on the above, we should track IJM closely and see whether this stock can achieve an update breakout. An alternative to buy IJM will be to buy its warrant, IJM-WC which has 578 days to expiry and an exercise price of RM4.00. Presently, this warrant is trading at a small discount of 1.7%.


Chart: IJM's weekly chart as at March 25, 2013_11.00am (Source: Quickcharts)

Note:
In addition to the disclaimer in the preamble to my blog, I hereby confirm that I do not have any relevant interest in, or any interest in the acquisition or disposal of, IJM.

Thursday, March 21, 2013

KPJ- uptrend to continue

KPJ broke above its intermediate downtrend line, RR at RM5.90 yesterday. Today, it broke above the horizontal resistance at RM6.00. With these breakouts, KPJ is poised to continue with its prior uptrend. This is also reflected in the weekly charts for the stock and its warrant.

Based on this, KPJ could be a good trading BUY.


Chart 1: KPJ's daily chart as at March 21, 2013_11.30am (Source: Qucickharts)


Chart 2: KPJ's weekly chart as at March 21, 2013_11.30am (Source: Qucickharts)


Chart 3: KPJ-WA's weekly chart as at March 21, 2013_11.30am (Source: Qucickharts)

Note:
In addition to the disclaimer in the preamble to my blog, I hereby confirm that I do not have any relevant interest in, or any interest in the acquisition or disposal of, KPJ.

Wednesday, March 20, 2013

Takaful & BIMB- the rise continue?

Yesterday, Takaful broke above its recent high of RM6.33 (see Chart 1). It gained 55 sen to close at RM6.97. With this breakout above its all-time high, Takaful is expected to continue with its uptrend. However, when you look at the long-term chart of Takaful (see Chart 2), you can see that the share price had risen by more than four-fold in the past 2 years, from RM1.50 to RM6.97 yesterday. Can this rally sustain?

Takaful's financial performance has improved sharply in FY2012. Its net profit rose from RM77 million to RM101 million while revenue soared to RM1.61 billion from RM1.35 billion previously. Its EPS increased from 47 sen to 62 sen. [Note: Takaful's net profit for FY2010 was RM61 million while its revenue was RM1.73 billion.]

At the close of RM6.97, Takaful is now trading at a PE of 11 times, which is fairly attractively. Its Price to Book is relatively high at 2.3 times (based on Net Assets p.s. of RM3.07 as at 31/12/2012) but can be justified due to strong earning growth. OSK has a report on Takaful which placed the target price for the stock at RM8.00 (via i3investor.com).


Chart 1: Takaful's weekly chart as at Mar 19, 2013 (Source: Quickcharts)


Chart 2: Takaful's monthly chart as at Mar 18, 2013 (Source: Tradesignum)

The alternative to Takaful- a relatively small stock with outstanding share issue of 162.8 million shares- is its holding company, BIMB. BIMB -with an outstanding share issue of 1.07 billion shares- tends to follows in the same trajectory as Takaful. As noted previously, the time lag between an upside move for Takaful & a similar move by BIMB is about 1.5 months. This time lag may have widened to 2 months.

BIMB's financial performance has also improved over the past few years. For FY2012, BIMB's net profit rose from RM212 million to RM251 million while revenue rose from RM2.04 billion to RM2.52 billion. For more, go here.

At a close of RM3.31 yesterday, BIMB is now trading at a PE of 14 times (based on FY2012 EPS of 23.5 sen) or at a Price to Book of 1.8 times (based on Net Assets p.s. of RM1.89 as at 31/12/2012). While BIMB's PB ratio is lower than Takaful's, its PE ratio is higher. Its earning growth is slower than Takaful's.


Chart 3: Takaful & BIMB''s weekly chart as at Mar 19, 2013 (Source: Quickcharts)

Based on the above, Takaful could be a good trading BUY. For those with lower risk tolerance, you may consider BIMB which may follow in the upside move after a short delay.

Note:
In addition to the disclaimer in the preamble to my blog, I hereby confirm that I do not have any relevant interest in, or any interest in the acquisition or disposal of, Takaful & BIMB.

Friday, March 15, 2013

PPB broke above the neckline of an inverted Head-&-Shoulders

PPB rose 84 sen to RM13.12 as at 4.30pm. Volume was very high at 55,000 board lots.

From the chart, it looks like the stock has broken above the neckline (R1-R1) of its inverted Head-&-Shoulders formation at RM12.60. It is now pressing against the horizontal resistance at RM13.25 which happens to be the intermediate downtrend line, RR.

The breakout above the inverted H-&-S formation is a reverse pattern to the preceding downtrend. This could mean that PPB is about to rally into its next upleg.

Based on this technical reading, PPB could be a good trading BUY.


Chart: PPB's daily chart as at Mar 15, 2013_4.30pm (Source: Quickcharts)

Note:
In addition to the disclaimer in the preamble to my blog, I hereby confirm that I do not have any relevant interest in, or any interest in the acquisition or disposal of, PPB.

(PPB eased back to close at RM12.68 with more than 21,000 board lots matched.)

Thursday, March 14, 2013

Padini may continue with its prior uptrend

Technical Breakout

Padini broke above its horizontal resistance at RM1.90 yesterday and closed at RM1.97. Padini, a trending stock, had been in an intermediate downtrend since September 2012. In late January this year, Padini broke above the downtrend line at RM1.80 and had been moving in sideway in a range between RM1.77 & RM1.90  The upside breakout above the range could signal the continuation of the long-term uptrend. For more, see the two charts below.


Chart 1: Padini's daily chart as at Mar 13, 2013 (Source: Quickcharts)


Chart 2: Padini's weekly chart as at Mar 13, 2013 (Source: Tradesignum)

Recent Financial Results

It must been noted that Padini's financial performance for 1H2013 declined compared to last year. Its revenue increased from RM381 million to RM409 million while net profit dropped from RM56 million to RM45 million.

For QE31/12/2012, revenue increased by 2.6% as a results of a 17.7%- expansion in floor area (or an increase of 107,104 square feet). The increased floor area led to 10.6%-increase in operating expenses (for QE31/12/2012). At the same time, the company experienced a contraction of 3.4% in the gross profit margins in 1H2013 due mainly to an increased preference among consumers for the more affordable range of the Group’s merchandise whose mark-ups are lower. The lower gross profit margin & higher operating expenses resulted in a decline in the bottom-line for Padini. For more, go here.

Valuation

Padini (closed at RM1.97 yesterday) is now trading at a PE of 14.5 times its annualized FY2013 EPS of 13.7 sen. At this PE, Padini is deemed fairly valued. The upside will however come from improved gross profit margin as well as increased sales per unit area.

Conclusion

Based on technical breakout, Padini could be a good trading BUY. Immediate resistance is at RM2.00 & then at the recent high of RM2.30.

Note:
In addition to the disclaimer in the preamble to my blog, I hereby confirm that I do not have any relevant interest in, or any interest in the acquisition or disposal of, Padini.

Wednesday, March 13, 2013

Market Outlook as at March 13, 2013

The market dropped about 10 points in early trading (up to 11:30am). This means that the index is now testing its 10-day EMA line at 1646. See the daily chart, Chart 1 below.


Chart 1: FBMKLCI's daily chart as at Mar 13, 2013_11.15am (Source: Quickcharts)

If we look at the 120-minute intra-day chart (Chart 2), we can see that the index is now approaching the 50-period EMA line at 1643. This EMA line should provide support to halt the decline. A break below this line would be very negative and lead to further downside.


Chart 1: FBMKLCI's 120-min intra-day chart as at Mar 13, 2013_11.30am (Source: Quickcharts)

Based on the above, I believe we should see the market rebound from 1643-1646 today.  

Tuesday, March 12, 2013

Success- an attractive stock

Result Update

For QE31/12/2012, Success's net profit dropped 5% q-o-q bur rose 36% y-o-y to RM8 million while revenue eased off 5% q-o-q or 2% y-o-y to RM76 million.


Table: Success's last 8 quarterly results


Chart 1: Success's last 23 quarterly results

Valuation

Success (closed at RM1.04 today) is now trading at a PE of 4.2 times (based on past 4 quarters' EPS of 25 sen). Price to book is about 0.6 time. All in all, Success is an attractive stock.

Technical Outlook

Success is now resting on its long-term uptrend line at RM1.00.


Chart 2: Success's weekly chart asat Mar 11, 2013 (Source: Quickcharts)

Conclusion

Based on good financial performance (albeit a slight q-o-q decline), attractive valuation and positive technical outlook (albeit unexciting performance), Success is rated a good stock for long-term performance.

Note:
In addition to the disclaimer in the preamble to my blog, I hereby confirm that I do not have any relevant interest in, or any interest in the acquisition or disposal of, Success

Daiman- a breakout, finally


Technical Breakout

Today, Daiman broke above its 2 years old 'horizontal resistance' at RM1.90 as well as the psychological RM2.00 mark. With this breakout, Daiman could rise to its next resistance at RM2.30 (or even the following resistance at RM2.60). See Chart 1 & 2 below.


Chart 1: Daiman's weekly chart as at Mar 12, 2013 (Source: Quickcharts)


Chart 2: Daiman's monthly chart as at Mar 11, 2013 (Source: Quickcharts)

Recent Financial Result

From the table below and the 22-quarter top-line & bottom-line chart below, we can see that Daiman is a profitable company with a slow albeit erratic growth. Throughout the past 5 years, its profit margin is fairly high at 25-30%. This high profit margin may be the limiting factor that restrained the growth of the company. It reminded me of a friend's comment when he resigned from his company, a listed property developer where he said that the boss is so obsessed with getting maximum profit margin that new launches are held back because prices are rising. Is Daiman's management like that?


Table: Daiman's last 8 quarterly results


Chart 1: Daiman's last 22 quarterly results

Valuation

Daiman (closed at RMRM2.03 today) is now trading at a PE of 9 times (based on last 4 quarters' EPS of 22.35 sen). At this multiple, Daiman is deemed fairly valued for a mid-size developer.

Conclsuion

Daiman is probably benefiting from the Johore property theme play. Based on techncial breakout, Daiman could be a good stock for a trading BUY.

Note:
In addition to the disclaimer in the preamble to my blog, I hereby confirm that I do not have any relevant interest in, or any interest in the acquisition or disposal of, Daiman.