Wednesday, September 30, 2009

Shanghai's SSEC index at the tipping point

Shanghai's SSEC index tested its medium-term uptrend line again yesterday (see Chart 1). As at 2.20am ET today, SSEC index was up 30.2 points (or, 1.1%). Will SSEC index recover from here on?


Chart 1: SSEC's daily chart as at 29/9/2009 (Source: Stockcharts.com)

A look at the weekly chart below revealed the following:
1. The 10-week SMA has curved downwards while the 20-week SMA is now flattening out.
2. The weekly MACD has done a negative cross-under.
3. RSI has pulled back significantly & is now below 50.
4. The -ve DMI is attempting to cross above the +ve DMI, which could signal the beginning of a new downtrend.

The last time we saw the congruence of the same signals was in November & December 2007, which was the top for SSEC. Can the same thing happen again? Yes, especially if SSEC index break below the 2700 level.


Chart 2: SSEC's daily chart as at 29/9/2009 (Source: Stockcharts.com)

Haio- the new King of MLM?

Haio has just announced a fantastic set of results for QE31/7/2009. Its net profit increased by 26% q-o-q or 36% y-o-y to RM18.5 million while turnover increased by 12% q-o-q or 32% y-o-y to RM149 million.


Table 1: Haio's 8 quarterly results

Haio's steady growth in both the top-line & bottom-line is clearly shown in the chart below. We can see that its turnover for QE31/7/2009 surpasses the previous high recorded in QE30/4/2008. Nevertheless, the record high net profit for QE30/4/2008 remained intact.


Chart 1: Haio's 18 quarterly results

Haio's latest results compared very favorably to the other two major listed MLM companies, Amway & Zhulian. In term of valuation, Haio has the lowest PE but Zhulian trades at a lower Price to Book. Over the last 4 quarters, Amway's pre-tax profit dropped from RM41.3 million in QE30/9/2008 to RM22.2 million in QE30/6/2009 while Zhulian's pre-tax profit also dropped from RM30.7 million in QE31/8/2008 to RM19.7 million in QE30/5/2009. Haio has seen its pre-tax profit increased from RM15.3 million in QE31/10/2008 to RM26.3 million in QE31/7/2009.


Table 2: Haio, Amway & Zhulian's latest quarterly results compared

Haio (traded at RM5.94 as at 11.00 am) is now trading at a PE of 8.7 times (based on last 4 quarters' EPS of 68 sen). For a well-managed company with a steady growth track record, Haio's valuation is undemanding. (Note: Haio's PE in Table 2 is based on the annualized EPS of 22.2 sen from the last quarterly results.)

Chartwise, Haio is in a long-term uptrend. Its upside seems to be capped by the line connecting its peaks. This "resistance" may again act to cap its current strong rally at about RM7.00-7.50.


Chart 2: Haio's weekly chart as at Sept 29, 2009 (Source: Quickcharts)

Based on improved financial performance & relatively attractive valuation, Haio remained a good stock for long-term investing.

Tuesday, September 29, 2009

Spritzr- a not-so fizzy stock

Background

Spritzer Bhd ('Spritzr') is involved in the manufacturing and distribution of natural mineral water, sparkling natural mineral water, distilled drinking water, carbonated fruit flavoured water, carbonated fruit flavour isotonic water, teas, toothbrushes, preforms and packaging bottles.

Recent Financial Results

Spritzr has announced its results for QE31/8/2009. Its net profit increased by 54% q-o-q or 29% y-o-y to RM3.1 million while turnover increased 11% both q-o-q & y-o-y to RM31.2 million.


Table 1: Spritzr's 8 quarterly results

Over the past 13 quarters, Spritzr's quarterly turnover has risen from RM19 million to RM31 million. Quarterly net profit has risen slowly from about RM1.0 million to above RM3.0 million. Due to the increased demand, Spritzr has announced plan to "set up a new bottling plant in Shah Alam to facilitate its supply of bottled water to Klang valley and central Malaysia. The new plant is expected to commence operations in the fourth quarter of the current financial year. The strategic location of this plant will enable the Group to reduce delivery cost and boost its sales tremendously". Spritzr has already signed a S&P agreement to acquire a piece of land in Shah Alam costing RM32.5 million for this purpose.


Chart 1: Spritzr's 13 quarterly results

Valuation

Spritzr (clsoed at RM0.685 yesterday) is now trading at a trailing PE of 10 times (based on last 4 quarterly EPS of 6.8 sen). However, Spritzr should command a higher PE multiple in view of its steady growth rate & low base. Assuming we used a PE multiple of 12 times, Spritzr's fair value is about 82 sen.

Technical Outlook


Spritzr has a strong price run-up after breaking above its downtrend line at RM0.45 in early 2008. In a matter of 15 months, it gained 66% to reach its July 2009 high of RM0.75. The share price may pull back after this rally. A good entry level is about RM0.60-65.


Chart 2: Spritzr's daily chart as at Sept 28, 2009 (Source: Tradesignum)

Conclusion

Based on steady financial performance & positive technical outlook, Spritzr is a good stock for long-term investing. Accumulate on weakness at RM0.60-65 level.

GCorp- a value stock

Background

General Corporation Bhd ('GCorp') is principally involved in construction, property development & investment, tyre manufacturing, shoe trading, confectionery manufacturing, hotel operation & quarrying. In the past few years, GCorp has benefited from strong contribution from its 52%-owned subsidiary, Low Keng Huat (Singapore) which experienced big jump in construction activities.

Recent Financial Results

GCorp has just announced its results for QE31/7/2009. Its net profit increased by 113% q-o-q or 438% y-o-y to RM24.5 million while turnover increased by 86% q-o-q or 134% y-o-y to RM418 million. The improved performance is attributable to increased contribution from Low Keng Huat (Singapore).


Table 1: GCorp's 8 quarterly results

I have appended below the chart of GCorp's top-line & bottom-line for the past 10 quarters which shows steady growth, except for a net loss attributable to the shareholders in QE31/1/2009 after netting off Minority Interest of RM21.2 million.


Chart 1: GCorp's 10 quarterly results

Valuation

GCorp (closed at RM1.10 at the end of the morning session) is now trading at PE of 8.1 times (based on last 4 quarters' EPS of 13.5 sen). As a mid-size diversified group with a good growth track record, GCorp deserves to be valued at a higher PE multiple, say 10-12 times. Assuming a PE multiple of 10 times, GCorp's fair value is about RM1.35.

The present market capitalization of GCorp is only RM327 million. This is derived at as follows: Outstanding share capital of 297.1 million units at RM1.10 per unit. Its 52%-stake in Low Keng Huat (Singapore) alone is worth RM343.5 million today. The present market capitalization of Low Keng Huat (Singapore) is S$269.7 million or RM660.7 million This is arrived at as follows: Outstanding share capital of 738.8 million units, valued at S$0.365 per unit and then converted to RM at an exchange rate of RM2.45:S$1.00. As such, GCorp is now trading at about the value of its stake in Low Keng Huat (Singapore), with no consideration given to its other businesses.

Technical Outlook

from the weekly chart below, we can see that GCorp has broken above its medium-term downtrend line at RM1.00 in July. Its immediate horizontal support is at RM1.10 while resistance is at RM1.20.


Chart 2: GCorp's weekly chart as at Sept 28, 2009 (Source: Quickcharts)

Conclusion

Based on steady financial performance, attractive valuation & positive technical outlook, GCorp is a good stock for medium-term investing.

Friday, September 25, 2009

Worrying sign of weakness in crude oil & transportation demand

In Naked Capitalism, you will find an interesting article entitled "Railroad Traffic Decline Accelerates". To wit:
One indicator of commercial activity is shipments, such as train and truck traffic.

Reader Marshall Auerback provided this sighting which shows that the decline in shipments is accelerating. Note that one of the general reasons for optimism is that many indicators are getting worse less quickly and some appear to be stabilizing.

Now this is merely a one-week shift and may be noise, but the change was pretty dramatic, and in the wrong direction. As Marshall noted:

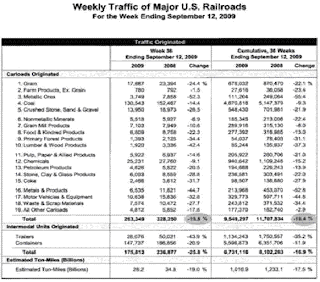
The latest data out of the Association of American Railroads has been released. While a month ago the weekly YoY decline hit a very troublesome -17.1%, the last weekly decline added another almost 3% to the deterioration, and is now down -19.8% for Week 36. Cumulative traffic decline is flat at -18.4%. Including intermodal traffic or ton-miles in the calculation does nothing to improve the conclusion. Not a single “carload originated” category has improved, and in fact even the relatively stable ones from the prior update have slumped.


Table: Weekly Traffic of Major US Railroads for week ending Sept 12, 2009 (Source: Naked Capitalism)

Another sign of the weakness in the real economy can be seen from the slide in the crude oil prices, which did not benefit at all from the weakness in the USD (unlike gold). From Chart 1 below, we can see that WTIC has broken below its 100-day SMA line yesterday.


Chart 1: WTIC's daily chart as at 24/9/2009 (Source: Stockcharts.com)

Finally, it is worth noting that BDI has broken below its short-term uptrend line (see Chart 2 below). While we have noted in an earlier post that the poor performance of BDI is partly attributable to the capacity glut, the breakdown of the uptrend line for BDI could signal slowdown in international trades & a possible relapse of the current timid economic recovery.


Chart 2: Baltic Drybulk Rates' daily chart as at September 24, 2009 (courtesy of Investment.tools.com)

Tanjong coming to its medium-term uptrend line

Tanjong is undergoing some correction after its failed attempt to challenge its recent high of RM16.00. Currently it is resting on its immediate uptrend line (S1S1) support at RM15.00. If this support failed, Tanjong might test its medium-term uptrend line (SS) support at RM14.50. It could also enjoy support from the horizontal line at RM14.60. However, a breakdown below RM14.50-60 could be very bearish for Tanjong.


Chart: Tanjong's daily chart as at Sept 25, 2009_3.38pm (Source: Quickcharts)

Notwithstanding the above, I believe Tanjong is not likely to go below the RM14.50-60 level. At that level, Tanjong will be a good trading & long-term BUY.

Thursday, September 24, 2009

Insas rallied. Can BJCorp & BJLand join in?

Insas has announced today that the Securities Commission has approved the admission of M&A Securities Sdn Bhd (“M&A”), its wholly-owned subsidiary, to the Approved List of Principal Advisers which will enable M&A to act as a principal adviser for initial public offerings, reverse take-overs, restructurings and all type of other corporate proposals except for those involving private debt securities, Islamic securities and structured products. Together with the existing stockbroking services, M&A is now poised to play a more active role in the Capital Market.

The corporate finance activities will further provide M&A with a new income stream which is in tandem with its plan to diversify its income base and signify the beginning of M&A’s transformation into a full-fledged financial services outfit of Insas.

Following this announcement, the share price of Insas broke to the upside of its triangle formation and rallied sharply. I have appended a composite chart showing the price movement of Insas & another two stocks controlled by Vincent Tan, i.e. BJCorp & BJLand which have achieved similar bullish breakouts, albeit without increased volume. Unlike Insas, there were also no significant announcement for the latter two stocks and the bullish breakout for these stocks could be coincidental. However, these three stocks have moved in tandem in the past & it is possible that they will do the same again. If the volume picked up for BJCorp & BJLand, they could turn out to good candidates for trading BUY.


Chart 1: Insas, BJCorp & BJLand's daily chart as at Sept 24, 2009 (Source: Quickcharts)

Ingress to test the strong resistance at RM0.90?

On September 17, Ingress announced that its 70% subsidiary, Ingress Technologies Sdn Bhd (ITSB) has won a RM196 million contract from Perodua Manufacturing Sdn Bhd (PMSB) for the supply of components comprising rear modules, door surrounding modules and fuel lids to PMSB for the new model starting in the first half of the financial year ending Jan 31, 2012, for five years. The investment in equipment and toolings for this project was estimated to total RM17.7 million.

Following the announcement, Ingress' share price broke to the upside of its symmetrical triangle formation at the RM0.40 on the same day. We still saw Ingress made a high of RM0.815 this morning- four days after the aforesaid announcement. How much profit can the PMSB project contribute? Based on a gross profit margin of 14% (as per its quarterly results for QE31/7/2009), we can expect a profit contribution of RM28 million over five years or RM5.6 million per annum. With generous tax incentive available, I believe that the whole amount could be added to the net profit; thus adding 7.3 sen to its EPS.

However, Ingress' results for FY2008 & FY2007 are fairly disappointing as it had recorded net losses of RM40 million & RM11 million, respectively. The huge net loss for FY2008 was attributable to write-down of RM45.6 million in the Automotive division due to a change in depreciation methods & impairment of tooling equipment in order to comply with FRS 108. In addition, its Other division also wrote off RM9.8 million for provision for bad debts & impairment of equipment. Ingress' 1H2010 results is more encouraging as it reported a net profit of RM3.5 million- giving a 6-mth EPS of 4.6 sen or a full-year EPS of 9.2 sen. Thus, Ingress (closed at RM0.81 at the end of the morning session) is now trading at PE of 8.8 times. This is fair value for stock in the Automotive sector. For example, Tan Chong which closed at RM2.10 this morning, is now trading at 9 times its annualized EPS 23.2 sen. Many would prefer Tan Chong to Ingress since they are both trading at the same PE multiple.


Chart 1: Ingress' daily chart as at Sept 24, 2009_11.00am (Source: Quickcharts)

From the weekly chart, Ingress' upside will be severely tested soon as it approaches the horizontal resistance at RM0.90 & thereafter at RM1.10 & RM1.30. It is advisable to take some profit at the RM0.90 level.


Chart 2: Ingress' weekly chart as at Sept 24, 2009_11.00am (Source: Quickcharts)

Friday, September 18, 2009

Selamat Hari Raya

I like to wish all Muslim readers a very Happy & Joyous Hari Raya Aidilfitri.

UMcca- watch closely

One of the best performing Plantation stocks over the past 12 months is United Malacca ('UMcca'). The stock made a low of RM4.62 in October 2008 before staging a strong rally to a high of RM8.55 in July this year. It has since corrected back to its accelerated uptrend line (S1S1) support at RM8.00. With the MACD now deep inside the negative territory & the 10-day SMA crossing under the 30-day SMA; UMcca may violate the immediate uptrend line. A break of this uptrend line could send the stock to its medium-term uptrend line (SS) with support at RM6.80-7.00.


Chart 1: UMcca's daily chart as at Sept 18, 2009 (Source: Quickcharts)

From the weekly chart, we can see that UMcca came close to its January 2008 high of RM8.65 recently. The on-going correction has seen the share price beginning to go below the 10-week SMA of RM8.00-8.10. Weekly MACD has also just hooked down.


Chart 2: UMcca's weekly chart as at Sept 18, 2009 (Source: Quickcharts)

Based on the above, you may want to avoid buying UMcca at the immediate uptrend line, S1S1. Instead, if UMcca were to violate this uptrend line, you may want to take profit on this stock. Buying can be considered at the uptrend line, SS. In view of the expected recovery in CPO prices in the next 1 or 2 week(s), UMcca may hold onto the current price level for now.

I have appended below the daily chart for CPO, where we can see the Parabolic SAR (short for 'stop-and-reversal' indicator) has moved below the CPO price (denoted as 'A'). This positive sign could signal the start of the rebound in CPO prices. In addition, we can see that the daily MACD has nearly hooked up (denoted as 'B'). The bullish divergence in the Slow Stochastics (denoted as 'C') was already noted in an earlier post.


Chart 3: CPO's daily chart as at Sept 18, 2009 (source: ifs.marketcenter.com)

Thursday, September 17, 2009

GLD-C1- a proxy for gold

Continued weakness in the USD as well as rumored buying by Chinese central bank have propelled gold above the USD1000 level again. This has led to major gold producers such as AngloGold Ashanti & Barrick Gold Corp. to further unwind fixed-price bullion contracts- a practice commonly referred to as de-hedging.

From Chart 1 below, we can see that gold has broken to the upside of the 'ABC' triangle & is now poised to challenge the horizontal line resistance at USD1000-1030. A convincing break above this level will be very bullish for gold. However, a failure to break above this level could set the stage for a bearish triple top reversal. This is a very interesting time for gold bug.


Chart 1: Gold's weekly chart as at Sept 16, 2009 (Source: SuperCharts by Imega Research)

One of the ETFs that invests in gold is SPDR Gold Trust ('GLD'). The chart for GLD is given below.


Chart 2: GLD's weekly chart as at Sept 16, 2009 (Source: Stockcharts.com)

For those who are interested to trade the possible breakout in gold & GLD, you do so by buying GLD-C1, a CW based on GLD. The main terms of GLD-C1 are:

1. Expiry Date: April 7, 2010
2. Exercise Ratio: 400-for-1
3. Exercise Price: USD88.50

GLD-C1 was issued at IPO price of RM0.15 and was quoted on our exchange on July 8 this year. Based on the closing price of GLD of USD99.91 [as at Sept 16] & GLD-C1 of RM0.17 [as at today, Sept 17] & an exchange rate of USD1=RM3.48, GLD-C1 is now trading at a premium of 8%. That's quite reasonable.


Chart 3: GLD-C1's daily chart as at Sept 17, 2009 (Source: Quickcharts)

In conclusion, you can consider a trading BUY on GLD-C1 if gold were to convincingly break above the USD1000-1030 level.

Wednesday, September 16, 2009

Proton to test its resistance of RM4.40-50 tomorrow

There are many rumors or reports surrounding Proton which may account for the current sharp rally in the share price. Among them are:
- Sale of Khazanah's stake in Proton to a Malaysian businessman (Syed Mokhtar?)
- Sale of the same stake to a foreign carmaker (VW?)
- More technical tie-up between Proton & foreign carmakers

The third possibility is an on-going development & is unlikely to have any significant impact on Proton's immediate performance and as such is unlikely to account for its recent sharp share price movement. In my opinion, no carmaker will be interested in acquiring a stake in Proton given the weakness in the global car market presently as well as Khazanah's refusal to relinquish management control over Proton. So, the only likely possibility is the sale of Proton to a Malaysian businessman (whoever he maybe) and I doubt anyone can do a turnaround in Proton, strictly as a commercial enterprise. That person will hope to land the Proton stake for a song; ask for & probably get more protection against foreign competition as well as more subsidies; own & manage for a few years what looks like a profitable automaker; and sell off the stake for a profit in the next up-cycle in the car market. In the end, the Malaysian motorists & taxpayers will continue to be the losers in the whole scheme of things. A sad story, indeed.

From technical perspective, this is what we can expect from Proton the stock. We can expect the recent share price to face resistance soon at the horizontal line of RM4.40-50 & thereafter from the downtrend line & horizontal line at RM5.00. I think the latter will be a major stumbling block & would be a good level for some profit-taking.


Chart: Proton's weekly chart as at Sept 16, 2009 (Source: Quickcharts)

CPO may be due for a rebound

In mid-August, I expected the correction in CPO prices to be relatively mild, probably well supported at RM2300-2350 levels (go here). I was proven wrong when CPO prices hit the RM2100 level on Monday. Nevertheless, the Slow Stochastics indicator is flashing a bullish divergence, just like in early July. Back then, we saw the bullish divergence and then a bullish MACD hook-up. Thereafter, CPO prices enjoyed a decent rally from RM2000 to RM2500. So, look out for some recovery in CPO prices & a bullish MACD hook-up over the next few days.


Chart: CPO's daily chart as at Sepy 16, 2009_3.00pm (Source: ifs.marketcenter.com)

A rally in CPO prices would be positive for plantation stocks. Among them, I like IOI, Genting Plant & IJM Plant.

Note: As at 3.00pm, CPO October futures are trading at RM2200 (up RM51).

Tuesday, September 15, 2009

When the Music plays on...

Jeffrey Saut is still cautiously bullish in his latest market outlook write-up which is strangely entitled "When the Music stops". He addressed the concern of an investor who wrote in to ask whether we are headed for another October 1987. To wit:
Speaking to the stock market, we have, and continue, to argue that at the March 2009 “lows” stocks were three to four standard deviations below “norms;” and that all we have done is rally back to normalized valuations. Given the severity of the 17-month decline (October 2007 to March 2009), there is no reason why the equity markets can’t rally to one, or two, standard deviations above “norms.” Moreover, stocks don’t necessarily need outsized economic growth to rally. All they need is growth. As our friends at the consummate GaveKal organization, whose service we highly recommend, note:

“The reality is that equity markets do not need high growth to thrive – they just need some growth. In fact, one could argue that a low-growth environment is preferable to one of stellar growth, since low growth is often accompanied by low interest rates and plentiful liquidity. Today, this is the environment which we will likely face for years to come. The latest Beige Book does a good job of summing up this story: the quarterly Fed survey reported that wage and price pressures were non-existent, that retail spending is lackluster in most areas, and that manufacturing activity has moderately improved. This will likely be the story for the foreseeable future. Consumers and banks will remain cautious, but interest rates will stay low, allowing for a gradual recovery in output. This is an ideal environment for corporate profit growth and also helps to explain why equities keep creeping higher.”

His conclusion:
Our answer to this dilemma, in the current environment, is to scale “buy” into large-cap, dividend-paying, stocks. Manifestly, stock returns are a function of corporate earnings, the price-to-earnings ratio investors are willing to pay for said earnings, and the dividends they receive over time from those stock investments. That’s all you really need to know about the stock market!

His recommendation- scale “buy” into large-cap, dividend-paying, stocks- could also explain why our out-performers column has been dominated by blue chips, lately.

BDI & the Ghost Fleet

Mike "Mish" Shedlock from the blog, Mish's Global Economic Trend Analysis has picked up an interesting article entitled "The ghost fleet of the recession" from Mail Online.
The biggest and most secretive gathering of ships in maritime history lies at anchor east of Singapore. Never before photographed, it is bigger than the U.S. and British navies combined but has no crew, no cargo and no destination - and is why your Christmas stocking may be on the light side this year.

Just 12 months ago, financiers and brokers were enjoying fat bonuses as they traded cargo space. But nobody wants the space any more, and those that still need to ship goods across the world are demanding vast reductions in price.

Do not tell these men and women about green shoots of recovery. As Briton Tim Huxley, one of Asia's leading ship brokers, says, if the world is really pulling itself out of recession, then all these idle ships should be back on the move.

‘This is the time of year when everyone is doing all the Christmas stuff,' he points out.

'A couple of years ago those ships would have been steaming back and forth, going at full speed. But now you've got something like 12 per cent of the world's container ships doing nothing.'

This time last year, an Aframax tanker capable of carrying 80,000 tons of cargo would cost £31,000 a day ($50,000). Now it is about £3,400 ($5,500).

Via, Mish's Global Economics Trend Analysis (link)


The 'ghost fleet' near Singapore. The world's ship owners and government economists would prefer you not to see this symbol of the depths of the plague still crippling the world's economies


750ft-long merchant vessel is standing absurdly high in the water. The low waves don't even bother the lowest mark on its Plimsoll line. It's the same with all the ships parked here, and there are a lot of them. Close to 500. An armada of freighters with no cargo, no crew, and without a destination between them.

The above certainly explained why the Baltic Drybulk Index has been drifting lower for the past 2 months.

Friday, September 11, 2009

KFima- a good stock for trading & long-term investing

Background

Kumpulan Fima Berhad ('KFima') is an investment holding company with subsidiaries involved in producing and trading security and confidential documents; operating estate, cattle farming, manufacturing and packaging food products; providing bulk handling and storage of liquid products and cargoes, warehousing and transportation and customs forwarding services, international trading, investment holdings and management of commercial properties.

Recent Financial Results


KFima's net profit increased by 9.1% q-o-q or 85.0% y-o-y to RM18.5 million while turnover increased by 21.0% q-o-q or 0.5% y-o-y to RM92.7 million. The detailed financial statement which was attached to the August 20, 2009 results announcement is displaying an error message. Without the benefit of looking at the detailed financial statement, it is hard to gauge what might have brought about the improved bottom-line. I believe that the improved performance is the results of better CPO prices. KFima's pre-tax profit has also benefited from capital gain of RM5.25 million from the disposal of Banding Island Resort (Source: Business Week).


Table 1: KFima's 8 quarterly results

A look at KFima's last 16 quarterly results shows steady growth in its bottom-line. Top-line dropped back significantly in QE31/3/2009 but this has stabilized in QE30/6/2009.


Chart 1: KFima's 16 quarterly results

Valuation


KFima (closed at RM0.765 as at September 11) is now trailing trading at a PE of 4.3 times (based on EPS of 18 sen, excluding the capital gain of RM5.25 million from the disposal of Banding Island Resort in QE30/6/2009). Price to book is at 0.6 times (based on NTA per share of RM1.37 as at 30/6/2009). At these multiples, KFima appears very attractive.

Other Information


KFima is one of 8 companies in Malaysia that made it to Forbes' Asia Top 200 Best Companies with Turnover of Under USD1 billion. For more, go here.

Technical Outlook

KFima is rising in a short-term uptrend line since March this year. The share price has been consolidating in a descending triangle pattern for the past 6-7 weeks. On Friday, it appeared to have achieved an upside breakout at RM0.76-77, but it closed at the breakout level of RM0.765. If the stock can recruit further buying support in the days ahead, the breakout could lead to a good rally to RM0.90-1.00.


Chart 2: KFima's daily chart as at Sept 11, 2009 (Source: Quickcharts)


Chart 3: KFima's monthly chart as at Sept 11, 2009 (Source: Quickcharts)

Conclusion

Based on good financial performance, attractive valuation & potential bullish technical breakout, KFima could be a good stock for both a trading Buy and a long-term Buy.

BToto- Proposed Dividend of 49.5 sen already paid out

BToto has recently announced its results for 1Q2010 ended 31/7/2009. Its net profit increased by 8.6% to RM100.4 million from RM92.4 million in 1Q2009. Turnover remained unchanged at RM826 million. What attracted investors' attention was the eye-popping proposed dividend of 49.5 sen (see Diagram 1 below).


Diagram 1: BToto's results announcement for 1Q2010

If you look into its financial statement, you can see the proposed dividend was reflected in its Profit & Loss Account (see Diagram 2 below) but it was not shown in the Current Liabilities section of the Balance Sheet (see Diagram 3 below).


Diagram 2: Relevant section of BToto's Profit & Loss Account for 1Q2010


Diagram 3: Relevant section of BToto's Balance Sheet as at 31/7/2009

On further checking, it seems that there was another dividend payout- consisting of cash dividend & share dividend- in July that is exactly the same of the proposed dividend (go here). The entitlement date of the earlier dividend was July 15, with the cash dividend paid on July 27 & the share dividend credited to the shareholder's account "within ten (10) market days from the Entitlement Date".

Is there an error in the results announcement? I have just confirmed with the registrar that the so-called proposed dividend is indeed the same dividend that was paid out or credited in July. DON'T EXPECT TO RECEIVE ANY DIVIDEND OF 49.5 SEN ANYTIME SOON. Please be guided accordingly.

Wednesday, September 09, 2009

Market Outlook as at September 9, 2009

Yesterday, the KLCI surpassed its recent high of 1196 recorded on August 14. Earlier today, correction took place resulting in a small drop in the KLCI to 1196 (a loss of 5.6 points). Despite today's market action, it is quite clear that our market consolidation of the past 3 weeks is now over & the market is continuing with its uptrend. The three indicators are pointing to further upside for KLCI over the next 2-3 weeks. If we assume that the KLCI will move within an upward channel, then the upper boundary which may cap its upside is at 1270-80.


Chart 1: KLCI's daily chart as at Sept 9, 2009 (Source: Quickcharts)

The weekly MACD is struggling to avoid a bearish hook-down (denoted as 'A'). In the past 2 occasions when we saw these signals (denoted as 'B' & 'C'), we were faced with rude surprises when the market hit us with a sharp sell-off. Can the same happen again? Nobody can tell. We can see that the next horizontal resistance is about 1280-1300.


Chart 2: KLCI's weekly chart as at Sept 9, 2009 (Source: Quickcharts)

For now, we can say that the market may be favorable for the next 2-3 weeks & the upside is about 1270-1300.

Monday, September 07, 2009

GENS-C1- Do you feel lucky today?

CIMB has issued a call warrant (CW) based on Genting Singapore PLC ('Genting SP') which is called GENS-C1. The main terms of GENS-C1 are:

1. Expiry Date: September 2, 2010
2. Exercise Ratio: 3-for-1
3. Exercise Price: S$0.98

GENS-C1 was issued at IPO price of RM0.15 and was quoted on the exchange on Friday, September 4. It gained RM0.135 or 90% on its first trading day. GENS-C1 closed at RM0.375 in the morning session today- gaining RM0.09 or 31.6%. Genting SP is trading at S$1.17 presently. Based on these prices & an exchange rate of S$1=RM2.46, GENS-C1 is now trading at a premium of 23%. The buyers must be very confident that Genting SP will successfully break above its 2007 high of S$1.20 (see my earlier post). I think it is not wise to pay premium above 15% for any CW, especially one which could fail to break above a strong technical resistance. AVOID GENS-C1.

Friday, September 04, 2009

NTPM- still good for long-term investing

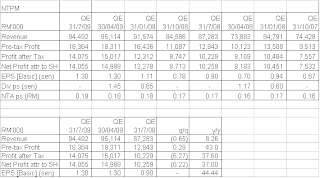
NTPM announced its results for the 1Q2010 ended 1/7/2009. Its net profit increased by 37.0% y-o-y to RM14.1 million on the back of 8.3%-increase in turnover to RM94.5 million. Nevertheless, its net profit dropped by 6.2% sequentially while turnover was marginally lower by 0.6%.


Table 1: NTPM's 8 quarterly results

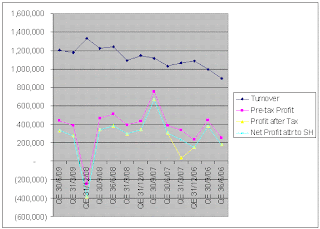
From Chart 1 below, we can see NTPM's strong growth in both its top-line & bottom-line for the past 4 years.


Chart 1: NTPM's 16 quarterly results

NTPM (closed at RM0.605 yesterday) is now trading at a PE of 11.6 times (based on annualized 1Q2010 EPS of 1.3 sen). With growth averaging about 15% over the past 3 years, NTPM's Price/Earnings To Growth ('PEG') ratio is about 0.63 times. A PEG ratio of less than 1 means that the stock is attractive.
PEG ratio = PE / (Growth Estimate + Dividend Yield)
= 11.6 / (15 + 3.5)
= 0.63 times

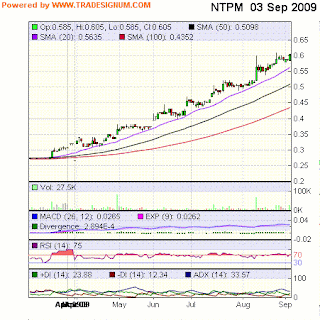
Since the technical breakout in March 2009, NTPM has doubled (see Chart 2 & 3 below). Trend-follower may jump on board when NTPM's share price pulled back to its 20-day SMA (presently at RM0.56).


Chart 2: NTPM's daily chart as at Sept 3, 2009 (Source: Tradesignum)


Chart 3: NTPM's daily chart as at Sept 3, 2009 (Source: Tradesignum)

Based on continued strong performance, attractive valuation & positive technical outlook, NTPM is still a good stock for long-term investing.

Thursday, September 03, 2009

Genting SP- time for some profit-taking

In April this year, I recommended readers to look at Genting Singapore PLC ('Genting SP') [go here]. Back then, it was known as Genting International PLC, an integrated resorts development specialist, involved in developing, operating and marketing of casinos and integrated resorts in Malaysia, Australia, the Americas, the Philippines and the United Kingdom (“UK”). The Group has casino properties under UK-based Genting Stanley and is currently developing Resorts World at Sentosa, the integrated resort in Sentosa, Singapore.

The reason for my recommendation was Genting SP had "broken above its very strong horizontal resistance at S$0.47-48 as well as its medium-term downtrend line resistance at about S$0.48." As at end of the morning session today, Genting SP closed at S$1.14 (gaining 7 cent from yesterday). From the chart below, we can see that Genting SP is nearing its January 2007 high of S$1.20- a natural resistance for the stock. If it can break above the S$1.20 level, Genting SP's uptrend can continue.


Chart: Genting SP's weekly chart as at Sept 2, 2009 (source: Yahoo Finance)

Despite the above technical comment, I think this is a good level to take some profit on the stock.

GENM- the casino in our backyard

"A bird in the hand is worth two in the bush."

Genting Malaysia Bhd ('GENM') has been ignored with all attention now focused on Genting Singapore PLC ('Genting SP'). Despite a better set of results for 2Q2009 ended 30/6/2009, the share price has dropped off from its recent high.

For 2Q2009, its net profit increased sequentially by 20.0% to RM330.5 million while turnover increased by 2.3%. The disproportionately bigger increase in net profit was due to better performance in the leisure & hospitality segment; gain on sale of investment of RM15.8 million; and receding quarter's impairment loss of RM30.4 million. Compared to 2Q2008, net profit was lower by 14.0% while turnover was lower by 3.1%. The disproportionately bigger drop in net profit was attributed to weaker luck factor in the premium players business & lower interest income.


Table 1: GENM's 8 quarterly results


Chart 1: GENM's 13 quarterly results

GENM (closed at RM2.72 yesterday) is now trading at a PE of 12.8 times (based on annualized 1H2009 EPS of 10.59 sen). If we valued GENM at a PE of 15 times, then its fair value is about RM3.18- giving a moderate upside of 17%.

From 2004 until today, GENM's share price has been rising in a gradual uptrend, SS. The uptrend accelerated from end 2006 to mid-2007 (with the accelerated uptrend line denoted as S1S1). S1S1 was unsustainable & correction set in late 2007. The share price drifted lower under the downtrend line, RR. That downtrend accelerated into R1R1 in early 2008. R1R1 broke through the long-term uptrend line, SS. In late 2008, GENM broke above R1R1 and rallied upward until it hit the resistance posed by RR. The last 6 weeks' correction resulted from that unsuccessful attempt on RR. GENM's share price should be well supported by the long-term uptrend line, SS at RM2.70. If GENM can break above the downtrend line, RR at RM2.90 on its next attempt, I expect GENM's share price to rally strongly.


Chart 2: GENM's weekly chart as at Sept 2, 2009 (Source: Quickcharts)

In conclusion, we should not ignore the proven casino in our own backyard. Based on improving performance & reasonably attractive valuation, GENM could surprise on the upside.

Wednesday, September 02, 2009

BDI, WTIC, CRB & TNX point to softening in real economy

A look at shipping rates, commodity prices and interest rates indicates that global economy may be softening. Shipping rates as reflected by the Baltic Drybulk Index ('BDI') has retreated back to its tentative uptrend line (see Chart 1).


Chart 1: Baltic Drybulk Rates' daily chart as at September 1, 2009 (courtesy of Investment.tools.com)

A slowing economy will see a drop in crude oil consumption, leading to a drop in crude oil prices. From Chart 2, we can see that the uptrend in WTIC is weakening with the recent high of USD75 ('C') only marginally higher than the preceding high of USD74.50 ('B'). If the current correction lead to a low that is lower than the recent low of USD59 ('Y'), then the uptrend in WTIC will be in doubt.


Chart 2: WTIC's daily chart as at 1/9/2009 (Source: Stockcharts.com)

Like WTIC, CRB- an index for the broader commodity markets- is also showing signs of weakening. Its recent high ('C') is only marginally higher than the preceding high ('B'). See Chart 3 below.


Chart 3: CRB's daily chart as at 1/9/2009 (Source: Stockcharts.com)

With ample liquidity in the market & economy, high inflation is something that central bankers & bond traders have to look out for. The recent weakness in the 10-year Treasury Notes ('TNX') indicates that this fear of high inflation may be receding. From Chart 4, we can see that TNX has broken below its uptrend line, be it S1S1 or SS. I have presented the 3 years' weekly chart of DJIA & TNX (overlaid with 10-week, 20-week & 50-week SMA) as Chart 5. We can see that in the last 2 occasions when the 10-week SMA cut below the 20-week & 50-week SMA ('A' & 'B'), the DJIA followed with correction. Presently, the 10-week SMA is hooking downward & looks set to cut below the 20-week SMA ('C'). Could this lead to another correction in DJIA?


Chart 4: TNX's daily chart as at 1/9/2009 (Source: Stockcharts.com)


Chart 5: DJIA & TNX's weekly chart as at 1/9/2009 (Source: Stockcharts.com)

Based on the above, we have to be more cautious in our investment stance.