Friday, September 21, 2012

Genm- dragged down by Genting

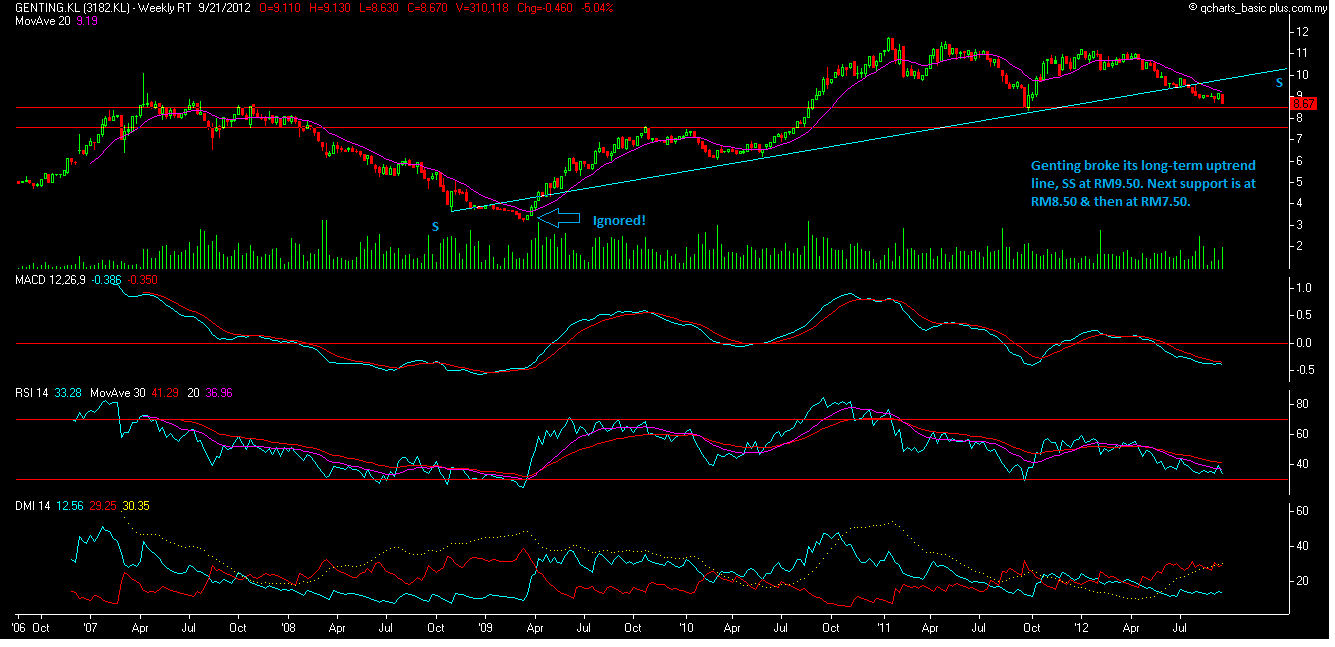
In August, I posted about a negative signal in Genting- the cross-under of the 20-month SMA line by the 10-month SMA line- that could lead to a prolonged downtrend for that stock. Genting is now trading at RM8.60- lower than the low of RM8.70 recorded on September 6. This means that Genting's slide is likely to continue.

The sell-off in Genting has even affected the performance of Genm. That stock broke above its intermediate downtrend line last week and in the past 3 days, Genm has almost surrendered all its gain. It will soon test its long-term uptrend line at RM3.35.


 Chart 1: Genting's weekly chart as at Sep 21, 2012_4.00pm (Source: Quickcharts)

 
 Chart 2: Genm's weekly chart as at Sep 21, 2012_4.00pm (Source: Quickcharts)

In fact, if you look through the names of the losers, they are the who's who of our exchange. These heavyweights, which had featured prominently among the gainers for the past few months, are now under selling pressure. I fear that we are about to see a price top in the market. A price top follows a momentum top in the market. After a price top, the market is ripe for a prolonged decline.

Note:
In addition to the disclaimer in the preamble to my blog, I hereby confirm that I do not have any relevant interest in, or any interest in the acquisition or disposal of, Genting & Genm.

Harison to test its uptrend line

Malaysian Custom has issued Harison with a 14 days' notice to settle alleged unpaid duties and sales tax or face legal action. With this issue returning to the forefront, Harison will encounter selling pressure. Technically speaking, Hariosn is still in an uptrend line. If it breaks the uptrend line support at RM3.00, the next support levels will be at the horizontal lines at RM2.70, RM2.40 & RM2.10.


Chart: Harison's weekly chart as at September 20, 2012 (Source: Quckcharts)

Note:
In addition to the disclaimer in the preamble to my blog, I hereby confirm that I do not have any relevant interest in, or any interest in the acquisition or disposal of, Harison.

Thursday, September 20, 2012

Haio- top-line dropped but bottom-line improved

Results Update

For QE31/7/2012, Haio's net profit increased by 12% q-o-q or 33% y-o-y to RM10.3 million while revenue was up 20% y-o-y but dropped by 12% q-o-q to RM61 million. All 3 divisions- MLM, Wholesale & Retails- suffered a q-o-q drop in revenue. Unlike the other 2 divisions, the wholesale division experienced increased pre-tax profit due to lower operating expenses and higher profit margin from sale of patented medicine products & duty-free items.


Table 1: Haio's last 8 quarterly results

Chart 1: Haio's last 30 quarterly results

Valuation

Haio (closed at RM2.02 yesterday) is now trading at a PE of 11 times (based on last 4 quarters' EPS of 18.26 sen). At this PE multiple, Haio is deemed fully valued.

Technical Outlook

Haio will likely to continue to trade sideway between RM1.90 & RM2.10. Beyond that, it will encounter support at RM1.75 & resistance at RM2.35.

Chart 2: Haio's weekly chart as at Sept 19, 2012 (Source: Tradesignum)

Conclusion

Based on fully valuation & unexciting technical outlook, I would rate Haio a HOLD.

Note:
In addition to the disclaimer in the preamble to my blog, I hereby confirm that I do not have any relevant interest in, or any interest in the acquisition or disposal of, Haio.

Market Outlook as at September 20, 2012

FBMKLCI broke its 50-day Exponential Moving Average (EMA) line at 1630 this afternoon. Its next support is likely to be the intermediate uptrend line, SS at 1605. The next support would be the psychological 1600 mark.


Chart 1: FBMKLCI's daily chart as at September 20, 2012_12.00pm (Source: Quickcharts)

If FBMKLCI breaks the psychological 1600 mark, the index may test the 50-week EMA line at 1576. The long-term uptrend line support, S1-S1 is at 1475-1480.


Chart 2: FBMKLCI's weekly chart as at September 20, 2012_12.00pm (Source: Quickcharts)

We will have to wait & see where this correction will terminate. I believe it will probably end at 1600-1605 level before recovery kicks in.

FB- the recovery begins


Facebook (Code: FB) has broken above its downtrend line at USD21.50 last Friday. Yesterday, it broke above its horizontal line USD22.50. With this latest upside breakout, FB is poised to close the gap at USD26.80.

With the breakout of the downtrend line, we are likely to have seen the worst in the selldown in FB. Those looking to invest in this stock can slowly gain entry at the horizontal line USD22.50 (if possible). Those, with higher risk appetite, can consider a trade on the assumption that the stock is set for a rally to close the gap (as mentioned above).


Chart: FB's daily chart as at September 19, 2012 (source: Stockcharts)

Note:
In addition to the disclaimer in the preamble to my blog, I hereby confirm that I do not have any relevant interest in, or any interest in the acquisition or disposal of, FB.

Wednesday, September 19, 2012

Japanese central bank announced QE measure


First, ECB announced Outright Monetary transaction (OMT), the unlimited bbuying of 3-year bonds issued by Eurozone peripheral states. Next, Fed chimed in with QE3or as one analyst called it- the Unlimited QE, where Fed will buy bonds until the labor market improves "substantially." At a press conference, Bernanke clarified that the Fed’s “response to economic conditions might be one way in which we could further provide accommodation”; thus signaling that the Fed may adopt even more aggressive measures along the lines of the Evans 7/3 rule or even a nominal GDP target. The Evans 7/3 rule is simply: The Fed won't stop easing until unemployment is at 7% or core inflation is at 3%. And a nominal GDP target is just that, a target for the total size of GDP, something that can be achieved by either raw growth or inflation. (For more on this, go here).


Now, Japanese central bank announced a new JPY10 trillion QE program to prod up its slowing economy. While slower economic growth may be the main reason for the latest QE move by the Japanese central bank but I feel that it could also be driven by the need to suppress any rise of JPY via-a-vis USD & Euro. Are we seeing the start of a beggar thy neighbor policy to devalue the currency to get greater share (or to retain share) of the export market?

This QE measure by the Japanese caused a 1.19-jump in Nikkei today to close at 9232. From the chart below, we can see the index can swing all the way to 10000 if it can surpass the horizontal resistance at 9250.


Chart: Nikkei's weekly chart as at Sept 18, 2012 (Source: Stockcharts)

Cocolnd broke above its horizontal resistance at RM2.45

Background

Cocoaland Holdings Berhad (Cocolnd) is involved in the manufacturing and trading of processed and preserved foods and other related foodstuffs. Its products include candy, canister, cookies, drinks, gummy, hamper, juice, pudding and jelly, snack and wafer.

It is an associate company of Fraser & Neave Holdings Bhd (F&N). F&N acquired a 23%-stake in Cocolnd in 2010 for RM54.6 million (or RM1.38 per share). F&N's CEO explained that the acquisition "provides it with a strategic and synergistic foothold to advance its aspirations to create a regional, world-class food and beverage enterprise". (Note: The stake in Cocolnd owned by F&N has since increased to 27.2%.)


Latest Corporate Development

As Thai Beverage Public Company Ltd ('ThaiBev') has acquired a 30.36%-stake in Fraser & Neave Ltd in Singapore- which in turn owns 56.3% of F&N- ThaiBev is now deemed to have interest in Cocolnd. There are many reports that raised the possibility of ThaiBev making a conditional GO for Cocolnd but I personally do not think this will happen.

Recent Financial Results

The latest quarterly results shows Cocolnd has done very well for 1st half FY2012. For QE30/6/2012, its net profit increased by 48% q-o-q or 73% y-o-y to RM7.3 million while revenue increased by 13% q-o-q or 35% y-o-y to RM58.8 million.


Table 1: Cocolnd's last 8 quarterly results

We can see from Chart 1 below that Cocolnd's top-line & bottom-line have been rising steadily since early 2011. Its profit margin bottomed in QE30/6/2010 & has been recovering steadily.


Chart 1: Cocolnd's last 18 quarterly results

Financial Position

Cocolnd's financial position is deemed healthy. As at 30/6/2012, its Current Ratio stood at 3.8 times, with no borrowings and a cash reserves RM43 million (or,  cash backing of RM0.23 per share).

Valuation

Cocolnd (closed at RM2.46 yesterday) is now trading at a PE of 17.7 times (based on last 4 quarters' EPS of 13.91 sen). At this PE, Cocolnd is deemed fully valued.

A recent CIMB report rated Cocolnd as underperform with a target price of only RM1.84 (here)

Technical Outlook

Cocolnd broke above its intermediate downtrend line, R1-R1 at RM2.20 at the beginning of 2012. Since then, its upside has been capped by the horizontal line at RM2.45. Today, it broke above the horizontal resistance of RM2.45. This means the stock could revisit its recent high at RM3.10.

 
Chart 2: Coclnd's weekly chart as at Sept 14, 2012 (Source: Tradesignum)

Conclusion

Based on good financial performance, healthy financial position & its exposure to the consumer sector, Cocolnd could be a good stock for long-term investment. Its bullish technical outlook could make the case for a trading BUY for the stock but we have to be careful as the stock is now overvalued & the current rally could be brought on by expectation of a GO from ThaiBev, which is not very likely.


Note:
In addition to the disclaimer in the preamble to my blog, I hereby confirm that I do not have any relevant interest in, or any interest in the acquisition or disposal of, Cocolnd.

Tuesday, September 18, 2012

CPO- the slide continued


CPO broke below the horizontal support of RM2800 today (see Chart 1). This breakdown was not due to a last-minute selldown. The breakdown happened at the start of the morning trading and it went as low as RM2683 before it rebounded to close at RM2714 (see Chart 2). CPO's immediate support levels are at the horizontal line at RM2700 & then at RM2400.


Chart 1: CPO's daily chart as at September 18, 2012 (Source: iFS.marketcenter.com)


Chart 2: CPO's 30-min intra-day chart as at September 18, 2012 (Source: iFS.marketcenter.com)

The continued slide in CPO (after the breaking below its long-term uptrend line) should be followed by similar breakdown in the Plantation index. Looking at Chart 3 below, the immediate support for the Plantation index is at 8000 but the stronger support is at 6500-7000. If this index drops to the 7000 mark, this would translate to a drop of 12-13% for plantation stocks.


Chart 3: Plantation index's weekly chart as at September 18, 2012 (Source: tradesignum)

Friday, September 14, 2012

US markets charging higher!

Recently, I wrote that US & European markets are pressing against strong horizontal resistance (here). That was based on a look at the charts for DJIA & EUR, the index for European Top 100 stocks.

If you look at the same charts yesterday, you will see that DJIA has broken above the strong horizontal resistance at 13300 (see Chart 1). Similar upside breakout of recent high were also witnessed in other major US indices, such as S&P500 & Nasdaq (see Chart 2 & 3). EUR has yet to break above the 230 level (see Chart 4). The relative weakness of EUR belied the strength of the German DAX, which broke above its strong horizontal resistance at 7200 (see Chart 5).

With these upside breakout, US & German stock markets are expected to rise further. The relative strength of the US markets via-a-vis the European markets was contrary to my expectation.


Chart 1: DJIA's daily chart as at Sep 13, 2012 (Source: Stockcharts)


Chart 2: Nasdaq's daily chart as at Sep 13, 2012 (Source: Stockcharts)


Chart 3: S&P500's daily chart as at Sep 13, 2012 (Source: Stockcharts)


Chart 4: EUR's daily chart as at Sep 13, 2012 (Source: Stockcharts)


Chart 5: DAX's daily chart as at Sep 13, 2012 (Source: Stockcharts)

GENM broke above its downtrend line


GENM broke above its downtrend line at RM3.55. In the past, an upside breakout had been followed by a gain of 40 sen over 1-2 months. Based on this breakout, GENM could be a good trading BUY.


Chart: GENM's daily chart as at September 14, 2012_10.10am (Source: quickcharts)

Note:
In addition to the disclaimer in the preamble to my blog, I hereby confirm that I do not have any relevant interest in, or any interest in the acquisition or disposal of, GENM.

CIMB did a V-spike recovery


What a drop! What a rebound! CIMB which broke its intermediate uptrend line recently and did a volte-face and rebound above the uptrend line. It made an intraday high of RM7.73- just 2 sen shy off nearly the strong horizontal resistance at RM7.75.


Chart: CIMB's daily chart as at September 14, 2012_9.45am (source: Quickcharts)

The sharp rebound cannot continue for long. Those who went 'contrarian' and bought at the low price, should consider taking some profit near the strong horizontal resistance of RM7.75. Those who missed buying at the low, should wait for a pullback to the uptrend line support at RM7.50.

Note:
In addition to the disclaimer in the preamble to my blog, I hereby confirm that I do not have any relevant interest in, or any interest in the acquisition or disposal of, CIMB.

Thursday, September 13, 2012

Airasia hit an air pocket!

Airasia plummeted in the past 3-4 days from RM3.40 to an intraday low of RM2.82. The sharp drop was prompted by concern that the new LCC, Malindo could be a threat to its operation. In my opinion, any LCC will take away some business from Airasia. However, we have seen many rivals folded up or struggling to breakeven in this cut-throat business. As such, the selldown in Airasia is excessive, bordering on irrational or emotional.

Technically speaking, Airasia has broken its uptrend line, SS which stretched back to March 2011. That breakdown happened in late August at the RM3.50 level. The past 4-day selldown is excessive in two areas:
1. The volume is equal to that registered in the selldown in August 2011 (denoted as 'A'). Such huge volume would create a vacuum, which allows an opposite move to take place.
2. The drop was also excessive in that the indicators, such as MACD, RSI & ADX, all went plunged sharply. Again, we can see that the last time these indicators moved to such extreme (in September 2011), the stock then enjoyed a rebound (denoted as 'B').

Based on these two reasons, I believe that Airasia could be set for a rebound. The rebound could bring the stock back up to RM3.20-3.30.


Chart: Airasia's daily cahrt as at September 13, 2012_3.00pm (Source: Quickcharts)

Note:
In addition to the disclaimer in the preamble to my blog, I hereby confirm that I do not have any relevant interest in, or any interest in the acquisition or disposal of, Airasia.

Tuesday, September 11, 2012

Eurozone on the mend?


The recently announced bond-buying plan by ECB (simply called OMT) and the long-awaited announcement of the next phase of unconventional monetary policies by the Fed (simply called QE3) have resulted in a rally in precious metals, such as gold & silver. We can see from Chart 1 below that gold has broken above its descending triangle at USD1670. From Chart 2 below, we can see that silver has broken above its 18-month downtrend line at USD32. The upside breakout in gold prices could signal the continuation of the prior uptrend; thus, a good trading BUY on gold.


Chart 1: Gold's weekly chart as at Sep 10, 2012 (Source: Stockcharts)


Chart 2: Silver's weekly chart as at Sep 10, 2012 (Source: Stockcharts)

When you compared DJIA and the Top100 European stock (as represented by EUR Index), you can see that the upside on US stocks is limited unless the index can break above the strong horizontal resistance at 13300. On the other hand, EUR has broken above the 18-month downtrend line at 220- which may signal the end of the intermediate downtrend. If EUR can break above the strong horizontal resistance at 230, this index could start on its upleg. While both US & European stocks need to overcome strong resistance, the fact that US stocks are trading near its recent high while European stocks are recovering after a sharp drop, would mean that European stocks could present better investment opportunity for investors. See Chart 3 & 4 below.


Chart 3: DJIA's weekly chart as at Sep 10, 2012 (Source: Stockcharts)


Chart 4; EUR's weekly chart as at Sep 10, 2012 (Source: Stockcharts)

Finally, I have appended below the charts for USD & EURO. When Eurozone problem was at its height, investors shifted from EURO to USD. We can see the uptrend in USD & the downtrend in EURO. Over the past 6-7 weeks, these currencies had corrected substantially. We can see that USD had broken below its uptrend line while EURO had broken above its downtrend line. As the European nations re-commit themselves to EU to resolve the Eurozone problem, I expect EURO to continue to strengthen.


Chart 5: USD's weekly chart as at Sep 10, 2012 (Source: Stockcharts)


Chart 6: EURO's weekly chart as at Sep 10, 2012 (Source: Stockcharts)

While it is too early to call the end of the Eurozone crisis, we have seen that the market had reacted positively to the latest development. This could result in some portfolio re-balancing, away from the high-flyers (like US & Malaysian markets) to European markets. One particular group of stocks that I am quite worried about are the high-flying consumer stocks, which were steadily bought up by foreign funds. Some profit-taking has just begun.

Some blue chips are breaking their uptrend line


Many blue chips are testing their uptrend line now while a few are breaking below it. I have appended below a few blue chips that have just broken their uptrend line; thus increasing the likelihood that they may slide further. This will put pressure on the index.


Chart 1: HLFG's daily chart as at September 11, 2012_11am (Source: Quickcharts)


Chart 2: Tenaga's daily chart as at September 11, 2012_11am (Source: Quickcharts)


Chart 3: CIMB's daily chart as at September 11, 2012_11am (Source: Quickcharts)


Chart 4: KLK's daily chart as at September 11, 2012_11am (Source: Quickcharts)

FBMKLCI may test the 1600 psychological support soon

FBMKLCI broke the more gradual uptrend line that stretches back to October 2011. That uptrend line, SS support is at 1611. See Chart 1.

Chart 1: FBMKLCI's daily chart as at September 10, 2012 (Source: Quickcharts)

With the above breakdown, the index will soon test the psychological 1600 mark. A break below that level should send the index to the longer term uptrend line at 1550-1570. See Chart 2 below.


Chart 2: FBMKLCI's weekly chart as at September 10, 2012 (Source: Quickcharts)

There was an article in the Edge this week which raised the specter that the stock market has peaked. It is a brave man who dared to say that the market has peaked but braver still if he dared to say that the market will go into a sharp downturn. However, there are amber evidences that the global economy is slowing down, with many countries staring at the prospect of technical recession soon. It is a sad commentary that the prospect of a recession has given rise to a perverse hope that the central banks would act to loose up monetary policies or in some cases, engage in unconventional measures to prod up assets value. In the Eurozone, we have seen ECB announcing Outright Monetary Transaction to acquire unlimited bonds of distressed countries in order to press down the yield of bond. We will have to wait & see how much of central banks' machination would be enough to overcome market forces. Until then, our market will have to find its level.

Friday, September 07, 2012

Market slide halted!

Two developments happened just the past 24 hours which brought cheers to the equity markets. The first thing was the announcement of Outright Monetary Transaction by ECB, which is the unlimited buying of short-term bond (with tenor up to 3 years) in order to depress the high yield of bond or borrowings by peripheral countries, such as Spain & Italy. The second thing was the announcement of a slate of infrastructure projects by China amounting to RMB1 Trillion. While the amount is only one quarter of the 2008 stimulus package, the market reacted positively.

In our local bourse, we can see that both FBMKLCI & FBMEMAS both broke their uptrend line yesterday. They found support at their strong horizontal line and rebound a bit. We will have to wait & see whether the two positive developments would be sufficient to put the market back on an upward trajectory.


Chart 1: FBMEMAS's daily chart as at Sept 7, 2012_12.30pm (Source: Quickcharts)


Chart 2: FBMKLCI's daily chart as at Sept 7, 2012_12.30pm (Source: Quickcharts)

Wednesday, September 05, 2012

Market Outlook as at September 5, 2012


Our FBMKLCI suddenly dropped by 11 points to close at 1644 in the morning session. Losers outnumbering gainers by 560 to 105. Volume traded was high at about 740 million (for the first session only).

Many investors & some remisiers were surprised by the sharp fall. They shouldn't be surprised at all because the market sentiment has been very cautious, with consistent poor market breadth for the past few weeks. I like the term Louise Yamada of Louise Yamada Technical Research Advisors, LLC coined to describe the rally in the market for the past few months- a vacuum rally. She further added that this rally is characterized by short-covering, low volume, and deteriorating new highs vs. new lows. Louise is speaking about the US markets but she could well be speaking for many equity markets worldwide. 

Our Malaysia market has been trading in very tight range for many weeks, with volatility noted only among the blue chips MNC consumer stocks, such as Nestle, BAT, Carlsbg, GAB & DLady. The current sharp drop in many stocks could lead to a correction lasting a few days, possibly a few weeks, which could send FBMKLCI to its uptrend line support at 1630. A break below that support could send the index to the strong horizontal support at 1600.


Chart 1: FBMKLCI's daily chart as at Sept 5, 2012_12.30pm (Source: Stockcharts)

Many of the indices of major equity markets have tested their downtrend line but failed to break above it. The failure to surpass a resistance would normally lead to some correction in the market, as investors take some money off the table. The only major markets that are not constrained by downtrend line are the US markets. Even so, we can see that DJIA failed to break above its recent high at 13300. This too will result in some correction in that market.


Chart 2: DJIA's weekly chart as at Sept 4, 2012 (Source: Stockcharts)


Chart 3: DAX's weekly chart as at Sept 4, 2012 (Source: Stockcharts)


Chart 4: CAC's weekly chart as at Sept 4, 2012 (Source: Stockcharts)


Chart 5: FTSE's weekly chart as at Sept 4, 2012 (Source: Stockcharts)


Chart 6: HSI's weekly chart as at Sept 4, 2012 (Source: Stockcharts)

 
Chart 7: STI's weekly chart as at Sept 4, 2012 (Source: Stockcharts)

Based on the above, we can expect more weakness in the market for the near term. It is prudent not to rush into the market too early as the sharp fall could be the start of corrective move that may last for a few weeks. Better sit on the sideline and see whether strong support - such as the uptrend line support at 1630 or the strong horizontal support at 1600 - can hold.

Ingens- Stranger things had happened!

This has come in. Ingens's substantial shareholder Chin Boon Long is not selling his stake in the company to Ninetology. (Why am I not surprised?) He said at a press conference on Wednesday that he was not accepting the offer. "Thanks, but no thanks," he said, in reference to Ninetology's offer. (Aha, a man of principle!) It will be very interesting to hear what he had to say. After all, his exact words before today's press conference were:
"Definitely I have something to reveal. Whether I want to sell my shares or not, I will explain. I will give the rationale on that day. There are too many questions being raised (about the proposed acquisition) in the newspapers which I don't want to prolong".
Whatever it is, it better be convincing because he just dashed the hope of thousand of investors & punters who rightly or wrongly thought that they can sell their shares at RM0.55 apiece. If  Ingens share price were to drop back to RM0.10 or if the company's financial performance were to revert to the bad old days of loss-making, Chin would have quite a bit of explaining to do. He can't just say, I'm a man of principles. Those are my principles. If you don't like them, I have others.

Tuesday, September 04, 2012

Ingens- a restricted offer to buy!


In the Sun newspaper today, there is an article entitled "Ingenuity's major shareholder to clarify issues on offerfrom Ninetology" which can truly test the readers intelligent. In an unbelievably audacious air, Chin Boon Long- one of the four substantial shareholders who received a seemingly generous offer by Ninetology to sell his shares in Ingens- promised to hold a press conference on Wednesday to explain his rationale to clear the air. In his words:
"Definitely I have something to reveal. Whether I want to sell my shares or not, I will explain. I will give the rationale on that day. There are too many questions being raised (about the proposed acquisition) in the newspapers which I don't want to prolong".
The burden the poor man has to shoulder. He further added:
"Over the weekend, I feel very bad. The 55 sen and 55th Merdeka Day made me sleepless. I don't want to be linked to (doing a) con job or any kind of (market) manipulation."
To be frank, I do not know what's so great about Ingens. Here I must share with you a bit of history of Ingens.

On October 20, 2011, Ingens bought Vistavision Resources Sdn Bhd ('VRR') for RM15.452 million. The purchase consideration was settled by way of 154.52 million shares of Ingens valued at RM0.10 each. Because this acquisition was only completed on February 21, 2012, the full benefit of the ICT Distribution business of VRR was booked in QE30/6/2012. See the table below.


What does the results for QE30/6/2012 tell us about Ingens? Remember, the play on this stock started just before the announcement of what looks like a fantastic performance by Ingens.

Firstly, we can see that the Enterprise Systems was suddenly profitable after a few years of poor performance. That segment made a pre-tax profit of RM2.25 million on lower revenue of RM4.0 million. Compared that with pre-tax losses of RM2.26 million & RM1.11 million in FY2012 & FY2011.

Secondly, the newly-acquired ICT Distribution business chalked up a pre-tax profit of RM1.83 million on revenue of RM126 million. This segment has the potential to contribute a full-year pre-tax profit of RM7.2 million. That would make the acquisition of that business at a price of RM15.452 million to be a steal! A master stroke by a perennial under-performer!

Suddenly, an offer to buy over the company's shares at a price of RM0.55 each surfaces. Before you go out & buy this stock, there is a caveat: The offer is good only if Ingens's 4 major shareholders (including the hapless Chin) agreed to sell their combined stake of 39.44% in the company. If that inconvenient condition is fulfilled, the offer will be unconditional. Why can't the offeror, Ninetology just make a simple conditional offer to buy 50% plus one share in the company? Why must the offer be conditional upon the existing 4 major shareholders selling out?

Here are some reasons why the Ninetology's offer is not a serious offer:
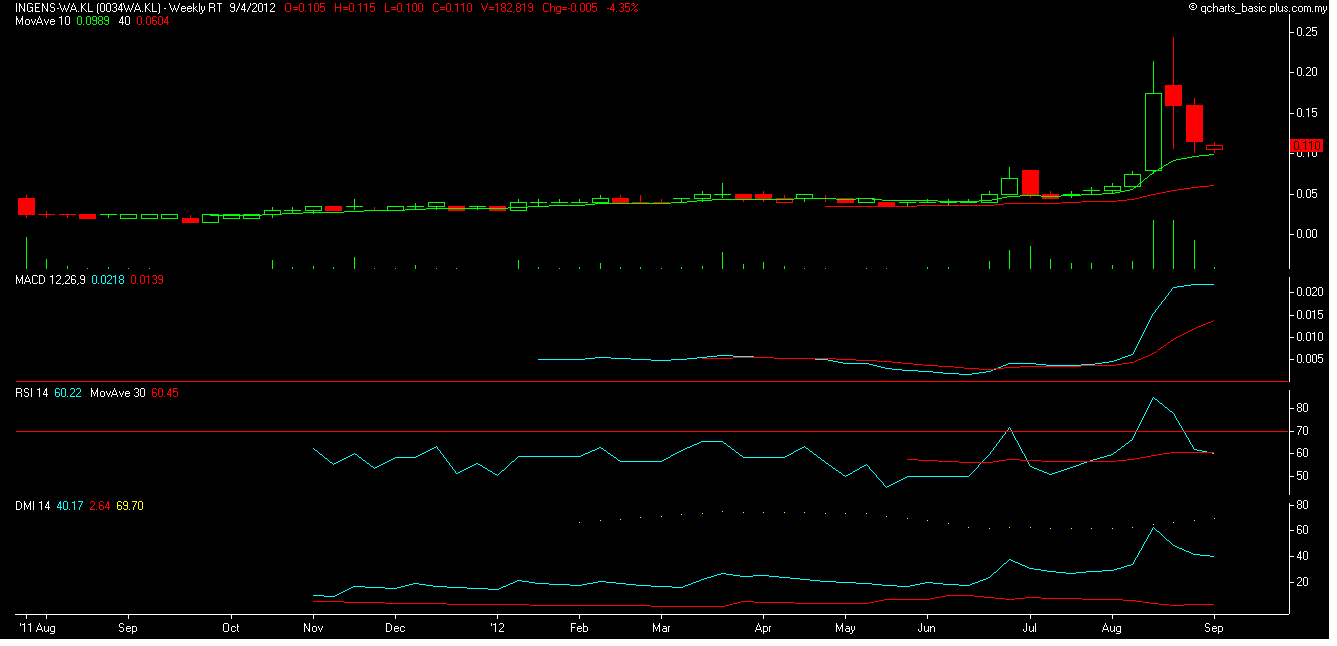
1. The offer which value the stock at RM0.55 each & presumingly the warrant at RM0.45 each, would value the entire company at RM381 million. That's rather rich when you compared the vaue of Ingens of RM48 million as at June 1, 2012 (based on stock & warrant price of RM0.075 & RM0.04 respectively)
2. The increased value of the company was due to its Enterprise Systems segment returning to profitability and the maiden profit from the newly-acquired ICT Distribution segment. While the latter is not a surprise, the strong performance of the former was highly suspicious.
3. If the results of the Enterprise Systems segment is a fluke, then the offeror would be valuing Ingens at a PE of 53 times (based on market value of RM381 million & net profit of RM7.2 million, ignoring tax).

So, my advice to Chin is that he should quickly accept the offer from Ninetology. He should do more than that: he should convince the other 3 major shareholders to accept the offer so that the minority shareholders can benefit. If you are like me and you think that the offer will vanish soon, you should seriously consider selling your shares in Ingens.


Chart 1: Ingens's weekly chart as at Sep 3, 2012 (Source: quickcharts)


Chart 2: Ingens-WA's weekly chart as at Sep 3, 2012 (Source: quickcharts)

Note:
In addition to the disclaimer in the preamble to my blog, I hereby confirm that I do not have any relevant interest in, or any interest in the acquisition or disposal of, Ingens.
Monday, September 03, 2012

MNRB- bottom-line improved

Results Update

For QE30/6/2012, MNRB's net profit increased by 21% q-o-q or 17% y-o-y to RM50 million while revenue grew by 21% q-o-q or 1% y-o-y to RM404 million. The improved bottom-line was attributed to improvement in claims experienced by the reinsurance subsidiary.


Table 1: MNRB's last 8 quarterly results

If you look at Chart 1, we can see that MNRB's bottom-line falls in between small losses & profit of RM50 million. As a reinsurer, MNRB could be taking on too much insurance risks to improve its bottom-line and as such, it could get hit when insurance claims arose.


Chart 1: MNRB's last 22 quarterly results

Valuation

MNRB (closed at RM3.08 in the morning session) is now trading at a PE of 6.5 times (based on last 4 quarters' EPS of 46.9 sen). Its Price to Book is at 0.58 time while its dividend yield is at 5.5%.

Based on any of the above, MNRB's valuation is deemed undemanding.

Technical Outlook

MNRB is in a bottoming phase for the past 5 years. We can see that the stock tested the line connecting the trough from 1998 until today. The poor performance of the share price reflects the perception of investors that MNRB is not in control its financial performance- a failure to manage its insurance risk.


Chart 2: MNRB's monthly chart as at Aug 30, 2012 (Source: Tradesignum)

Conclusion

Based on above, I would rate MNRB as a HOLD. The stock has strong horizontal resistance at RM3.40-3.50 and good support at RM2.50.

Note:
In addition to the disclaimer in the preamble to my blog, I hereby confirm that I do not have any relevant interest in, or any interest in the acquisition or disposal of, MNRB.