Tuesday, March 12, 2013

Success- an attractive stock

Result Update

For QE31/12/2012, Success's net profit dropped 5% q-o-q bur rose 36% y-o-y to RM8 million while revenue eased off 5% q-o-q or 2% y-o-y to RM76 million.


Table: Success's last 8 quarterly results


Chart 1: Success's last 23 quarterly results

Valuation

Success (closed at RM1.04 today) is now trading at a PE of 4.2 times (based on past 4 quarters' EPS of 25 sen). Price to book is about 0.6 time. All in all, Success is an attractive stock.

Technical Outlook

Success is now resting on its long-term uptrend line at RM1.00.


Chart 2: Success's weekly chart asat Mar 11, 2013 (Source: Quickcharts)

Conclusion

Based on good financial performance (albeit a slight q-o-q decline), attractive valuation and positive technical outlook (albeit unexciting performance), Success is rated a good stock for long-term performance.

Note:
In addition to the disclaimer in the preamble to my blog, I hereby confirm that I do not have any relevant interest in, or any interest in the acquisition or disposal of, Success

Daiman- a breakout, finally


Technical Breakout

Today, Daiman broke above its 2 years old 'horizontal resistance' at RM1.90 as well as the psychological RM2.00 mark. With this breakout, Daiman could rise to its next resistance at RM2.30 (or even the following resistance at RM2.60). See Chart 1 & 2 below.


Chart 1: Daiman's weekly chart as at Mar 12, 2013 (Source: Quickcharts)


Chart 2: Daiman's monthly chart as at Mar 11, 2013 (Source: Quickcharts)

Recent Financial Result

From the table below and the 22-quarter top-line & bottom-line chart below, we can see that Daiman is a profitable company with a slow albeit erratic growth. Throughout the past 5 years, its profit margin is fairly high at 25-30%. This high profit margin may be the limiting factor that restrained the growth of the company. It reminded me of a friend's comment when he resigned from his company, a listed property developer where he said that the boss is so obsessed with getting maximum profit margin that new launches are held back because prices are rising. Is Daiman's management like that?


Table: Daiman's last 8 quarterly results


Chart 1: Daiman's last 22 quarterly results

Valuation

Daiman (closed at RMRM2.03 today) is now trading at a PE of 9 times (based on last 4 quarters' EPS of 22.35 sen). At this multiple, Daiman is deemed fairly valued for a mid-size developer.

Conclsuion

Daiman is probably benefiting from the Johore property theme play. Based on techncial breakout, Daiman could be a good stock for a trading BUY.

Note:
In addition to the disclaimer in the preamble to my blog, I hereby confirm that I do not have any relevant interest in, or any interest in the acquisition or disposal of, Daiman.

Monday, March 11, 2013

GAB & Carlsbg broke above their horizontal resistance

GAB & Carlsbg both broke above their recent high. With this breakout, these stocks are expected to continue their prior uptrend. GAB & Carlsbg's target could be RM20.00 & RM16.00, respectively.

Based on this technical consideration, GAB & Carlsbg could be trading BUYs.

 
Chart 1: Carlsbg's weekly chart as at Mar 11, 2013_4pm (Source: Quickcharts)


Chart 2: GAB's weekly chart as at Mar 11, 2013_4pm (Source: Quickcharts)

Note:
In addition to the disclaimer in the preamble to my blog, I hereby confirm that I do not have any relevant interest in, or any interest in the acquisition or disposal of, GAB & Carlsbg.

Friday, March 08, 2013

JTinter- profit slid further

Result Update

For QE31/12/2012, JTInter's net profit dropped by 90% q-o-q or 89% y-o-y to RM3 million while revenue was mixed, dropped 9% q-o-q but rose 5% y-o-y to RM290 million. The dropped in net profit q-o-q was attributable to lower sales volume, higher marketing investment* & a one-time restructuring impact of the Group leaf and stemmery operations amounting to RM12.2 million which included an impairment of plant and machinery (RM3.3 million), employee redundancy payments (RM4.2million), and a goodwill exit payments to growers (RM3.1million). [*Note: We can't tell how much was  the additional marketing investment but we can see that Other Operating Expenses increased by 20% y-o-y from RM168 million to RM201 million as compared to the 9% y-o-y increase in revenue from RM266 million to RM290 million.]


Table: JTInter's last 8 quarterly results


Chart 1: JTInter's last 23 quarterly results

Valuation

JTInter (closed at RM6.54 yesterday) is now trading at a PE of 17 times (based on last 4 quarters' EPS of 38.73 sen). At this PE, JTInter is fully valued.

Technical Outlook

JTImter is still in an uptrend line with support at RM6.20.


Chart 2: JTInter's weekly chart asat Mar 7, 2013 (Source: Quickcharts)

Conclusion

Based on poorer financial performance & unattractive valuation, I think it is advisable to take some profit on JTInter. However, since the stock is still in an uptrend line, we can afford to do so by selling into strength.

Note:
In addition to the disclaimer in the preamble to my blog, I hereby confirm that I do not have any relevant interest in, or any interest in the acquisition or disposal of, JTInter.

SEG- caught in a competitive industry!

Result Update

For QE31/12/2012, SEG's net profit dropped 84% q-o-q or 86% y-o-y to RM2.5 million while revenue dropped 29% q-o-q or 25% y-o-y to RM53 million. The company explained that the decline was mainly due to the high number of graduating students in this quarter. It expected this to be mitigated by new recruitment drives for new students this year.

In the Star newspaper, SEG's MD Clement Hii further explained that the drop in profit was due to an escalation in costs, which, in turn, was due to the launch of new high-ticket programmes by SEGi University, such as medicine, dentistry, engineering and optometry. “These programmes require high investment cost and a longer gestation period before they can contribute profits to the group. There were also high numbers of graduating students, particularly from the healthcare faculty,” he said.


Table 1: SEG's last 8 quarterly results


Chart 1: SEG's last 19 quarterly results

Outlook for Private Tertiary Education

In an article entitled "Malaysia bans opening of new universities", Investvine reported that Higher Education Minister Datuk Seri Mohamed Khaled Nordin has announced that the government will not allow the setting up of universities, university colleges and colleges for two years effective February 1, 2013 in an effort to curb oversupply of educational institutions. Presently there are 37 private universities, 20 private university colleges, seven foreign university branch campuses and 414 private colleges in Malaysia. It reported that the minister thinks that "the number of higher institutions of learning is enough to meet demand".

In my opinion, the excessive number of institutions of higher learning is affecting their student intake. That the intake of an established institution such as SEG was also affected is a very negative sign. As such, I do not believe that the drop in the student intake as witnessed in SEG can be overcome by a simple recruitment drive. I believe all colleges & universities concerned would engage all-out drive to recruit new students and this could easily escalate into a price war that would result in lower profit margin for all.

Major Shareholders' Action

In April 2012, SEG's MD, Clement Hii & Navis Capital made a joint bid to privatize SEG at RM1.714 a share and RM1.214 a warrant. At the close of the offer in June 2012, they received acceptance for 64.33%  of the outstanding shares &  63.70% of the outstanding warrants. There are no sign that these two major shareholders are selling their shares. Their combined shareholdings stood at 66.6% in January this year.

Valuation

SEG (closed at RM1.69 yesterday) is now trading at a PE of 16 times (based on last 4 quarters' EPS of 10.57 en). As such, SEG is deemed overvalued.

Technical Outlook

SEG's uptrend seems to breaking down. Interestingly, SEG may have gone to an accumulation phase in 2010 & early 2011 where the share price rose with increased volume. In later part of 2011 & 2012, there were even signs of distribution where share price declined with increased volume. After the privatization bid by Clement Hii and Navis Capital, the share price rose to the RM2.00 mark and trading volume dried up. The trading volume picked up over the past 4-5 weeks coinciding with the drop in share price.

 
 Chart 2: SEG's weekly chart as at Mar 7, 2013 (Source: Quickcharts)

Conclusion

Based on poor financial performance, negative business outlook, unattractive valuation & potentially negative technical outlook, SEG is now rated a SELL or AVOID.

Note:
In addition to the disclaimer in the preamble to my blog, I hereby confirm that I do not have any relevant interest in, or any interest in the acquisition or disposal of, SEG.

NCB- bottom-line hit by slower external trade

Result Update

For QE31/12/2012, NCB's net profit dropped by 48% q-o-q or 47% y-o-y to RM23.5 million while revenue dropped by 7% q-o-q or 1% y-o-y to RM236 million. The pre-tax profit has registered a decrease of 22.8% mainly due to lower revenue from container operations. The drop in container operations is consistent with the drop in Malaysia's import & export for October-December 2012 (see Table 2 below).


Table 1: NCB's last 8 quarterly results


Chart 1: NCB's last 19 quarterly results

Malaysian External Trade

NCB's business volume should be closely linked to the country's external trade performance. For 2012, our total trade rose 3 percent to RM1.31 trillion. Exports rose 0.6 percent to RM702.2 billion, slowing down sharply from 8.7 percent growth in 2011. Imports expanded 5.9 percent to RM607.4 billion. For more go here

However, Malaysian external trade took a dip in 4Q2012. From government statistics (extracted in Table 2 below), we can see that import & export numbers had been declining m-o-m for all three months- except for export (not seasonally adjusted) for October 2012. For more details, go to here, here and here


Table 2: Malaysia's Export & Import for October, November & December 2012 (Source: Statistic.gov.my)

While global trade is expected to be sluggish for 2013 (here & here), Malaysia may see a pick-up in trade due to increased import due to increased private investment as well as increased trade with EU & China due to greater cooperation (here). If this pans out as expected, we should see a recovery in revenue & profit for NCB in 1Q2013.

Valuation

NCB (closed at RM4.50 yesterday) is now trading at a PE of 13 times (based on last 4 quarters' EPS of 34.6 sen). At this PE, NCB is deemed reasonably priced.

Technical Outlook

NCB is in an uptrend where we can use the 40-week SMA line as a proxy uptrend line. It is presently resting on the horizontal line RM4.50.


Chart 2: NCB's weekly chart as at Mar 7, 2013 Source: Quickcharts)

Conclusion

Despite the poorer financial performance, NCB is still a good stock for long-term investment based on its positive technical outlook and its fair valuation. I would rate it as a HOLD at the present price of RM4.50.

Note:
In addition to the disclaimer in the preamble to my blog, I hereby confirm that I do not have any relevant interest in, or any interest in the acquisition or disposal of, NCB.

Star- losing its way

Result Update

For QE31/12/2012, Star's net profit rose 183% q-o-q or 93% y-o-y to RM97 million while revenue was mixed, up 15% q-o-q but dropped 2% y-o-y to RM294 million. The increased profit was due mainly to an exceptional gain of RM89.98 million from the disposal of Sec. 13 land in exchange for a building. If this gain is excluded, Star's pre-tax profit would drop to RM4.5 million.


Table 1: Star's last 8 quarterly results


Chart 1: Star's last 25 quarterly results

Segmental Result for 4Q2012 & FY2012

From Table 2 below, we can see that the Print & New Media segment's result improved by RM116 million over the previous year, due to the exceptional gain of RM89.98 million from the disposal of the Sec 13 land. Broadcasting segment had turned in a profit while Event, Exhibition, Interior & Thematic and Television Channel segments were still in the red.


Table 2: Sar's Segmental Results for QE31/12/2012 & QE30/9/2012

As compared to FY2011, we can see that Print & New Media segment improved by RM26 million after including the exceptional gain of RM89.98 million from the disposal of the Sec. 13 land!!! All the other segments suffered poorer performance (either lower profit or incurred a loss or increased losses).


Table 2: Sar's Segmental Results for FY2012 & FY2011

Valuation

Star (closed at RM2.61 yesterday) is now trading at a PE of 17 times (based on adjusted EPS of 15 sen for FY2012, not including the one-off gain from the disposal of the Sec. 13 land). At this multiple, Star is deemed fully valued.

Technical Outlook

Star broke its uptrend line, SS at RM2.90 in December 2012. It found support at the horizontal line at RM2.55.


Chart 2: Star's weekly chart as at Mar 7, 2013_12pm (Source: Quickcharts)

Conclusion

Based on disappointing financial performance, unattractive valuation and negative technical outlook, Star is now rated a SELL or AVOID.

Note:
In addition to the disclaimer in the preamble to my blog, I hereby confirm that I do not have any relevant interest in, or any interest in the acquisition or disposal of, Star.

Wednesday, March 06, 2013

GASMSIA & IHH making new high

GASMSIA & IHH have both broken above their recent high of RM2.75 & RM3.48, respectively. The breakout for GASMSIA is more convincing since the share price is now at RM2.82- a good 7 sen above the previous high. IHH (at RM3.50) is only 2 sen above the previous high.

Based on these breakout, both GASMSIA & IHH could be trading BUY.


Chart 1: GASMSIA's daily chart as at Mar 6, 2013_4pm (Source: Quickcharts)


Chart 2: IHH's daily chart as at Mar 6, 2013_4pm (Source: Quickcharts)

Note:
In addition to the disclaimer in the preamble to my blog, I hereby confirm that I do not have any relevant interest in, or any interest in the acquisition or disposal of, GASMSIA & IHH.

Fitters- profit from property development starts to roll in

Results Update

For QE31/12/2012, Fitters's net profit rose 117% q-o-q or 43% y-o-y to RM10 million while revenue rose by 15% q-o-q or 6% y-o-y to RM114 million. The improved bottom-line was due to increase in sales of the LOFT service apartment in Zetapark, Setapak which was launched in November 2011.


Table 1: Fitters's last 8 quarterly results

From Table 2 below, we can see that Construction, Engineering & Property segment is the most important segment in the group, accounting for 83% of its pre-tax profit & 41% of its revenue. The bulk of the recent increased revenue & pre-tax profit came from its Zetapark project in Setapak where the estimated GDV is about RM600 million. For more on this, go here.

It is doubtful whether Fitters will be able to repeat this strong performance after the completion of the Zetapark project as it does not have any significant landbank besides the Setapak land. The only undeveloped land it has is a 20-acre agricultural land in Cameron Highland. Hopefully it can replenish its landbank during the interim period or its investment in renewal energy projects starts to show good results.


Table 2: Fitters''s Segmental Results for the past 4 years


Chart 1: Fitters's last 18 quarterly results

Financial Position

Fitters' financial position as at 31/12/2012 is deemed satisfactory. Its current ratio stood at 2.33 times while gearing ratio is low at 0.15 time. Cash in hand amounted to RM41 million.

Valuation

Fitters (closed at RM0.565 yesterday) is now trading at a PE of 4.4 times (based on last 4 quarters' EPS of 12.7 sen). At this PE, Fitters is deemed fairly attractive.

Technical Outlook

Fitters has been sliding for the past 18 months, dropping from a high of RM1.15 to the current price of about RM0.56-0.57. It has gone below the horizontal support of RM0.58, which happens to be the long-term uptrend line. Its technical outlook is negative.


Chart 2: Fitters's weekly chart as at Mar 6, 2013_12pm (Source: Quickcharts)

Conclusion

Based on good financial financial performance and attractive valuation, Fitters could be a stock for long-term investment. Despite these positive factors, Fitters may not attract much interest as the technical outlook is negative. However, for those who are stuck in this stock due to my earlier call, a slow accumulation at the present price may be a good idea.

Note:
In addition to the disclaimer in the preamble to my blog, I hereby confirm that I do not have any relevant interest in, or any interest in the acquisition or disposal of, Fitters.

Genting- breaks above the RM10 mark

Result Update

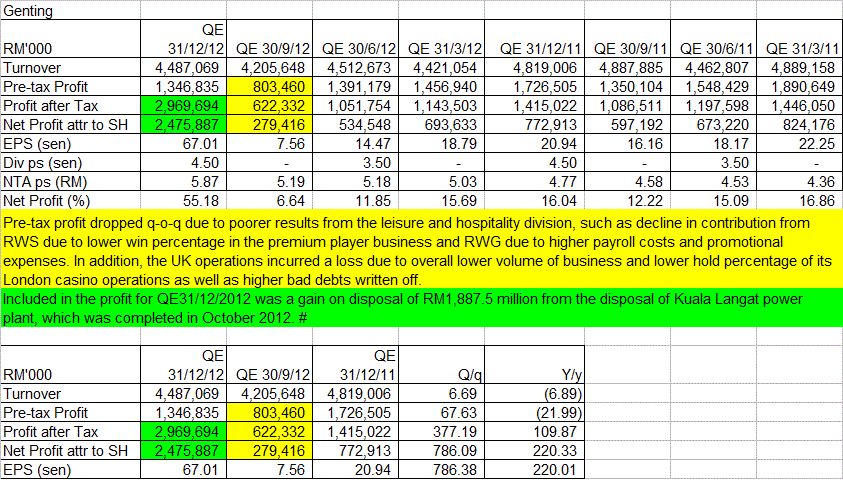
For QE31/12/2012, Genting's net profit rose nearly 8-fold q-o-q or more than 2-fold y-o-y to RM2.48 billion due to the exception gain of RM1.89 billion from the sale of the Kuala Langat power plant in October 2012. Pre-tax profit was however mixed- rose 68% q-o-q but dropped 22% y-o-y to RM1.35 billion. Revenue was similar mixed- rose 7% q-o-q but declined 7% y-o-y to RM4.49 billion.

Pre-tax profit dropped q-o-q due to poorer results from the leisure and hospitality division, such as decline in contribution from RWS due to lower win percentage in the premium player business and RWG due to higher payroll costs and promotional expenses. In addition, the UK operations incurred a loss due to overall lower volume of business and lower hold percentage of its London casino operations as well as higher bad debts written off.


Table: Genting's last 8 quarterly results


Chart 1: Genting's last 27quarterly results

Valuation

Genting (at RM10.00 as at 10.30am this morning) is trading at a PE of 17.5 times its adjusted full-year EPS of 57 sen (after excluding the exceptional gain from the sale of the Kuala Langat power plant). At this PE, Genting is deemed fully valued.

Technical Outlook

From Chart 2 below, Genting tested the resistance of RM9.90 posed by the line connecting its recent high. With  Genting currently at RM10.00, the stock has achieved an upside breakout that could signal the start of its recovery. If the stock can just stay above the RM10 mark, the previous bearish outlook for Genting (here) would have to be revised.


Chart 2: Genting's daily chart as at Mar 5, 2013 (Source: Tradesignum)


Chart 3: Genting's monthly chart as at Mar 5, 2013 (Source: Tradesignum)

Conclusion

Despite the challenging environment (with rampant proliferation of casinos everywhere), poorer financial results and demanding valuation, Genting is a stock for those with longer time horizon. Its technical outlook has improved and that may warrant a change in the rating for the stock from bearish to neutral. Further upgrade would depend on better financial performance and share price performance.

Note:
In addition to the disclaimer in the preamble to my blog, I hereby confirm that I do not have any relevant interest in, or any interest in the acquisition or disposal of, Genting.

JOBST- bottom-line dipped

Results Update

For QE31/12/2012, Jobst's revenue dropped q-o-q as a result of lower sales from JobStreet Essential due to seasonality factors. Pre-tax profit contracted by 15.4% q-o-q mainly due to the impact of lower sales from JobStreet Essential, higher marketing expenses, lower share of profits from associated companies and a lower increase in the fair value of the Group’s investments. The comparison of profitability between the two successive quarters will have to take into account significant one-off items such as the reversal of impairment loss on investment in an associate of RM4.1 million in QE31/12/2012 and the gain on dilution of interest in an associate of RM969k in QE30/9/2012.


Table: JOBST's last 8 quarterly results


Chart 1: JOBST's last 27 quarterly results

Valuation

JOBST (closed at RM2.58 yesterday) is now trading at a PE of 14 times (based on last 4 quarters' EPS of 18.25 sen). For a stock that has been growing at an CAGR of 25%, JOBST has a PEG ratio of 0.5 time, which is very attractive.

Can JOBST maintain its strong growth rate? From the article entitled "Jobstreet well positioned for regional growth" in the Edge this week, we learned that JOBST is now present in six of the largest markets in S.E.A. namely Malaysia, Singapore, the Philippines, Indonesia, Thailand & Vietnam. Besides Malaysia, it is the market leader in Singapore, Indonesia & the Philippines. With a population of 600 million and the rapid economic growth, ASEAN will be the focus of JOBST's regional expansion plan. As such, I feel strongly that JOBST will be able to maintain its strong growth.

Technical Outlook

JOBST broke above its horizontal resistance at RM2.40. It is now pressing against its next resistance at RM2.60.


Chart 2: JOBST's weekly chart as at Mar 4, 2013 (Source: Quickcharts)

Conclusion

Based on good financial performance (albeit a small decline in the past two quarters), attractive valuation & positive technical outlook, JOBST remains a good stock for long-term investment.

Note:
In addition to the disclaimer in the preamble to my blog, I hereby confirm that I do not have any relevant interest in, or any interest in the acquisition or disposal of, CCM.

Deleum- an attractive O&G stock poised to go

Background
Deleum Bhd is involved in the following business:


- Power and Machinery
- Oilfield Services
- Maintenance, Repair and Overhaul

Power and Machinery segment contributed 94% & 80% of the group's pre-tax profit & revenue, respectively for FY2012.


Recent Financial Results

For QE31/12/2012, Deleum's net profit increased by 11% q-o-q or 87% y-o-y to RM13.5 million while its revenue rose by 25% q-o-q or 46% y-o-y to RM155 million. Bottom-line improved due to Power and Machinery segment recording a RM6.5 million increase in pre-tax profit to RM21.3 million. This is due mainly to retrofit projects and higher dispatch of valves and regulators during the currentquarter on the back of increased exploration and production activities.

The improved results for Power and Machinery segment had more than offset the losses incurred by the Oilfield Services segment of RM1.5 million & by Maintenance, Repair and Overhaul segment of RM0.6 million.


Table: Deleum's last 8 quarterly results


Chart 1: Deleum's last 25 quarterly results

Financial Position

Deleum's financial position is deemed satisfactory as at 31/12/2012. Its current ratio stood at 1.7 times while gearing ratio was negligible at 0.08 time. Cash reserves stood at RM81 million or cash per share of 54 sen.

Valuation

Deleum (closed at RM2.04 yesterday) is now trading at a PE of 6.8 times (based on EPS of 29.8 sen for FY2012). At this PE, Deleum is deemed attractive.

Technical Outlook

deleum has just broken above the horizontal-cum-psychological resistance of RM2.00. While this breakout, the stock may march to its next resistance at RM2.25.


Chart 2: DEleum's weekly chart as at Mar 4, 2013 (Source: Quickcharts)

Conclusion

Based on good financial performance & position, attractive valuation & positive technical outlook, Deleum is good stock for trading BUy or long-term investment.

Note:
In addition to the disclaimer in the preamble to my blog, I hereby confirm that I do not have any relevant interest in, or any interest in the acquisition or disposal of, Deleum.

Tuesday, March 05, 2013

CCM- a nascent recovery play?


Results Update

For QE31/12/2012, CCM's net profit increased by 120% q-o-q or 91% y-o-y to RM18 million while revenue was mixed - rose 1% q-o-q but dropped 6% y-o-y - to RM378 million. Revenue dropped q-o-q due to lower revenue contribution from the Chemicals and Fertilizers Divisions. Bottom-line improved due to due to improvement in gross profit margins across the Divisions; operational cost reduction in Chemicals and Fertilizers Divisions; and recognition of change in fair value of investment properties of RM7.4 million.

The management continues to remain cautious and expect the challenging operating environment ahead.


Table: CCM's last 8 quarterly results


Chart 1: CCM's last 28 quarterly results

Valuation

CCM (closed at RM1.02 today) is now trading at a PE of 11.5 times (based on last 4 quarters' EPS of 8.9 sen). At this PE multiple, CCM is deemed fairly valued.

Technical Outlook

CCM's long years in the wilderness was noted in my previous post entitled CCM- a 6-year decline!. From the chart below, we can see that irregular downward channel (Rx-Rx, Sx-Sx) which guided the share price lower. In its deeply oversold position, the stock could stage a rebound that could recoup some of its lost ground. It is too hopeful to expect the share price to rise up to Rx-Rx but a recovery to R1-R1 is not too far-fetch.


Chart 2: CCM's weekly chart as at Mar 4, 2013 (Source: Tradesignum)

Conclusion

Based on challenging operating environment & unexciting financial performance, the only argument to but CCM is that it is deeply oversold.

Note:
In addition to the disclaimer in the preamble to my blog, I hereby confirm that I do not have any relevant interest in, or any interest in the acquisition or disposal of, CCM.

Property index may have a breakout

Shanghai's SSEC dropped 3% yesterday on announcement of new measures by Chinese authority to curb property speculation (here). This followed similar measures announced by Hong Kong in February (here) and in Singapore in January (here). With no new measure being introduced, property speculators will set their sight on Malaysia (here). Already, we have seen numerous deals announced in Johor (especially around Iskandar Waterfront). Slowly but surely, Malaysian property scene is coming back to live.

From the chart below, we can see that the Property index has just broken above the horizontal resistance at 1100 and it is set to test its January 2011 high of 1159. The upside breakout of the Property index means that property stocks could be good trading BUY. These include stocks with exposure in Iskandar & Nusantara, such as UEMLand and Tebrau, as well as those with landbank in Pengerang, such as MPHB. The Property theme play may spread to other property counters, such as Sunway & IJMland (which had a successful launch over the weekend in its latest township project, Rimbayu).


Chart 1: Property index's weekly chart as at Mar 5, 2013_3pm (Source: Quickcharts)

The other lagging sector on our exchange - Construction - may also benefit from the pick-up in Property sector as well as more large scale construction projects in the pipeline, such as the high-speed train connecting KL-Singapore, West Coast highway, more power plants and another 2 MRT tracks. However, from the chart below, we can see that the Construction index is still in a downtrend and until it has achieved a breakout, we cannot expect a broad-based rally among Construction stocks. For those with long-term investment horizon and who can stomach sharp drop in share price, some construction stocks to consider are Gamuda, Mudajaya & MRCB.


Chart 2: Construction index's weekly chart as at Mar 5, 2013_3pm (Source: Quickcharts)

Monday, March 04, 2013

MBSB- uptrend to continue

MBSB broke above its horizontal resistance at RM2.48 today. With this upside breakout, the stock may continue its uptrend. Its next target could be RM2.75-2.80.

As such, MBSB could be a good trading BUY.


Chart: MBSB's daily chart as at March 4, 2013_12.15pm (Source: quickcharts)

For more on MBSB, go here.

Note: 
In addition to the disclaimer in the preamble to my blog, I hereby confirm that I do not have any relevant interest in, or any interest in the acquisition or disposal of, MBSB.

Friday, March 01, 2013

Sunway- an attractive construction-based group

 Background

Sunway Bhd is involved in the following businesses:
- Integrated Properties
- Construction
- Trading & Manufacturing
- Quarrying
- Building material
- Healthcare
It is the result of the merger between Sunway Holdings Inc. Bhd & Sunway City Bhd which was completed in early 2011.

Recent Financial Results

For QE31/12/2012, Sunway's net profit increased by 133% q-o-q or 55% y-o-y to RM219 million while revenue increased by 38% q-o-q or 30% y-o-y to RM1.2 billion. Its running net profit & revenue for the past 4 quarter to QE31/12/2012 amounted to RM532 million & RM3.88 billion, respectively. This compared favorably with the preceding 4-quarter net profit & revenue of RM388 million & RM3.69 billion,, respectively.


Table 1: Sunway's last 8 quarterly results


Chart 1: Sunway's last 8 quarterly results

Financial Position

Sunway's financial position as at 31/12/2012 is deemed fair, with current ratio at 1.58 times and gearing ratio at 0.82 time.

Valuation

Sunway (at RM2.57) is trading at a PE of 6.25 times (when compared to the last 4 quarters' EPS of 41.14 sen). This compared favorably to construction-based groups such as Gamuda, IJM & WCT. If you look at the table below, you will see that only WCT with a such a low PE. The reason for WCT's low PE is that its recent net profit was boosted by a fair value gain of RM218 million. If this exceptional item is excluded, WCT's 4-quarters' EPS was dropped to 14.7 sen & its PE ratio would rise up to 15.2 times. Thus, Sunway looks fairly attractive.


Table 2: Sunway & other construction stocks compared

Technical Outlook

Sunway has broken above its strong horizontal resistance at RM2.46 a few days ago. It is now testing its next resistance at RM2.57.


Chart 2: Sunway's weekly chart as at Mar 1, 2013_12.20pm (Source: quickcharts)

Conclusion

Based on good financial performance, reasonably healthy financial position, attractive valuation & positive technical outlook, Sunway is rated a good stock for long-term investment.

Note: 
In addition to the disclaimer in the preamble to my blog, I hereby confirm that I do not have any relevant interest in, or any interest in the acquisition or disposal of, Sunway.