Wednesday, June 15, 2016

KESM: Earnings Still Holding Up Well

Results Update

For QE30/4/2016, KESM's net profit rose by 8% q-o-q or 337% y-o-y to RM7.6 million while revenue was unchanged q-o-q but rose 13% y-o-y to RM71 million. Profit before tax rose q-o-q mainly due to higher net revenue (increased by  RM2.0  million) and lower exchange loss (by RM0.4 million) offset by increased employee benefits expense (by RM1.1 million).


Table: KESM's last 8 quarterly results

The last 4 quarters have been fairly good for KESM. Its net profit was near its high of RM7-10 million per quarter. The only other period when it did as well was in QE31/1/2008 & QE31/7/2007. In QE31/1/2008, it recorded an exceptional high net profit of RM15 million as it wrote back deferred tax provision amounting to RM16.95 million on obtaining satisfactory agreement on Reinvestment Allowance claims. It is fair to say that KESM could well be at its peak earning.


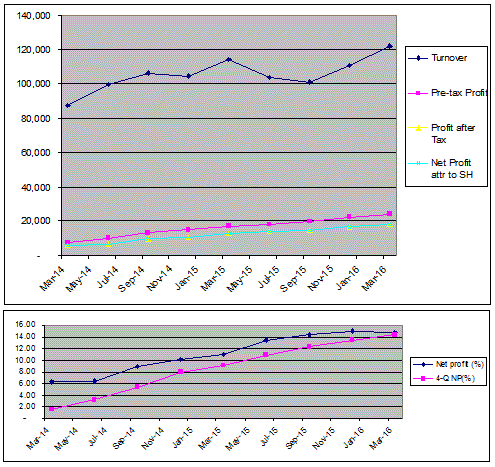
Chart 1: KESM's last 45 quarterly results 

If you look at KESM's profits for the past 45 quarters, you will see that KESM expended RM493 million on capex in order to made net profits totaling RM160 million. Due to high depreciation totaling RM527 million, fixed assets only rose from RM112 million to RM161 million (Note: No attempt is made to reconcile the numbers). The low profits explained why the company's returns on assets & equity are so abysmal, except for periods of peak demand (like 2007/2008 and probably today).


Table 2: KESM's last 10 years' Capex, Depreciation, Net Profit, ROE & ROA


Chart 2: KESM's last 10 years' Capex, Depreciation, Net Profit, ROE & ROA

Industrial Outlook

KESM is dependent on the semiconductor sector, which is expected to be weaker in 2016 due to weak demand for PCs (here). World Semiconductor Trade Statistics (WSTS) reported that global semiconductor sales fell 6.2% y-o-y in April 2016 from US$27.6bil to US$25.8bil. It forecast a global sales for 2016 of US$327.2bil, down 2.4% from 2015. (here). The weaker demand is reflected in the Philadelphia Semiconductor Index (SOX) below.


Chart 3: SOX's monthly chart as at Jau 13, 2016 (Source: Yahoo Finance)

Valuation

KESM (closed at RM5.04 yesterday) is now trading at a PE of 6.5 times (based on last 4 quarters' EPS of 77 sen). If KESM is enjoying peak earning today, then its forward earning could normalize substantially. Based on historical earning of about  20-30 sen, KESM's forward PER could be 16-25 times.

Technical Outlook

KESM is still in a long-term uptrend- guided by its 21-month SMA line. Its latest quarterly result seems to have spur the share price to revisit its January high.


Chart 4: KESM's monthly chart as at Jun 15, 2016 (Source: ShareInvestor.com)

The weekly chart shows immediate resistance at RM5.40.


Chart 5: KESM's weekly chart as at Jun 15, 2016 (Source: ShareInvestor.com)

Conclusion

Based on anticipated poorer financial performance, I would maintain my rating for KESM as a SELL ON STRENGTH.

Note:
In addition to the disclaimer in the preamble to my blog, I hereby confirm that I do not have any relevant interest in, or any interest in the acquisition or disposal of, KESM.

Tuesday, June 14, 2016

BJAuto: Earnings Recovered

Results Update

For QE30/4/2016, BJAuto's net profit was mix- rose 26% q-o-q but dropped 7% y-o-y to RM52 million while revenue rose 2% q-o-q or 26% y-o-y to RM534 million.Revenue rose q-o-q mainly due to improvement in sales mix although sales volume of Mazda vehicles in Malaysia and the Philippines decreased marginally. In line with higher revenue, lower operating expenses and marginal improvement in gross profit margin, pre-tax profit increased by RM15.1 million or 25.9%.


Table: BJAuto's last 8 quarters' financial performance


Chart 1: BJAuto's last 16 quarters' financial performance

Valuation

BJAuto (closed at RM2.28 yesterday) has a PER of 13 times (based on last 4 quarters' EPS of 17.35 sen). While the PER is fair, what's really attractive is its high dividend yield of 7.5%. This high dividend payout will likely continue as the management team will need the dividend payment to repay its SPV's borrowing.

Corporate Development

Since my last note, BJAuto had announced a Management Buyout whereby a Special Purpose Vehicle (SPV) will buyout its management team's 10%-stake in BJAuto and BJCorp's 22%-stake (held by its subsidiary, BGroup). This buyout, which will be financed by a loan of RM406 million, is viewed positively because it reflects its management's confidence in the company, assured a high level of dividend payout (in order to repay the SPV's borrowing) and clear the share overhang from BJCorp. Since the announcement, a few research houses have reaffirmed their rating for the stock- valuing it at around RM2.50. For more, go here.

In addition, BJAuto secures the distributorship for the Korean cars, Ssangyong in Malaysia. Its Philippines subsidiary has been distributing this make since the beginning of the year. This news only received lukewarm reaction as Ssangyong is not well-known and it is not expected to contribute significantly to either the top-line and the bottom-line in the near-term.

Technical Outlook

BJAuto has been moving sideways between RM2.35 & RM1.90 in the past 10 months. A tentative medium-term uptrend line, S1-S1 with support at RM2.30 may have formed. Until a convincing breakout above RM2.35 (preferably RM2.40), range-bound trading will probably prevail.


Chart 2: BJAuto's weekly chart as at Jun 13, 2016 (Source: Share Investors)

Conclusion

Based on good financial performance and good dividend yield, BJAuto's rating is kept as a HOLD. This rating will be raised to a BUY if the share price can break above the RM2.35-2.40 level.

Note: 
In addition to the disclaimer in the preamble to my blog, I hereby confirm that I do not have any relevant interest in, or any interest in the acquisition or disposal of, BJAuto.

BJFood: Earnings Dropped Sharply

Results Update

For QE30/4/2016, BJFood's net profit dropped by 57% q-o-q or 51% y-o-y to RM3 million while revenue was mix- dropped 6% q-o-q but rose 8% y-o-y to RM139 million. Revenue & profitS dropped q-o-q as the company came off its biggest quarter in terms of revenue and pre-tax profit in our financial year (QE31/1/2016) with the calendar year end festive sales, school holidays and Christmas season.


Table: BJFood's last 8 quarterly results

Looking at the quarterly P&L chart, we can see that BJFood's profit margins took a tumble in the last quarter, with PBT margin barely staying above the 5% and net profit margin at a mere 1.4%. This is attributed to "lower contribution from KRR operations in Malaysia as Malaysian consumers are cautious and prudent in their spending after the implementation of Goods and Services Tax ("GST") and also the steep depreciation of Ringgit Malaysia that had affected the profit margin of Berjaya Starbucks Coffee Company Sdn Bhd ("BStarbucks"). In addition, this quarter included an amount of about RM600,000 paid to Royal Malaysian Customs Department by BStarbucks for additional import duty and sales tax on purchases from its principal over the past few years."


Chart 1: BJFood's last 26 quarterly results on the left-hand side while on the right-hand side, the adjusted numbers (excluding the extraordinary gain of RM158.6 million recorded in QE31/10/2014) 

Valuation

BJFood (closed at RM1.83 yesterday) is now trading at a PE of 29 times (based on last 4 quarters' EPS of 6.3 sen. At this PER,  BJFood is deemed overvalued.

Technical Outlook

I plotted a 3-fan uptrend line onto the price chart. It looks like BJFood is on the 3rd (or lowest) uptrend line. A break below this uptrend line would mean the uptrend for this stock is over. Thus it is important that it must stay above RM1.80-1.85.

 
Chart 2: BJFood's weekly chart as at Jun 13, 2016 (Source: ShareInvestor.com)

Conclusion

Based on weak financial performance & demanding valuation, I would rate BJFood as a SELL or REDUCE.

Note:
In addition to the disclaimer in the preamble to my blog, I hereby confirm that I do not have any relevant interest in, or any interest in the acquisition or disposal of, BJFood.

Thursday, June 09, 2016

Econbhd: A Good Specialist Construction Stock

Background

Econpile Holdings Bhd ('Econbhd') is involved in the provision of foundation and geotechnical works, civil engineering works, structure works and design and build packages.

Recent Financial Performance

Econbhd's profits have been rising gradually due to improved profit margins. Revenue, which was suffered a minor pullback in mid-2015, is again on a rising path.  


Table: Econbhd's last 8 quarters' P&L


Chart 1: Econbhd's last 9 quarters' P&L

Financial Position

Econbhd's financial position is deemed healthy as at 31/3/2016 with current ratio at 2.4x and total liability to equity at 0.6x. Debtor collection period stood at 184 days- comparable to Pintaras's 206 days.

Valuation

Econbhd (closed at RM1.39 yesterday) is now trading at a trailing PER of 11.8x (based on last 4 quarters' EPS of 11.76 sen). At this PER, Econbhd is considered fairly valued. However, Econbhd's earning grew by 61% compared to the preceding 4 quarters. Assuming it can achieve a CAGR of 20%, its PEG ratio would be less than 0.6x. This would make the stock quite attractive.

Technical Outlook

Econbhd broke above its triangle at RM1.15 in late March. With this breakout, Econbhd's upleg has begun.


Chart 2: Econbhd's weekly chart as at Jun 9, 2016 (Source: ShareInvetor.com) 

After the upside breakout, Econbhd consolidated between RM1.30 & RM1.40. It has just broken above this consolidation (an ascending triangle) at RM1.40. Is this a continuation of the upleg move or is it a fake breakout prompted by a dividend payment of 2.5 sen? We will have to wait and see.


Chart 3: Econbhd's daily chart as at Jun 9, 2016 (Source: ShareInvetor.com) 

Conclusion

Based on good financial performance & position, fair valuation & mildly bullish technical outlook, Econbhd could be a good stock for long-term investment.

Note:
In addition to the disclaimer in the preamble to my blog, I hereby confirm that I do not have any relevant interest in, or any interest in the acquisition or disposal of, Econbhd.

Tuesday, June 07, 2016

HSL: Best Proxy for the Sarawak's Construction Sector

Background

Hock Seng Lee Bhd. ('HSL') is involved in the marine engineering, civil engineering, land reclamation, dredging and building construction as well as property development. Its businesses are grouped into 2 segments: the Construction and Property Development segments.


HSL's 2 main businesses

Property development segment, which contributes 15% of overall revenue, accounts for 37% of overall PBT. The reason is differing profit margin: 32% for property development & 15% for construction in FY2015.


HSL's current & future property development

Going forward, HSL's growth will be driven by two major contracts secured:
  • Kuching City Central Wastewater Management System: Centralized Sewerage For Kuching City Centre (Package 2) valued at RM750 million secured by a JV which HSL has a 75% interest
  • Pan Borneo Highway in the State of Sarawak - Phase 1: Bintangor Junction to Julau Junction and Sibu Airport to Sg. Kua bridge (including Batang Rajang bridge) valued at RM1710 million secured by a JV which HSL has a 70% interest
These plus its existing contracts worth about RM658 million will balloon its contracts in hand to RM2.4 billion.

Historical Financial Performance

HSL's revenue surpassed the RM600 million mark in FY2015. Its net profit remained below the RM80 million mark due to lower profit margin.


Chart 1: HSL's P&L for the past 10 years

The divergence between revenue & profit is due to the drop in profit margin for both construction & property development segments. Property development's profit margin dropped 6 percentage points from 38% in FY2011 to 32% in FY2015 while construction's profit margin dropped 5 percentage points from 20% in FY2012 to 15% in FY2015.


Chart 2: HSL's Segmental performance for the past 10 years

Recent Financial Performance

In the past 4 quarters, we can see an improvement in profit margin but revenue remained stagnant at the RM150 million mark.


Table: HSL's last 12 quarters' P&L


Chart 3: HSL's last 12 quarters' P&L

Financial Position

HSL's financial position as at 31/3/2016 is deemed very strong, with current ratio at 4.0x and total liabilities to equity at 0.2x. The group appears to have no borrowing. Instead it has a substantial cash balance of RM132 million (or cash holding of RM0.22 per share). Debtors collection period is however high at 161 days. This maybe due to the nature of construction business in the state.

Valuation

HSL (closed at RM1.69 yesterday) is now trading at a trailing PER of 14x (based on last 4 quarters' EPS of 12.25 sen). At this PER, HSL is deemed fully valued.

Technical Outlook

HSL made a high of RM2.14 in March (no thank to my untimely call). Since then, it has been in a downtrend line with resistance at RM1.72-1.73 (see Chart 4). The stock is trading not far from its long-term uptrend line support at RM1.65 (see Chart 5).


Chart 4: HSL's weekly chart as at Jun 6, 2016 (Source: ShareInvetor.com)


Chart 5: HSL's weekly chart as at Jun 6, 2016 (Source: ShareInvetor.com) 

Conclusion

Based on satisfactory financial performance & position, clear earning visibility and mildly bullish technical outlook, HSL could be a good stock to consider for long-term investment. Good entry level is at RM1.65-1.70. 

Note:
In addition to the disclaimer in the preamble to my blog, I hereby confirm that I do not have any relevant interest in, or any interest in the acquisition or disposal of, HSL.

Monday, June 06, 2016

EMETALL: An Interesting Machinery & Equipment Manufacturer

Background

EONMETALL GROUP BHD ('EMETALL') is basically involved in the production of flat steel and flat steel products as well as steel machinery and equipment. The business activities may be grouped under Machinery & Equipment and Steel Product & Trading.


EMETALL's 2 Main Businesses

EMETALL has patented a new palm oil extraction plant known as solvent extraction plants ('SEP') which are used to extract residual oil from mesocarp fibre (here & here). Currently, the fibre are either thrown away or burned to generate steam in the mill. There are about 1350 mills in Malaysia and Indonesia which could be the potential buyers of the SEP. To make economic sense, the price of CPO must trade above RM2200. With CPO trading at about RM2600, the demand for SEP is expected to pick up.


Chart 1: CPO's daily chart as at June 6, 2016 (Source:http://ifs.marketcenter.com)

Historical Financial Performance

EMETALL's revenue dropped FY2013  & FY2014 due to lower demand for Steel Product & Trading and Machinery & Equipment segments. In FY2015, both segments enjoyed a rebound in revenue and profits due to improved demand.


Table 1: EMETALL's last 9 years' P&L 


Chart 2: EMETALL's last 9 years' P&L  

Recent Financial Results

EMETALL's revenue rebounded strongly due to higher revenue from the Machinery & Equipment segment.


Table 2: EMETALL's last 10 quarters' P&L  


Chart 3: EMETALL's last 10 quarters' P&L  


Table 3: EMETALL's segmental results

Financial Position

As at 31/3/2016, EMETALL's financial position is deemed satisfactory with current ratio at 1.7x and total liabilities to equity at 0.4x. Debtors' collection period was at 112 days while inventory holding period was at 220 days. The high inventory holding period may reflect the nature of its business where the conversion cycle may take a few months.

Valuation

EMETALL (will close at RM0.75 today) is now trading at a trailing PER of 7.5x (based on last 4 quarters' EPS of 10.38 sen). A this PER, EMETALL is deemed fairly valued for a small-cap stock.

Technical Outlook

EMETALL rallied strongly over the past 6 weeks after it broke above its irregular downward channel at RM0.40. Today, it broke above the resistance from its immediate horizontal line at RM0.70. Its next resistance will be at RM0.90, RM1.00 & RM1.10. A quick rally to the last top could mean a prolonged consolidation ahead. There is no point to rush into this stock if there is no meat left on the bone.


Chart 4: EMETALL's weekly chart as at June 6, 2016_11.00am (Source: Shareinvestor.com)


Chart 5: EMETALL's monthly chart as at June 6, 2016_11.00am (Source: Shareinvestor.com)

Conclusion

Based on improved financial performance, fair valuation and bullish technical outlook, EMETALL could be a good stock to consider for long-term investment. Good entry level is at RM0.70. 

Note:
In addition to the disclaimer in the preamble to my blog, I hereby confirm that I do not have any relevant interest in, or any interest in the acquisition or disposal of, EMETALL.

Market Outlook as at June 6, 2016

FBMKLCI & FBM70 have formed a base over the past 4-5 weeks after the sharp drop in April. With MACD still below the zero line and +DMI yet to cross above the -DMI, uptrend has yet to begin. However, it is relatively safe to take small positions into the market as the base formed should provide support.


Chart 1: FBMKLCI's daily chart as at June 6, 2016_9.30am (Source: Shareinvestor.com)


Chart 2: FBM70's daily chart as at June 6, 2016_9.30am (Source: Shareinvestor.com)

Friday, June 03, 2016

GCB: Earnings Improved

Results Update
For QE31/3/2016, GCB's NP rose 15-fold q-o-q to RM14 million on the back of a mere 2%-increase in revenue to RM591 million. Revenue rose 34% y-o-y, which help to bring GCB back into the black compared to a net loss of RM1.9 million last year.

Profits increased q-o-q  mainly  due  to  increased  sales  volume  and  selling price  of cocoa  butter  and  cocoa  solids as well as higher  net  gain on  foreign  exchange.


Table: GCB's last 8 quarterly results


Chart 1: GCB's last 46 quarterly results

Valuation

GCB (closed at RM1.00 yesterday) is now trading at a trailing PER of 12.5 times (based on last 4 quarters' EPS of 8.01 sen). At this PER, GCB is deemed fairly valued.

Technical Outlook

GCB had a sharp rally after breaking above its long-term downtrend. The current pullback has found support coming from the horizontal line at RM1.00.


Chart 2: GCB's monthly chart as at June 2, 2016 (Source: ShareInvestor)


Chart 3: GCB's monthly chart as at June 2, 2016 (Source: ShareInvestor)
 
Conclusion

Based on good financial performance, reasonable valuation & mildly positive technical outlook, GCB is still rated a BUY.

Note:
In addition to the disclaimer in the preamble to my blog, I hereby confirm that I do not have any relevant interest in, or any interest in the acquisition or disposal of, GCB.

Thursday, June 02, 2016

MFCB: An Attractive Value Stock

Background

Mega First Corporation Berhad (MFCB) has three divisions:
  • Power segment builds, owns and operates power plants.
  • Property segment is engaged in property development and investment.
  • Limestone segment is engaged in quarrying of limestone, manufacturing and trading of calcium carbonate powder, lime based products and calcium silicate bricks. 

 MFCB's 3 Main Businesses

 Historical Financial Performance

The last 10 years P&L shows  a steady growth in revenue from FY2009 to  FY2014. Profits grew at a rapid pace from FY2008 to 2013 before plateauing. The drop in revenue & slight dip in PBT in FY2015 was due to weakness in all 3 segments of the group.


Chart 1: MFCB's last 10 years' P&L


Table 1: MFCB's segmental results for FY2015 & FY2014

Recent Financial Performance

Despite poorer performance in FY2015, things improved in 1Q2016. Total revenue (excluding investment segment performance) grew 63% y-o-y or 40% q-o-q to RM209 million. PBT (excluding investment segment performance & unallocated expenses) grew 75% y-o-y or 23% q-o-q to RM52 million.   


Chart 2: MFCB's last 11 quarters' P&L 


Chart 2: MFCB's last 11 quarters' P&L and segmental results for 1Q2016, 4Q2015 & 1Q2015

Financial Position

MFCB's financial position as at 31/3/2016 is deemed healthy, with current ratio at 2.7x and total liabilities to equity at 0.2x.

Valuation

MFCB (closed at RM1.84 yesterday) is now trading at gross and diluted PER of 5.2x and 8.7x, respectively. At these PERs, MFCB is deemed quite attractive.


Table 2: EPS & PER Computation

Technical Outlook

MFCB has been consolidating for the past 18 months since it made a high of RM2.20 in October 2014. The consolidation takes the pattern of an expanding triangle, ABCD.


 Chart 3: MFCB's daily chart as at June 2, 2016_3.30 (Source: Kentrade)

MFCB has in fact broken below its tentative long-term uptrend line,ss at RM1.77-1.78.


Chart 4: MFCB's weekly chart as at June 2, 2016_3.30 (Source: Kentrade)

The monthly chart shows MFCB to be in a gradual long-term uptrend line, SS. All 3 indicators - MACD, ADX and Stochastic - are down. Like the share price, they have been trending lower for sometimes. The technical outlook is still bearish. The repair will begin with the stock recovering above the long-term uptrend line, ss at RM1.80.

 
Chart 5: MFCB's monthly chart as at June 2, 2016_3.30 (Source: Kentrade)

Conclusion

Based on good financial performance & position and attractive valuation, MFCB is a good stock for long-term investment. Its next upleg may not begin anytime soon in view of the negative technical outlook. Thus, any accumulation of the stock may be carried out in a gradual manner.

Note:
In addition to the disclaimer in the preamble to my blog, I hereby confirm that I do not have any relevant interest in, or any interest in the acquisition or disposal of, MFCB.

SAM: A Growth Stock

Background

Sam Engineering & Equipment (M) Bhd ('SAM') is involved in 3 businesses: aerospace, equipment manufacturing & precision engineering. Aerospace is the largest business segment, accounting for 53-54% of its revenue & PBT (based on latest YTD results).


SAM's 3 main businesses

Latest Development

Two days ago, Singapore Aerospace Manufacturing Pte Ltd ("SAM Singapore") announced that it had converted 83.03 million ICULs into 39.54 million shares at conversion rate of 2.1 ICULS to 1 share. This exercise bumped up its shareholding from 54.46% to 70.12%. The rationale behind the exercise was to increase its income from its investment from an interest income of RM3.32 million (from the converted block of 83.03 million ICULs at a coupon rate of 4% p.a.) to RM15.82 million (from the newly issued block of 39.54 million shares at an assumed dividend of 40 sen p.s.). In addition to the higher income, SAM Singapore's decision to convert the ICULs can be taken as a vote of confidence in SAM's business prospects going forward.

SAM Singapore obtained a block of 101.25 million ICULs plus cash of RM33.75 million as full consideration for the sale of its entire stake in Avitron Private Limited ('Avitron') to SAM in 2012. Avitron is the company that carries on the aerospace business in the group.

Recent Financial Performance

SAM's top-line and bottom-line have risen steadily in the past 7-8 quarters. Its quarterly net profit is around RM15-20 million while revenue is around RM140-170 million. Profit margin is pretty decent at 10-12%.


Table: SAM's last 8 quarters' P&L


Chart 1: SAM's last 22 quarters' P&L


Diagram: SAM's Segmental Results for 9-month ended 2016, 2015, 2014 & 2013

Financial Position

SAM's financial position as at 31/3/2016 is deemed healthy with current ratio at 4.1x and total liabilities to equity of 0.3x.

Valuation

SAM (closed at RM6.64 yesterday) is now trading at a PER of 13.2x (based on last 4 quarters' adjusted EPS of 50.13 sen). Based on CAGR of 50% over the past 2 years, PEG ratio is still comfortably below 1x. As such, SAM valuation is deemed 'reasonable' for a growth stock.

Technical Outlook

SAM has been rising in a gradual uptrend. Currently, it is in a consolidation phase and it is expected to find support at the 10-month SMA line at RM6.60. In the past 2 consolidation phases, the share price dropped below the 40-month EMA line before recovery set in. If the same pattern repeats, then the share price may go as low as RM4.50-5.00 (see the pink area). Arguing against such a deep retracement is the fact that SAM's profits have been rising in the past 7-8 quarters; something which was nor present during the last 2 consolidation phases. Thus I believe there is a good chance that the share price may be well-supported between the 10-month SMA line and the psychological level of RM6.00.


Chart 2: SAM's monthly chart as at June 1, 2016 (Source: ShareInvestor)

Conclusion

Based on good financial performance & position and attractive valuation, SAM is a good stock for long-term investment.

Note:
In addition to the disclaimer in the preamble to my blog, I hereby confirm that I do not have any relevant interest in, or any interest in the acquisition or disposal of, SAM.