Wednesday, July 17, 2013

Unisem- the recovery play may begin soon?

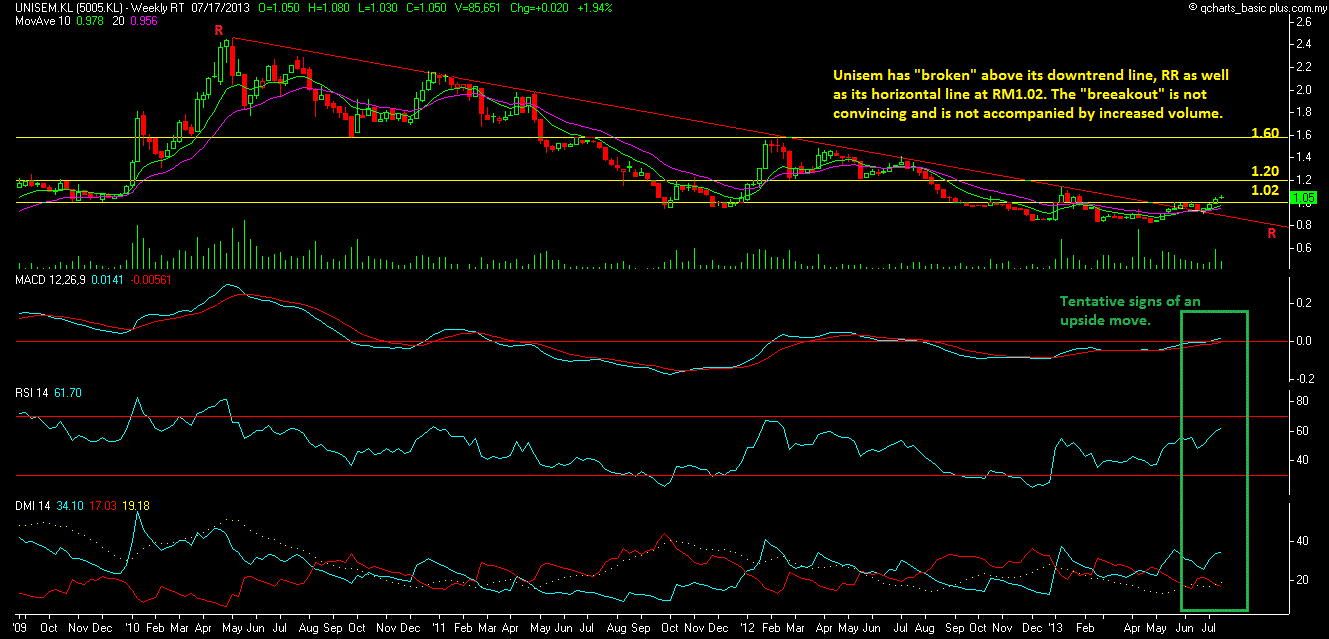
Unisem has broken above its downtrend line in late May. Since then, it has been moving in a sideway manner. Now it has inched above the horizontal line of RM1.02. The indicators are supportive of an upside move. The Philadelphia Semiconductor Index (SOX) has also moved up very convincingly.

Based on the improving technical outlook and SOX's technical strength, Unisem is poised for recovery. As such, Unisem could be a good stock for a trading BUY.


Chart 1: Unisem's weekly chart as at July 17, 2013_3.30pm (Source: Quickcharts)


Chart 2: SOX's daily chart as at July 16, 2013  (Source: Stockcharts)

Note:
In addition to the disclaimer in the preamble to my blog, I hereby confirm that I do not have any relevant interest in, or any interest in the acquisition or disposal of, Unisem.

Monday, July 15, 2013

Plenitu- broke above a strong horizontal resistance at RM2.30

Background

Plenitude Bhd (“Plenitude”) is involved in property development & investment. Its property development is likely to last for the next 10-15 years as it has a large landbank of about 2000 acres, located in Johor Bahru & the Klang Valley. For details of its property development projects & investment properties, see the two graphs below.


Graph 1: Plenitu's Property Development Projects


Graph 2: Plenitu's Investment Properties

Recent Financial results

Plenitu's financial performance dropped significantly in 2011-2012. It hit a bottom in QE30/9/2012 and slowly recovered in the past 2 quarters. The reason given for the decline in revenue due to low contribution from newly launched projects as they were in the early stages of construction (in early 2012). Revenue has picked up in the past two quarters as these projects have since begun to contribute to the Group's top-line and bottom-line. Nevertheless, the Group has yet to complete its hotel renovation and as such there was no contribution from this segment.


Table 1: Plenitu's last 8 quarterly results


Chart 2: Plenitu's last 27 quarterly results

Valuation

Plenitu (closed at RM2.38 today) is now trading at a PE of 14 times (based on last 4 quarters' EPS of 17 sen). At this PE, Plenitu is deemed fully valued.

Technical Outlook

Plenitu has just broken above its horizontal resistance at RM2.30. Based on technical projection, Plenitu may rose to a high of RM3.00-3.10.


Chart 2: Plenitu's weekly chart as at July 15, 2013 (Source: quickcharts)


Chart 3: Plenitu's monthly chart as at July 15, 2013 (Source: quickcharts)

Conclusion

Despite demanding valuation & improving-but-weak financial performance, Plenitu could be a stock for trading BUY as it has broken above its strong horizontal resistance at RM2.30.

Note:
In addition to the disclaimer in the preamble to my blog, I hereby confirm that I do not have any relevant interest in, or any interest in the acquisition or disposal of, Plenitu.

BDI, MISC & Maybulk- signs of bottoming?


With global trade remained subdued at a growth of 3.3% for 2013 (revised down from 4.5% by WTO), there is no strong reason to expect shipping rates to recover anytime soon. Nevertheless, BDI (Baltic Dry Index) staged a strong rebound in late June to early July (see Chart 1). The rebound was sufficiently strong to cause the index to break above its long-term downtrend line (see Chart 2). (Note: Charts 1 & 2 are  the exponential or semi-log charts). Is this a sign of a bottom for the shipping rates?


Chart 1: BDI's daily cahrt as at July 12, 2013 (Source: Investmenttools.com)


Chart 2: BDI's weekly chart as at July 12, 2013 (Source: Investmenttools.com)

The shipping rates for Very Large Crude Carriers (VLCCs) is strong at about USD25,000 a day - nearing the breakeven point for ship-owners - while the daily rate for Capesize dry bulk carriers has eased off to about USD6,000. The improved shipping rates for oil tankers is attributed to strong demand as refiners stock up on their crude requirements. If the recent rise is due to seasonal demand, we can expect shipping rates to normalize once the peak demand season is over. we will have to wait & see.

Meanwhile, we can see both MISC and Maybulk have rallied up from their recent low and tested their downtrend line. If they can surpass the downtrend line (at RM5.40 for MISC and RM1.90 for Maybulk), we can then expect both stocks to begin their bottoming phase & follow by recovery in the near future. Will that happen soon?

Chart 3: MISC's monthly chart as at July 15, 2013_12.30pm (Source: Quickcharts)


Chart 4: Maybulk's monthly chart as at July 15, 2013_12.30pm (Source: Quickcharts)

Note:
In addition to the disclaimer in the preamble to my blog, I hereby confirm that I do not have any relevant interest in, or any interest in the acquisition or disposal of, MISC & Maybulk.

Muhibah- rising like a phoenix!


Muhibah broke above its horizontal resistance at RM1.80 on July 5 (see Chart 1). Today it has broken above the psychological RM2.00 level. With these breakouts, Muhibah could rally all the way to the next string resistance at RM2.45.

Based on tehcnical consideration, Muhibah could be a trading BUY.


Chart 1: Muhibah's daily chart as at July 15, 2013_12.30pm (Source: Quickcharts)


Chart 2: Muhibah's weekly chart as at July 15, 2013_12.30pm (Source: Quickcharts)

Note:
In addition to the disclaimer in the preamble to my blog, I hereby confirm that I do not have any relevant interest in, or any interest in the acquisition or disposal of, LPI.

Wednesday, July 10, 2013

Coastal- full speed ahead!


In the stock market, you can learn the outcome of your prediction fairly quickly. The outcome can be either right or wrong. Sometimes, you don't get the outcome for a long time and that's really tiresome. In the case  of Coastal, the outcome was not as I had predicted. I opined that the recent sharp rally would not sustain and that the good level to take profit would be about RM2.55 (here).

Coastal has surpassed this resistance (which I have now revised to RM2.60). See Chart 1. If you look at the monthly chart (Chart 2), you can see that Coastal seems to be moving in a giant upward channel (SS-RR). If that channel still holds, then the possible resistance would be RM3.00-3.10.


Chart 1: Coastal-WA's daily chart as at July 10, 2013_10.20am (Source: quickcharts)


Chart 1: Coastal-WA's monthly chart as at July 10, 2013_10.20am (Source: quickcharts)

Note:
In addition to the disclaimer in the preamble to my blog, I hereby confirm that I do not have any relevant interest in, or any interest in the acquisition or disposal of, Coastal.

Tuesday, July 09, 2013

LPI- bottom-line jumped


Result Update

For QE31/3/2013, LPI's net profit increased by 11% q-o-q or 15% y-o-y to RM47 million while revenue increased by 9% q-o-q or 7% y-o-y to RM282 million. The overall improvement q-o-q was mainly "contributed by the general insurance segment which registered an impressive growth in underwriting profit of RM27.8 million to RM53.3 million as compared to the preceding quarter ended 31 March 2013. The growth in underwriting profit was mainly due to higher net earned premium and lower net claims incurred for the current quarter under review."


Table 2: LPIs last 8 quarterly results


Chart 1: LPI's last 30 quarterly results

Valuation

LPI (closed at RM15.64 yesterday) is now trading at a PE of 18.8 times (based on last 4 quarters' EPS of 83.4 sen). LPI's earning, which has moderated to single digit for the past two years, picked up again in the last 4 quarters. LPI's PEG ratio is about 1.2 times (based on average CAGR of 15% over the past 5 years). At this ratio, LPI is deemed fully-valued.

Technical Outlook

LPI is in an uptrend an dit appears to have broken above the line connecting its recent high. Will this breakout lead to an acceleration in the gradual uptrend? we will have to wait & see.


Chart 2: LPI's weekly chart as at July 9, 2013_10.30am (Source: Quickcharts)
 
Conclusion

Based of good financial performance and positive technical outlook, LPI is rated a HOLD. However, its upside is deemed limited unless the uptrend accelerates.


Note:
In addition to the disclaimer in the preamble to my blog, I hereby confirm that I do not have any relevant interest in, or any interest in the acquisition or disposal of, LPI.

JCY- the recovery may begin...

Technical Outlook

JCY is poised to enter into its next upleg. It has broken above its 40-week EMA line and its 10-week EMA line has cut above its 20-week EMA line. All three indicators are turning upward or positive. In particular, we can see that MACD is in positive territory and the ADX has turned upward (while the +DMI is trending higher while -DMI is trending lower). Good support to accumulate the stock is RM0.70.


Chart 1: JCY's weekly chart as at July 8, 2013 (Source: quickcharts)

Recent Financial Result

JCY's recent financial performance is still very poor. However, it is not getting worse and in this business, not getting any worse is not only a consolation prize; it is a tentative sign of reversal.


Table 1: JCY's last 8 quarterly results


Chart 2: JCY's last 12 quarterly results

Valuation

This is not a helpful indicator to look at when deciding to buy or to sell a cyclical stock like JCY. The confirmation you look for is illusive and comes too late.

Conclusion

Based on technical consideration, JCY could be a good stock for a trading BUY or even a medium-term buy.

Note:
In addition to the disclaimer in the preamble to my blog, I hereby confirm that I do not have any relevant interest in, or any interest in the acquisition or disposal of, JCY.

Engtex- a stock to watch

Technical Outlook

Engtex had a sharp rally over the past two months. It has just tested its strong horizontal resistance at RM1.15. On the way up, it broke through two strong horizontal resistance at RM0.98 & RM1.05. As you can see, the uptrend move is in a steep angle which raises concern of sharp pullback.


Chart 1: Engtex's weekly chart as at July 8, 2013 (Source: quickcharts)

Recent Financial Result

From the table below, you can see that Engtex's bottom-line rebounded in QE31/3/2013. In QE31/12/2012, it reported a small loss due to the increased construction cost in its two ongoing property development projects in Selayang and declining market prices for certain metal-related trading products and manufactured steel products. In QE31/3/2013, revenue and profit before tax increased q-o-q was mainly due to the strong market demand for certain metal-related trading products and steel manufactured products and the contribution from its two ongoing property development projects in Selayang. 


Table 1: Engtex's last 8 quarterly results

A closer look at the quarterly result by segments show that Engtex's increased revenue came from wholesale & manufacturing segments while increased operating results came from manufacturing & property development segments. The manufacturing segment is involved in the manufacturing of steel pipes, valves & fittings and other steel related products while the wholesale segment is a one-stop solution centre for pipe, valve, fittings, building & construction materials and steel products.


Table 2: Engtex's segmental results for 1Q2013 cf. 1Q2012

A quick look at Engtex's past 33 quarterly performance shows a steady growth in top-line but a flattish bottom-line.

 
Chart 2: Engtex's last 33 quarterly results

Valuation

Engtex (at RM1.12 yesterday) is now trading at a PE of 6 times (based on last 4 quarters' EPS of 18.7 sen). At this PE, Engtex is deemed inexpensive.

Conclusion

Based on undemanding valuation, Engtex can be a stock to consider for long-term investment. The product manufactured & sold by the group could enjoy increased demand due to the pick-up in economic activities (in particular, the increased activities in the O&G & water sectors). The downside is that the share price has rallied sharply in the past two months and its immediate upside is capped by a strong resistance. You may want to wait for a pullback before getting into this stock.

Note:
In addition to the disclaimer in the preamble to my blog, I hereby confirm that I do not have any relevant interest in, or any interest in the acquisition or disposal of, Engtex.

Friday, July 05, 2013

TAS- poised for uptrend?


TAS has just broken above its strong horizontal resistance of RM0.53. Its next resistance levels will be RM0.60 & RM0.70. Based on technical consideration, TAS could be a good trading BUY.


Chart: TAS's weekly chart as at July 5, 2013_9.20pm (Source: Quickcharts)

For QE28/2/2013, it reported a net profit of RM6.1 million on a revenue of RM41 million (go here for more). Its annualized EPS would be about 7.8 sen. At the present price of RM0.54, the stock is trading at a PE of 7 times, which is relatively expensive for a small cap. Its Price to Book is about 0.65 time (based on NTA of RM0.83 as at 28/3/2013).

Note: 
In addition to the disclaimer in the preamble to my blog, I hereby confirm that I do not have any relevant interest in, or any interest in the acquisition or disposal of, TAS.

Thursday, July 04, 2013

MYEG- Uptrend to continue

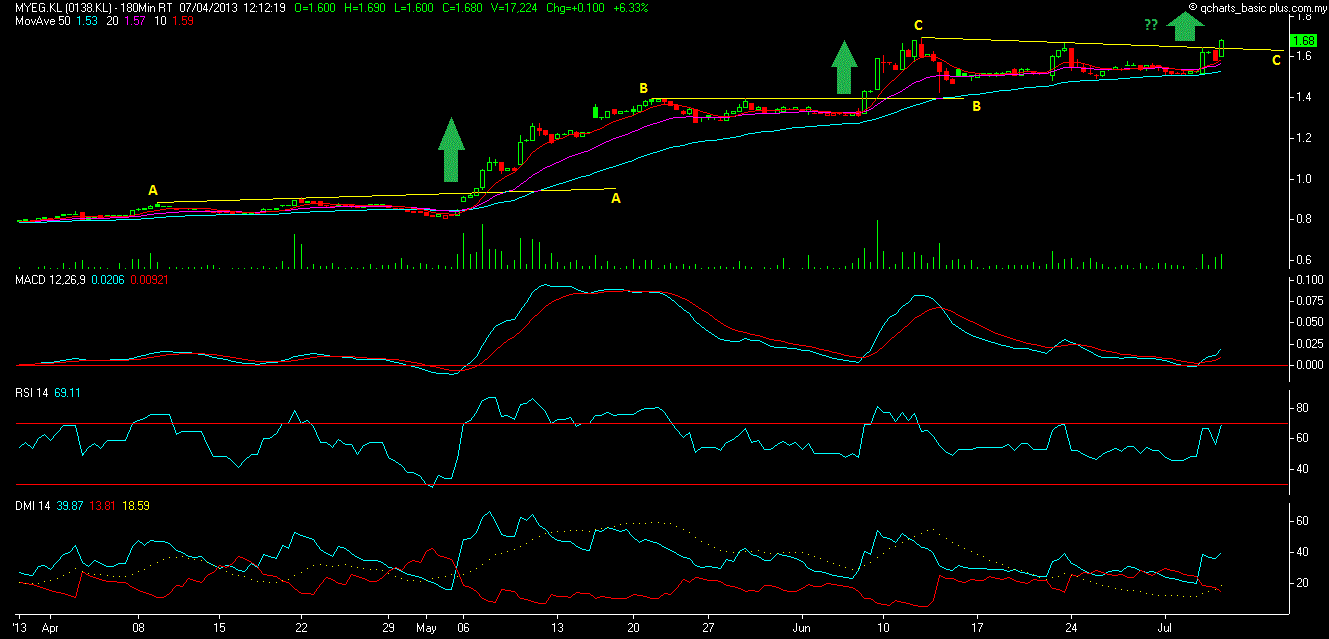
MYEG broke above its short-term downtrend line, CC (or, to the upside of the triangle) at RM1.65. With this breakout, MYEG is poised to continue its prior uptrend. Its next target price could be RM2.00.

Based on technical consideration, MYEG could be a good trading BUY.


Chart 1: MYEG's 180-min chart as at July 4, 2013_12.30pm (Source: Quickcharts) 

Note: 
In addition to the disclaimer in the preamble to my blog, I hereby confirm that I do not have any relevant interest in, or any interest in the acquisition or disposal of, MYEG.

Gtronic- Uptrend to continue


Technical Outlook

Gtronic broke above its horizontal resistance at RM2.20 on Monday. With this upside breakout, Gtronic is continuing on its uptrend.


Chart 1: Gtronic's daily chart as at July 4, 2013_9.15am (Source: Quickcharts)

Recent Financial Result

Gtronic's financial performance is deemed satisfactory for the past few quarters, albeit a dip in both top-line and bottom-line in QE31/3/2013. The profit margin at 13-14% is very encouraging as the company is deriving more businesses from the manufacture and sales of chip carrier quartz crystal products and optoelectronic products which carry higher profit margin.


Table 1: Gtronic's last 8 quarterly results

 
Chart 1: Gtronic's last 25 quarterly results

Valuation

Gtronic (closed at RM2.32 yesterday) is now trading at a PE of 13.6 times (based on last 4 quarters' EPS of 17 sen). At that PE mulitple, Gtronic is deemed fairly valued.

Conclusion

Based on good financial performance, Gtronic could be a good stock for long-term investment. Its upside potential is limited as it is trading at fair valuation. However, its technical outlook is bullish and that may justify a rating of a trading BUY for now.


Note: 
In addition to the disclaimer in the preamble to my blog, I hereby confirm that I do not have any relevant interest in, or any interest in the acquisition or disposal of, Gtronic.


LBS- Broke above its recent high of RM1.32


LBS has just broken above its recent high of RM1.32. The target for this developing move could be RM1.50-1.53. Based on technical consideration, LBS could be a good trading BUY. This breakout would be nullified if it drops back below the breakout level of RM1.32.


Chart: Gtronic's daily chart as at Jul 4, 2013_9.20am (Source: Quickcharts)

Note: 
In addition to the disclaimer in the preamble to my blog, I hereby confirm that I do not have any relevant interest in, or any interest in the acquisition or disposal of, LBS.

Wednesday, July 03, 2013

Coastal- the lagging warrant price could be a warning

On June 21, Coastal dropped 62 sen to close at RM1.48 at the close. After the highly unusual trade, the share price quickly recovered back above the RM2.00 on June 25 (two business days later). But, that's not all. The recovery keeps on going until it closed at RM2.28 on July 1- matching the recent highest close on June 5. Yesterday, it broke above the horizontal resistance of RM2.30 and chalked up 22 sen to close at RM2.50. What's up with Coastal?

It must be noted that the other 5 stocks- BJToto, HSPlant, BKawan, CBIP & TDM- that tumbled down on June 21 had also staged impressive recovery. But, their price recovery was only back to the pre-fall prices. So, the sharp rise in Coastal is unique to the stock.


Chart 1: Coastal's daily chart as at July 2, 2013 (Source: quickcharts)

And, yet the enthusiasm for Coastal is not shared by Coastal-WA, which traded only marginally higher. The reason for that could be due to the warrant's high premium of 45% (as it has an exercise price of RM3.18 and expiring in July 2016) . Still, elevated premium has not deterred speculators in the past when they thought the stock has room to go. Why now? This non-confirmation or divergence could be a warning. If there is something good for the stock, the buyers would not confine their trading only to the shares but also to the underlying derivative.

As such, I would urge caution to those trading on Coastal. The immediate resistance for the share is at the next horizontal line at RM2.55. At this mark, I think if you have the stock, you should take some profit.


Chart 1: Coastal-WA's daily chart as at July 2, 2013 (Source: quickcharts)

Note:
In addition to the disclaimer in the preamble to my blog, I hereby confirm that I do not have any relevant interest in, or any interest in the acquisition or disposal of, Coastal & Coastal-WA.

CPO- the downtrend line stays intact

CPO, which broke above its downtrend line in the middle of June, has once again fallen back below the downtrend line. While not expecting a rally in CPO prices, I was hoping that the breakout of the downtrend line would give some stability to CPO prices and a chance for plantation to stage a recovery. Let's wait & see.

 
Chart 3: CPO's weekly chart as at July 2, 2013 (Source: ifs.marketcenter)


Monday, July 01, 2013

Cypark- burdened by huge Receivables!


Background

Cypark Resources Bhd ('Cypark') is involved in three main businesses:
- Environmental Engineering (EE)
- Landscaping & Infrastructure (L&I)
- Renewable Energy (RE)

In term of revenue & segmental result, EE contributed 79% while L&I and RE contributed 12% & 9%, respective in 6-month ended 30/4/2013. This compared to the same period last year where EE, L&I and RE contributed 80%,18% & 1% of revenue, respectively while in term of segmental result, the contribution was 82%, 14% & 2%, respectively. 

We can see that RE has grown as a business segment since the start of 2013 due to the increase in the export capacity of green electricity from 8 MW to 19 MW. Before that, Cypark’s generating capacity came from only the 8-MW Integrated Renewable Energy Park in Pajam, N. Sembilan (which joined the TNB grid on March 28th, 2012). Now, another 3 renewable energy parks - located in Bukit Palong, Negri Sembilan; Rimba Terjun, Johor; and Kuala Perlis, Perlis- have also joined the grid. 

Recent Financial Results

For QE30/4/2013, Cypark's net profit increased by 60% q-o-q or 35% y-o-y to RM10.5 million while revenue increased by 16% q-o-q or 36% y-o-y to RM59 million. The increased bottom-line is attributable mainly to increase in renewable energy income (for reason explained above).


 Table: Cypark's last 8 quarterly results


Chart 1: Cypark's last 12 quarterly results

Financial Position

At first glance, Cypark's current ratio is acceptable at 1.5 times as at 30/4/2013 while its gearing ratio appears high at 1 time. However, Cypark's current assets mainly consisted of trade & other receivables totaling RM266 million. This means that Cypark's Receivable Collection period is about 441 days! At such high number, we have to ask how much of these is collectible. If 25% of this amount is not collectable, Cypark would have to write-off RM66.5 million- an amount equivalent to 39% of its Shareholders' Funds.

Valuation

Cypark (closed at RM1.99 last Friday) is now trading at a PE of 11 times (based on last 4 quarters' EPS of 18 sen). At this multiple, Cypark is deemed reasonably valued.

Technical Outlook

Cypark's share price has been range-bound between RM1.50 & RM2.00 for the past 2 years. Since May this year, it had broken above the RM2.00 mark a few times. However, these breakouts were not convincing and the stock keeps floating at the RM2.00 mark. Failure to stay above the RM2.00 mark would be negative as the stock would drop back into the trading range. Can Cypark recruit sufficient buying support to pull away from the RM2.00 mark? That's the big question.


Chart 2: Cypark's weekly chart as at July 1, 2013_12.30pm (Source: quickcharts)

Conclusion

Despite the good financial performance, Cypark's financial statements raised grave concern about its financial health in the form of extremely high trade receiveables. This is a cause for concern that the receivables may not be substantially collectible. While trading at fairly reasonable PE multiple, Cypark's share price movement shows no clear trend. This may reflect investors' concern about the company's financial position. As such, I would rate Cypark a HOLD.

Note:
In addition to the disclaimer in the preamble to my blog, I hereby confirm that I do not have any relevant interest in, or any interest in the acquisition or disposal of, Cypark.
SCGM- time to take some profit


Result Update

For QE30/4/2013, SCGM's net profit increased 33% q-o-q or 29% y-o-y to RM1.8 million while revenue dropped 13% q-o-q but rose 3% y-o-y to RM23 million. Bottom-line increased q-o-q due to higher margin which resulted from product sale price increase coupled with the consistent production efficiency & stable input cost, such as labor cost and raw materials cost (which was brought about by decline in commodities prices).


Table: SCGM's last 8 quarterly results


Chart 1: SCGM's last 17 quarterly results

Valuation

SCGM (closed at RM1.10 last Friday) is now trading at a PE of 11.5 times (based on last 4 quarters' EPS of 9.6 sen). For a small-cap stock, SCGM is deemed full valued.

Technical Outlook

SCGM broke above its intermediate downtrend line at RM0.70 in early June and shot up to close at RM1.10 last Friday. The sharp rise will only be sustainable if there is some exciting development ahead. Even if that were the case, the sharply higher prices may have factored in all the good news into the share price.


Chart 2: SCGM's weekly chart as at July 1, 2013_11.45am (Source: quickcharts)

Conclusion

Despite good financial performance, SCGM's recent sharp rise in share price has now put the stock at a demanding valuation. As such, I would revise my rating to TRADING SELL.

Note:
In addition to the disclaimer in the preamble to my blog, I hereby confirm that I do not have any relevant interest in, or any interest in the acquisition or disposal of, SCGM.

Thursday, June 27, 2013

Apollo- top-line & bottom-line slid


Result Update

For QE30/4/2013, Apollo's net profit dropped 23% q-o-q or 18% y-o-y to RM7 million while revenue was lower by 4% q-o-q or 3% y-o-y to RM55 million. Top-line & bottom-line dropped due to lower demand from both local and export markets as compared to the festive months in QE31/1/2013. The lower revenue and higher operating cost had resulted in a decrease in the current quarter’s profit.


Table 1: Apollo's last 8 quarterly results


Chart 2: Apollo's last 23 quarterly results

Valuation

Apollo (closed at RM4.05 yesterday) is now trading at a PE of 10 times (based on last 4 quarters' EPS of 40 sen). For a consumer stock, Apollo's valuation is deemed undemanding.

Technical Outlook

Apollo is in a gradual uptrend which accelerated over the past 6 months. This sudden acceleration may taper off and the stock may move in a sideway manner for a while. It shoudl however find good support at the psychological RM4.00 level.


Chart 2: Apollo's weekly chart as at June 27, 2013_10.00am (Source: Quickcharts) 

Conclusion

Despite poorer financial performance, Apollo is still an attractive stock with positive technical outlook. As such,, Apollo remained a good stock for a long-term investment.

Note:
In addition to the disclaimer in the preamble to my blog, I hereby confirm that I do not have any relevant interest in, or any interest in the acquisition or disposal of, Apollo.

Scientx- boosted by GW Plastics's contribution


Result Update

For QE30/4/2013, Scientx's net profit increased by 15% q-o-q or 50% y-o-y to RM30 million while revenue increased by 27% q-o-q or 52% y-o-y to RM345 million. The improvement performance was attributed to both its Manufacturing & Property divisions but the former  had contributed more due to the completion of the acquisition of GE Plastics in January 2013. This has caused a surge in the Manufacturing division's revenue to RM275 million from RM167 million recorded in the same quarter last year and the operating profit to jump from RM9 million to RM17 million. At the same time, the Property division's revenue also increased from RM60 million to RM70 million and its operating profit increased from RM17 million to RM23 million.


Table 1: Scientx's last 8 quarterly results


Chart 1: Scientx's last 31 quarterly results

Valuation

Scientx (closed at RM5.24 yesterday) is now trading at a current PE of 9.7 times (based on annualized EPS of 54 sen). At this PE, Scientx is deemed fairly attractive.

Technical Outlook

Scientx is in an uptrend which has picked up pace due to the acquisition of GW Plastics. The result from that acquisition may have been priced into the stock. If so, the share price may move sideway for a while before the next price direction kicks in.


Chart 2: Scientx's weekly chart as at June 26, 2013 (Source: Tradesignum)

Conclusion

Based on good financial performance, still attractive valuation and positive technical outlook, Scientx remains a good stock for long-term investment.

Note:
In addition to the disclaimer in the preamble to my blog, I hereby confirm that I do not have any relevant interest in, or any interest in the acquisition or disposal of, Scientx.

Tuesday, June 25, 2013

Genting is testing its intermediate uptrend line

Genting has corrected substantially to its intermediate uptrend line at RM9.95. If it can hold at this level (preferably above RM10.00), the stock may stage a decent rebound. For those with a need to trade, Genting could be an interesting trading BUY.


Chart 4: Genting's daily chart as at June 25, 2013 (Source: quickcharts)

Note:
In addition to the disclaimer in the preamble to my blog, I hereby confirm that I do not have any relevant interest in, or any interest in the acquisition or disposal of, Genting.

Blue Chip stocks that broke their uptrend line

The following stocks have broken below their intermediate uptrend line. They are Airasia, Maybank, Maxis & Carlsbg.


Chart 1: Airasia's daily chart as at June 25, 2013_12.30pm (Source: quickcharts)


Chart 2: Maybank's daily chart as at June 25, 2013_12.30pm (Source: quickcharts)


Chart 3: Maxis's daily chart as at June 25, 2013_12.30pm (Source: quickcharts)


Chart 4: Carlsbg's daily chart as at June 25, 2013_12.30pm (Source: quickcharts)

A stock that breaks its uptrend line simply signals that its uptrend may be in doubt. If the stock managed to recover above the uptrend line in a few days (preferably 2-3 days), then no harm is done. Failure to do so would mean that the stock would be changing its trend to sideway or even downtrend. Let's wait & see whether these stocks can stage a recovery over the next few days.

Note:
In addition to the disclaimer in the preamble to my blog, I hereby confirm that I do not have any relevant interest in, or any interest in the acquisition or disposal of, Airasia, Maybank, Maxis & Carlsbg.