Friday, May 20, 2016

Deleum: Down But Not Out Yet

Recent Financial Results (cr1.53, gr 0.93)

For QE31/3/2016, Deleum's net profit dropped by 26% q-o-q or 28% y-o-y to RM6 million while its revenue was mix- declined by 25% q-o-q but rose by 12% y-o-y to RM151 million.


Table 1: Deleum's last 8 quarterly results

Profits dropped q-o-q due to Power and Machinery segment recording a RM37 million drop in revenue which resulted in a RM9 million drop in profit contribution.


Table 2: Deleum's segmental performance for QE31/3/2016 & QE31/3/2015
 
Compared to last year, profits improved due to lower loss incurred by Integrated Corrosion Solution segment (from RM3.57 million to RM0.23 million).

 
Table 3: Deleum's segmental performance for QE31/3/2016 & QE31/12/2015

Despite the extremely challenging operating environment, Deleum was able to stay profitable due to steady revenue while sacrificing profit margin when necessary.


Chart 1: Deleum's last 38 quarterly results

Financial Position

Deleum's financial position is deemed acceptable as at 31/3/2016. Its current ratio stood at 1.5 times while total liabilities to equity has risen substantially to 0.9 times.

Valuation

Deleum (closed at RM1.16 yesterday) is now trading at a PE of 10.7 times (based on EPS of 10.8 sen for FY2012). At this PER, Deleum is deemed fair. Dividend payment has understandably dropped from 7.5 sen p.s. to 5.5 sen p.s.. At this reduced amount, the dividend yield is at 4.7%.

Technical Outlook

Deleum is poised to break above its intermediate downtrend line at RM1.20. See Chart 2.


Chart 2: Deleum's weekly chart as at May 19, 2016 (Source: Shareinvestor.com)
 
It is still trading above its long-term uptrend line at RM0.95-1.00. see Chart 3.


Chart 3: Deleum's monthly chart as at May 19, 2016 (Source: Shareinvestor.com)

Conclusion

Based on decent financial performance & position, reasoanble valuation & positive technical outlook, Deleum is good stock for long-term investment.

Note:
In addition to the disclaimer in the preamble to my blog, I hereby confirm that I do not have any relevant interest in, or any interest in the acquisition or disposal of, Deleum.

Tekseng: Powered by Solar

Background

Tekseng is a polyvinyl chloride (PVC) product and photovoltaic solar manufacturer. It has ventured into the production of solar panel. This new segment has overtaken its traditional PVC business and become its main revenue & profit generator.  See the change in diagram in revenue & profits from 1Q2015 to 1Q2016 below:


Diagram: Tekseng's segmental performance in 1Q2016 7 1Q2015

The group is now increasing its production capacity further. According to the Star newspaper report dated Feb 15, 2016 (here); the increased production capacity will be as follows:

  • It will spend RM237mil on its existing premise this year to add five more production lines to its existing four production lines 
  • This will increase the production capacity from 270 MW to 740MW by the third quarter
  • The increased production capacity is equivalent to about 156 million pieces of cell, valued at around US$250mil in today’s market.
  • The contribution of the solar panel business to 60% to 70% of the group’s revenue for 2016
Historical Financial Performance

In 2015, Tekseng's revenue & profits had risen substantially due to the contribution from the Solar division.


Chart 1: Tekseng's last 10 yearly results

Recent Financial Performance

QE31/12/2015 was the first time its revenue surpassed the RM100 million mark. Revenue rose again in QE31/3/2016 to RM131 million. In QE31/12/2015, its PBT surpassed the high of RM12.6 million in QE30/6/2014. Again, the recent quarter saw further increase in PBT to RM26.6 million.


Table 1: Tekseng's last 11 quarterly results


Chart 2: Tekseng's last 11 quarterly results

Financial Position

As at 31/3/2016, Tekseng's financial position is deemed satisfactory. Its current ratio stood at 1.57x while total liabilities to equity stood at 0.41x.

Valuation

Tekseng (closed at RM1.32 yesterday) is now trading at a trailing PER of 10.4x (based on last 4 quarters' EPS of 12.75 sen). Based on its rapid growth, Tekseng's PER is deemed low- making the stock fairly attractive.

Technical Outlook

Tekseng has risen quite substantially over the past 2 years, from a low of RM0.30 in 2014 to a recent high of RM1.40.


Chart 3: Tekseng's monthly chart as at May 19, 2016 (Source: ShareInvestor.com)

Recently, Tekseng has surpassed its high of RM1.30 in early January this year. This breakout is confirmed by MACD crossing above the MACd signal line and ADX hooking upward. It seems like Tekseng will continue with its prior uptrend.


Chart 4: Tekseng's weekly chart as at May 19, 2016 (Source: ShareInvestor.com)

Conclusion

Based on good financial performance, attractive valuation and bullish technical outlook, Tekseng is a good stock for long-term investment.

Note: 
In addition to the disclaimer in the preamble to my blog, I hereby confirm that I do not have any relevant interest in, or any interest in the acquisition or disposal of, Tekseng.

Thursday, May 19, 2016

Huayang: Earnings Dropped

Results Update

For QE31/3/2016, Huayang's net profit dropped 29% q-o-q or 28% y-o-y to RM21 million while revenue dropped 18% q-o-q or 16% y-o-y to RM128 million. Revenue and profits dropped due to weaker sales- as a result of subdued consumer sentiments.


Table: Huayang's last 8 quarterly results


Chart 1: Huayang's last 29 quarterly results 

We can see from the chart below that Huayang's unbilled sales has dropped back sharply last quarter. In QE31/3/2016, unbilled sales stood at slightly over 3.5 quarters.

 
Chart 2: Huayang's last 5 years of 4Q's sales book 

Valuation

Huayang (at RM1.82 yesterday) is trading at a PE of 4.3 times (based on last 4 quarters' EPS of 41.7 sen). At this PE, Huayang is still deemed fairly attractive.

Technical Outlook

Huayang is hanging onto to the horizontal line at RM1.75-1.80 very well.
 

Chart 2: Huayang's monthly chart as at May 18, 2016 (Source: ShareInvestor.com)

Conclusion

Despite weaker financial performance & thinner sales book, Huayang is still a good stock for long-term investment based on attractive valuation. 

Note: 
In addition to the disclaimer in the preamble to my blog, I hereby confirm that I do not have any relevant interest in, or any interest in the acquisition or disposal of, Huayang.

MBMR: Earnings improved sequentially

Results Update

For QE31/3/2016, MBMR's net profit rose 148% q-o-q but dropped 48% y-o-y to RM18 million while revenue dropped 15% q-o-q or 37% y-o-y to RM374 million. Revenue declined y-o-y, mainly due to 17%-drop in revenues in motor trading & one-off property contribution in the corresponding quarter last year. Profit before tax declined by 66%, as a result of l12%-decline in contributions from motor trading and a loss from the auto parts manufacturing of RM2.3 million (as compared to a profit of RM2.2 million last year).


Table 1: MBMR's last 8 quarterly results


Chart 1: MBMR's 40 quarterly results

Valuation

MBMR (closed at RM2.20 yesterday) is now trading at a PER of 14 times (based on last 4 quarters' EPS of 16 sen). While its PER is high, MBMR's PBR is low at 0.55 times. This makes the stock fairly attractive for investors with a long-term investment horizon.

Technical Outlook

MBMR has been in a downtrend after it peaked in 2013 at RM4.20. The decline may be arrested by its long-term uptrend line support at RM2.00-2.10.


Chart 2: MBMR's monthly chart as at May 18, 2016 (Source: ShareInvestor.com)

Conclusion

Despite the poorer financial performance, I would rate MBMR as a  HOLD due to its strong position in the local automotive sector, good management. and strong asset-backing per share

Note: 
In addition to the disclaimer in the preamble to my blog, I hereby confirm that I do not have any relevant interest in, or any interest in the acquisition or disposal of, MBMR

Kianjoo: Earnings dropped due to forex losses

Result Update

For QE31/3/2016, Kianjoo's net profit dropped by 49% q-o-q or 58% y-o-y to RM12 million while revenue was mixed- dropped by 7% q-o-q but up by 24% y-o-y to RM428 million. Revenue dropped q-o-q due to shutdown during New Year & CNY. PBT dropped due to higher forex losses of RM25.2 million.


Table 1: Kianjoo's last 8 quarterly results


Chart 1: Kianjoo's last 38 quarterly results
 
Valuation

Kianjoo (closed at RM3.14 yesterday) is now trading at a PE of 12 times (based on last 4 quarters' EPS of 25.87 sen). At this multiple, Kianjoo is deemed attractively valued. However, Kianjoo's earnings for the last 2 quarters has been quite disappointing. If this level of earnings persists, Kianjoo's PER will increase and its share price will take a knock.

Technical Outlook

Kianjoo is in a long-term uptrend line with support at RM3.10. The stock made recent high of RM3.40 in April 2014, November 2015 & April 2016. The last 2 times it went up to RM3.40 were not done with conviction. As such, I doubt the stock will revisit this high any time soon. Instead we should be concerned that the stock may not be able to hold onto its long-term uptrend line. A break below this uptrend line as well as the psychological level of RM3.00 could signal a reversal of its gradual uptrend that stretches back to 2010.


Chart 2: Kianjoo's weekly chart as at May 19, 2016_12.30pm (Source: ShareInvestor.com)

  
Chart 2: Kianjoo's monthly chart as at May 18, 2016 (Source: ShareInvestor.com)

Conclusion

Based on satisfactory financial performance, reasonable valuation & positive technical outlook, I would rate Kianjoo a HOLD for now. If the stock were to break below the RM3.00 mark, the rating would be revised to a SELL.

Note:
In addition to the disclaimer in the preamble to my blog, I hereby confirm that I do not have any relevant interest in, or any interest in the acquisition or disposal of, Kianjoo.

Wednesday, May 18, 2016

Amway: A One-off Earning Rebounce


Results Update

For QE31/13/2016, Amway's net profit increased by 255% q-o-q to RM18 million while turnover increased by 14% q-o-q to RM306 million. When compared to last year, net profit dropped by 51% while revenue slipped by 5%.

Revenue increased q-o-q mainly due to a pre-price increase buy up in  Q1 2016 and continued strong  momentum from the Group’s 40th Anniversary activities and incentives throughout 2016. Profit before tax increased by 164% q-o-q, due mainly to higher incentive provisions and other operating expenses in the preceding quarter.

Despite the positive spin, the y-o-y changes indicate that Amway is likely to have a weaker performance in FY2016 due to higher prices (as a result of stronger USD) and poorer consumer sentiment.


Table: Amway's last 8 quarterly results

From the Chart 1 below, we can see that profit margins are way below the historical level. As a result of this weaker performance, dividend payment has been slashed by as much as 50%.


Chart 1: Amway's P&L, Profit Margins & Dividend Payout last 35 quarterly results

Valuation

Amway (closed at RM9.20 yesterday) is trading at a trailing PER of 34 times (based on last 4 quarters' EPS of 27 sen). Dividend yield remains strong at 4.3%. If earnings continue to be weak, PER will rise and DY will drop further.  

Technical Outlook

Amway is still in a long-term uptrend line with support at RM8.00. Immediate support is not far from its current price; it will come from the horizontal line at RM9.00.

ry
Chart 2: Amway's monthly chart as at May 17, 2016 (Source: ShareInvestor.com)

Conclusion

Based on weaker financial performance and demanding valuation, Amway is rated a REDUCE for now. That rating will turn to SELL if the share price were to breach the uptrend line support at RM8.00.

Note:
In addition to the disclaimer in the preamble to my blog, I hereby confirm that I do not have any relevant interest in, or any interest in the acquisition or disposal of, Amway.

Carlsbg: Earning Dipped

Results Update

In QE31/3/2016, Carlsbg's net profit dropped 15.5% q-o-q to RM62.9 million on a 8%-increase in revenue to RM456 million. When compared to the corresponding quarter last year, net profit rose 33% while revenue increased by 6%.

Eevenue rose q-o-q due to CNY festive period. However, its PBT dropped due to higher operating expenses to run the CNY festive campaign and share of loss of RM1.17 million from its associate, Lion Brewery (Ceylon) PLC (as compared to a share of profit of RM5.26 million in QE31/12/2015). 


Table 1: Carlsbg's last 8 quarterly results

From Chart 1 below, we can see that Carlsbg's revenue, profits & profit margins are all grinding higher.


Chart 1: Carlsbg's last 42 quarterly results

Valuation

Carlsbg (closed at RM12.84 yesterday) is now trading at a PE of 17 times (based on an annualized EPS of 75.76 sen). At this PER, Carlsbg is deemed fairly valued. What's attractive about this stock is its high dividend yield of 6.0%.

Technical Outlook

Carlsbg is now leaning against its steep uptrend line, S2-S2 with support at RM12.70. A break of this uptrend line will bring forth more selling akin to the downtrend witnessed in May-December 2015.


Chart 2: Carlsbg's weekly chart as at May 17, 2016 (Source: ShareInvestor.com)

From the monthly chart, it looks like Carlsbg may continue with its prior uptrend- possibly after a pullback. After all, its MACD has crossed above its MACD signal line.


Chart 3: Carlsbg's monthly chart as at May 17, 2016 (Source: ShareInvestor.com)

Conclusion

Based on satisfactory financial results, fair valuation & constructive technical outlook, I would rate Carlsbg a HOLD for now.

 Note:
In addition to the disclaimer in the preamble to my blog, I hereby confirm that I do not have any relevant interest in, or any interest in the acquisition or disposal of,Carlsbg.

Tuesday, May 17, 2016

CMSB: Earnings plummeted but value emerged!

Background

Cahaya Mata Sarawak Bhd ('CMSB') is involved the manufacture of clinker and cement; construction and quarry operations; and provision of financial services, and property development, trading, and services. Due to its political connection, CMSB has grown steadily into one of the largest group in Sarawak. 

Results Update

Yesterday, CMSB announced a very disappointing set of result. Its net profit plummeted by 99% q-o-q or 98% y-o-y to RM1 million while revenue dropped by 32% q-o-q or 29% y-o-y to RM347 million.

The y-o-y drop in its revenue was lower revenue from the Construction Materials  & Trading Division and  Construction & Road Maintenance Division. Its PBT dropped by 76% to RM22.9 million in 1Q16 from RM95.0 million in  1Q15, on the back of lower revenue, lower gross  profit margin and share of substantial losses in associates. Most Divisions reported lower PBT, with the steepest decline contributed by the Cement Division (where PBT dropped y-o-y from RM29.37 million to RM9.62 million). To add to the slide, share of result of associates turned in a loss of RM16.16 million as compared to a profit of RM13.73 million previously. This is likely to be contributed by a 20%-owned associate, OM Sarawak, which is a ferrosilicon alloy (FSA) & manganese smelter.


Table: CMSB's last 11 quarters' P&L


Chart 1: CMSB's last 11 quarters' P&L  

Outlook for the under-performing divisions:

1) Clinker & Cement; Building Material; and Construction

These construction-related divisions should do well when the Pan Borneo Highway construction begin this year.

2) Ferrosilicon Alloy

The outlook for ferroalloy is uncertain due to challenging outlook for the steel industry (go here). The good news is the supply pipeline has slowed and the prices are off the bottom. In its reports to its shareholders, OMH (the controlling shareholder of OM Sarawak) seems to be cautiously optimistic (go here & here). Thus I believe that OM Sarawak may be able to report a better set of result in line with some improvement in the steel industry.

Overall, I believe CMSB had suffered abnormally bad quarter for the start of 2016. It may drag on to QE30/6/2016 if we factored in some delay due to the state election. Since the election is over, construction projects should pick up pace and the second half of the year should be better.

Financial Position

CMSB has a healthy financial position as at 31/3/2016. Its current ratio stood at 2.4 times while total liabilities to equity stood at 0.4 times.

Valuation

CMSB (closed at RM3.25 as at 12.30pm) has a PE multiple of 19 times (based the last 4 quarters' EPS of 17.2 sen). At this PER, CMSB is deemed overvalued.

Technical Outlook

CMSB's current decline came after it broke the important support from the horizontal line at RM4.70 - as highlighted earlier. The selldown was so strong that it went through the horizontal line at RM3.80. The next support is likely to come from the horizontal line at RM3.00. (Note: CMSB was trading at RM3.27 as at 3.17pm).


Chart 2: CMSB's weekly chart as at May 17, 2016_11.00 (Source: ShareInvestor.cm)


Chart: CMSB's monthly chart as at May 17, 2016_11.00(Source: ShareInvestor.cm)

Conclusion

The sharp drop in share price could be a good opportunity to get into a stock that will give an excellent exposure to one of the fastest growing state in Malaysia- Sarawak- as well as a safe proxy play for the on-going Pan Borneo Highway project. The company has a healthy financial position. Its financial performance has been very good until last quarter, which is likely to be an abnormality. Based on these, CMSB is a good buy now for long-term investment. 

Note: 
 
In addition to the disclaimer in the preamble to my blog, I hereby confirm that I do not have any relevant interest in, or any interest in the acquisition or disposal of, CMSB.

CSCSTEL: Earnings Plunged

Results Update

CSCStel's net profit dropped by 70% q-o-q to RM8.9 million on the back of a 8.9%-decline in revenue to RM221 million. When compared to the corresponding quarter last year, net profit rose 65% despite a 25%-drop in revenue.. Revenue dropped q-o-q due to substantial decreases in both the sales volume and selling prices of our steel products. Despite the substantial decreases in selling prices of our steel products, production cost has registered a marginal increase. This led to lower operating profit, which coupled with the absence of  the write back of RM16.9 million of doubtful debt in the preceding quarter, led to a sharp drop on profits.


Table: CSCStel's last 8 quarterly results


Chart 1: CSCStel's P&L for last 34 quarterly results

Valuation

CSCStel (closed at RM1.40 as at 12.30pm) has a PER of 9.0 times (based the last 4 quarters' EPS of 15.49 sen). Its dividend yield  is quite decent at 5.7%.

Technical Outlook

CSCStel rallied from a low of RM0.90 in September last year to a high of RM1.45 in the past 3 months. This morning, the share price retreated dropped to its 50-day EMA line support at RM1.38. Below that, it may find support at the horizontal line at RM1.35 & then RM1.25.


Chart 2: CSCStel's monthly chart as at Feb 22, 2016 (Source: ShareInvestor.cm)

Conclusion

Despite the weaker financial performance, CSCStel is rated a HOLD based on reasonable valuation.

Note: 
 
In addition to the disclaimer in the preamble to my blog, I hereby confirm that I do not have any relevant interest in, or any interest in the acquisition or disposal of, CSCSTEL.

Friday, May 13, 2016

Market Outlook as at May 13, 2016

The FBMKLCI dropped 24 points to 1625 as at 11:00am. The weekly chart shows the index has broken below its tentative uptrend line, SS. The MACD has crossed below the MACD signal line as well as entering the negative territory while -DMI has crossed above the +DMI (indicating downtrend) and ADX is poised to go above the 20-mark (when trend momentum picks up). With these negative readings from price action and indicators, FBMKLCI looks set to test the 1600 psychological support soon.


Chart 1: FBMKLCI's weekly chart as at May 13, 2016_11.00am (Source: Shareinvestor.com)

If we use Fibonacci ratios to analyze and project the index levels where we expect retracements to end, we can see that the index found support at the 23.6% level in early 2015. After that retracement level failed, FBMKLCI dropped to the next retracement level - the 38.2% level - where it remains for the past 9 months. The bearish reading from the weekly chart above means that the index is now breaking down below the 38.2% level. The next support will be a non-Fibonacci ratio of 50% level of retracement at 1500-1550. Below that, we have the Fibonacci ratio of 61.8% retracement at 1350-1400.


Chart 2: FBMKLCI's monthly chart as at May 10, 2016 13, 2016_11.00am (Source: Shareinvestor.com)

The sharp drop in the index this morning is likely to be related to new developments in the 1MDB saga (here and here); and another interest payment default by 1MDB (here). Like the political mess in Brazil, the endgame for 1MDB will play out for sometime. This will only serve to keep foreign funds away from our market (here) as well as dragging down the MYR and slowing down the economy.

In this bearish market, investors must exercise careful discretion in their investment & trading.

Thursday, May 12, 2016

PChem: Weaker Performance

Background

Petronas Chemicals Group Bhd (“PChem”) is an integrated petrochemicals producer, involved in the manufacturing, marketing and selling diversified petrochemical products, including olefins, polymers, fertilizers, methanol, glycols and other basic chemicals and derivative products.

Recent Financial Results

For QE31/3/2016, PChem's net profit dropped 16% q-o-q or 2% y-o-y to RM592 million while revenue slipped 9% q-o-q but remained relatively unchanged y-o-y at RM3.15 billion. Revenue dropped q-o-q due to lower average selling prices which had more than offset higher production & sales volume (with plant utilization rate at 92% as compared to 86% in QE31/12/2015). Despite 12%-increase in EBITDA - as a result of higher volumes & lower opex - PAT dropped by 15% q-o-q to RM671 million as preceding quarter result includes reversal of provision for decommissioning costs and higher interest income.


Table: PChem's last 8 quarterly results


Chart 1: PChem's last 23 quarterly results
 
Valuation

PChem (closed at RM6.41 yesterday) is now trading at a PER of 18.5 times (based on last 4 quarters' EPS of 34.6 sen). At this PER, PChem is fairly valued. It paid a dividend of 18 sen for FY2015 which translates to a DY of 2.8%.

Technical Outlook

PChem dropped back to its intermediate uptrend line, SS at  RM5.90-6.00 on May 10. That's just before the release of its latest quarterly result. While last quarter was weaker that the immediate preceding quarter, the result was not unexpected.


Chart 2: PChem's weekly chart as at May 11, 2016 (Source: ShareInvestor.com)


PChem should find support at RM6.00 from the uptrend line. However if it failed to stay above the RM6.00 mark, it may enter into a downtrend.


Chart 3: PChem's monthly chart as at May 11, 2016 (Source: ShareInvestor.com)

Conclusion

Based weaker financial performance and fairly valuation, PChem is rated as a HOLD. This rating is only valid if the share price remains above the RM6.00 mark.
 
Note: 
In addition to the disclaimer in the preamble to my blog, I hereby confirm that I do not have any relevant interest in, or any interest in the acquisition or disposal of, PChem.

Petdag: Earnings Improved

Result Update

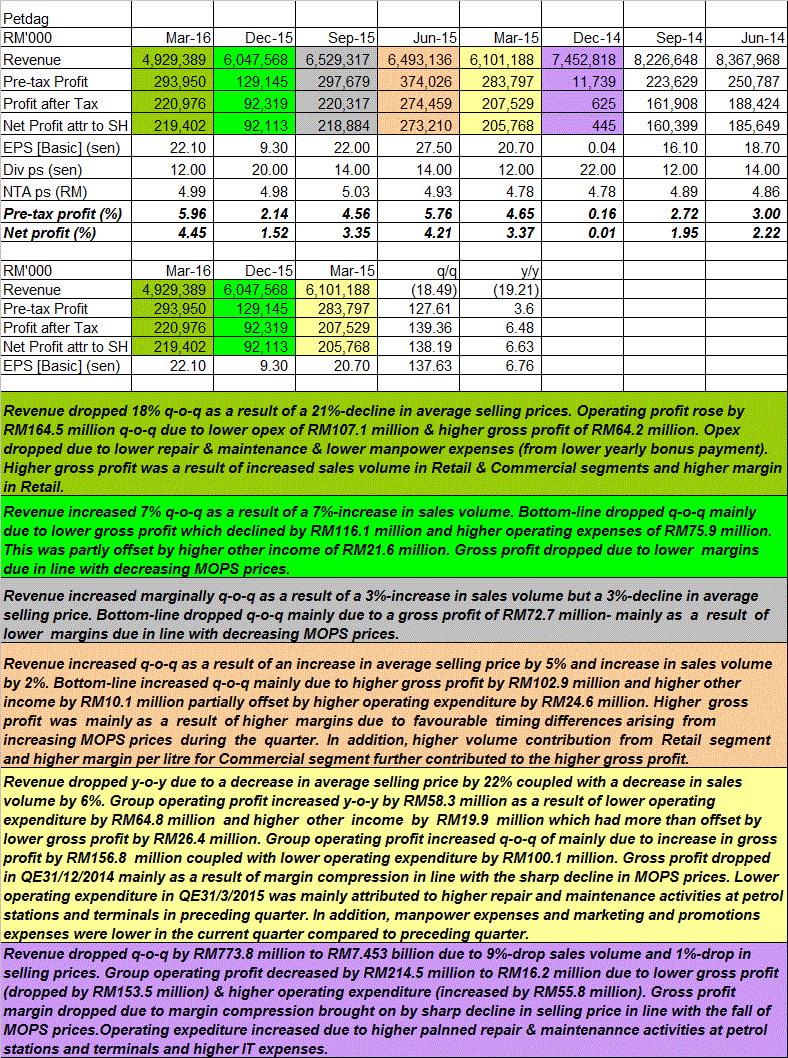
For QE31/3/2016, Petdag's net profit increased 138% q-o-q or 7% y-o-y to RM219 million while revenue dropped 18% q-o-q or 19% y-o-y to RM4.93 billion. Revenue dropped q-o-q as a result of a 21%-decline in average selling prices. Operating profit rose by RM164.5 million q-o-q due to lower opex (by RM107.1 million) & higher gross profit (by RM64.2 million). Opex dropped due to lower repair & maintenance & lower manpower expenses (from lower yearly bonus payment!). Higher gross profit was a result of increased sales volume in Retail & Commercial segments and higher margin in Retail.

Table: Petdag's last 8 quarterly results

 
Chart 1: Petdag's last 32 quarterly results

Valuation

Petdag (closed at RM22.70 yesterday) is now trading at a trailing PE of 28 times (based on last 4 quarters' EPS of 80.9 sen). Based on this PER multiple, Petdag is fully valued.However, its earnings rose by 46% last 4 quarters (after a drop of 24% in the preceding 4 quarters). If it can grow at 30%, the stock is fairly valued. I doubt it can do so in the current global economic environment.

Technical Outlook

Petdag broke its intermediator uptrend line, SS at RM24 in March. It may trade sideways at either the immediate horizontal line at RM22 or the next one at RM19. However, it is still above its long-term uptrend line support at RM20. See Chart 3.


Chart 2: Petdag's weekly chart as at May 11, 2016 (Source: ShareInvestor.com)


Chart 3: Petdag's monthly chart as at May 11, 2016 (Source: ShareInvestor.com)

Conclusion

Based the improved financial performance and positive long-term technical outlook , I maintain my rating for Petdag as a HOLD. Investors will have to live with its high valuation & the mildly negative medium-term outlook for now.

Note: 
In addition to the disclaimer in the preamble to my blog, I hereby confirm that I do not have any relevant interest in, or any interest in the acquisition or disposal of, Petdag.

Wednesday, May 11, 2016

Tunepro: Playing Catch-up

Results Update

For QE31/12/2015, Tunepro's net profit rose by 83% q-o-q or 4% y-o-y to RM24 million while revenue increased by 10% q-o-q or 5% y-o-y to RM133 million. Revenue increased q-o-q by RM11.6 million due to increase of RM7.1 million in gross earned premiums ("GEP") and RM4.5 million increase in investment income. Segmental profit increased by RM13.9 million q-o-q  due to a RM9.2 million in pre-tax profits in general insurance segment and RM3.6 million increase in general reinsurance segment

(Note: This quarterly result was announced on Feb 23. The next quarterly result was probably be announced next week.)


Table: Tunepro's last 8 quarterly results


Chart 1: Tunepro's last 16 quarterly results

Valuation

Tunepro (closed at RM1.48 as at 4:15pm today) is now trading at a PER of 16 times (based on last 4 quarters' EPS of 9.2 sen). At this PER, Tunepro is deemed fairly valued.

Technical Outlook

Tunepro broke above its downtrend line, RR at RM1.25 in late February. Since then, it has been trapped in a "flag formation" with resistance at RM1.48-1.50 and support at RM1.29-1.31. An upside breakout of this pattern - the resistance from the horizontal line at RM1.50 -  could signal the start of its uptrend. When the breakout happens, Tunepro will finally catch up with its "siblings"-- Airasia and AAX. Until then, the good level to buy into this stock is around RM1.30-1.35.


Chart 2: Tunepro's weekly chart as at Oct 5, 2015 (Source: ShareInvestor.com) 

Conclusion

Based on improved financial performance, reasonable valuation & mildly bullish technical outlook, Tuneins is a good stock for long-term investment. An upside breakout above RM1.50 could be the start of better days ahead for this stock.

Note:
In addition to the disclaimer in the preamble to my blog, I hereby confirm that I do not have any relevant interest in, or any interest in the acquisition or disposal of, Tunepro.