Tuesday, November 27, 2018

GENM: Twentieth Century Theme Park in Trouble


This morning, a second "earthquake" hit Genting Malaysia Bhd ("Genm"). Genm announced that it has filed legal proceedings against the 20th Century Fox group (the Fox group) and the Walt Disney Company in response to a notice issued by the Fox group, in which it terminated the agreement to develop the Twentieth Century Fox World theme park in Genting Highland. In addition, the Fox group has claimed approximately USD46.2 million (or the equivalent of approximately RM193.6 million) in accelerated payments.

GENM denies that the Fox group had grounds to terminate the agreement, and it has pursued cause of action against the Fox group and Disney for inducing breach of contract and for interference with contract. GENM intends to fully enforce its rights under the agreement, claim for the cost of its investments and consequential and punitive damages that in total will exceed USD1 billion. For more, go here.

Genm, which was hit by increased gaming tax in the latest Budget (here), saw its share price plunged to a low of RM3.18 on November 5. It recovered some lost ground over the past 3 weeks and was trading at around RM3.50-3.60. This morning, Genm plunged to a low of RM2.93 on the news of the termination of the agreement to develop the Twentieth Century Fox World theme park. At the time of writing this post, Genm was trading at RM3.18-3.19.

It is hard to see why these 2 giant enterprises would walk away from a profitable business arrangement unless there is a very serious dispute which they couldn't come to an amicable solution. The alternative is a huge loss for either one or both parties which would be the last thing that they would want to suffered from. Let the reality of a huge loss knock some sense into the heads of the management of these groups. 

Meanwhile, you can see that the immediate support for Genm will be around the RM3.00 mark. Its resistance will be RM3.30 while the next support will be about RM2.60.  

Genm is a good investment stock. Its investment horizon is now stretched a lot further ahead while its value is probably more appealing. Those who have the stock, should hold onto it. Those who are waiting to buy, you should do so gradually. Good luck!

Chart: Genm's weekly chart as at Nov 27, 2018_10.00am (Source: Malaysiastock.biz)

Monday, November 26, 2018

Market Outlook as at November 26, 2018

Over the past 4 weeks, market players were hoping that the market would stage a rebound after the main market barometer, FBMKLCI managed to stay above its long-term uptrend line, SS at 1675. Alas this hope was in vain, and with each passing days, it looks more likely that we may see a re-est of this uptrend line again. With the weakness abound everywhere, the market may not be able to stay above the uptrend line in next test.


Chart 1: FBMKLCI's weekly chart as at Nov 26, 2018_2.30 (Source: Malaysiastock.biz)

DJIA is still below its long-term uptrend line, SS.


Chart 2: DJIA's daily chart as at Nov 23, 2018 (Source: Stockcharts.com)

Commodity prices have weakened steadily over the past 2 months. CRB index has dropped from its recent peak of 202 in early October to 179 last Friday. If CRB were to go below 177, the index's uptrend would be over.


Chart 3; CRB's daily chart as at Nov 23, 2018 (Source: Stockcharts.com)

Brent index broke the long-term uptrend line at USD65.


Chart 4: Brent's daily chart as at Nov 23, 2018 (Source: Stockcharts.com)

Meanwhile, CPO is at a 6 years low!


Chart 5: CPO's weekly chart as at Nov 26, 2018_2.45 (Source: Investing.com)

Meanwhile a lot of people are planning to come out for a street celebration on December 8. The people behind this street party were once the people who wanted to ban or curb the Bersih demonstrations of yesteryear! The people who organized the Bersih demos are now among those who want to ban or curb the planned street party. The more things changed, the more they remain the same. And, the same applies to the stock market; the bearish market today will be followed by a bullish market a few quarters down the road. So, don't be disheartened! Make used of the down time to buy some good stocks. Good luck and stay safe!

Friday, November 23, 2018

Muda: A Surprisingly Strong 3Q

Results Update

For QE30/9/2018, Muda's net profit rose 118% q-o-q or 47-fold y-o-y to RM25 million while its revenue rose 8% q-o-q & y-o-y to RM381 million. Revenue rose mainly due to improvement in selling prices for industrial paper and paper packaging products. Compared to the corresponding quarter in previous year, higher segment profit in current quarter is mainly attributable to improvement in the selling prices and lower production cost in the Manufacturing Division with minor segment margin improvement in the Trading Division.


Table: Muda's last 8 quarterly results


Graph: Muda's last 50 quarterly results
 

Financial Position

Muda's financial position is deemed adequate with current ratio at 1.1 times and total liabilities to total equity at 0.9 time.

Valuation

Muda (trading at RM2.12 as at 3.15pm) is trading at a PE of 10.1 times (based on last 4 quarters' EPS of 20.88 sen). At this PER, Muda is deemed fairly attractive.

Technical Outlook

Mudahas been trading sideways for the past 6 months between RM1.50 & RM2.20. If it can break above RM2.20 (on the back of the current good performance), it may charge up to the May high of RM2.86-2.90.


Chart 1: Muda's daily chart as at Nov 23, 2018_2.50pm (Source: Malaysiastock.biz)

Looking at the monthly chart, Muda has strong resistance at RM2.35-2.50.


Chart 2: Muda's monthly chart as at Nov 23, 2018_2.50pm (Source: Malaysiastock.biz)

Conclusion

Based on good financial performance and attractive valuation, Muda is a good stock for long-term investment.

Note:

I hereby confirm that I do not have any direct interest in the security or securities mentioned in this post. However, I could have an indirect interest in the security or securities mentioned as some of my clients may have an interest in the acquisition or disposal of the aforementioned security or securities. As investor, you should fully research any security before making an investment decision.

Allianz: Earnings at New High

Result Update

For QE30/9/2018, Allianz's net profit increased by 11% q-o-q or 48% y-o-y to RM99.9 million while revenue is mixed- down 0.4% q-o-q but up 10% y-o-y to RM1.3 billion.

The Group’s operating revenue dropped 0.4% due to lower gross earned premiums by RM11.9 million. The Group’s PBT increased by 27.5% due mainly to higher contribution from life insurance segment.


Table: Allianz's last 8 quarterly results

Allianz's quarterly profits are at all time high!


Graph: Allianz's last 50 quarterly results

Valuation

Allianz (closed RM12.40 in morning session) is now trading at a PE of 11.8 times (based on last 4 quarters' EPS of 105 sen). At this PE, Allianz is deemed fairly attractive.

Technical Outlook

Allianz is in a long-term uptrend line, SS with support at RM9.00. Its uptrend accelerated from mid-2012 in uptrend line, S1-S1 with support at RM12.00.


Chart: Allianz's monthly chart as at Nov 23, 2018_11.00 (Source: Malaysiastock.biz)

Conclusion

Based on satisfactory financial performance (which is breaking into new high) and fairly attractive valuation, Allianz remains a good stock for long-term investment.

Note:
I hereby confirm that I do not have any direct interest in the security or securities mentioned in this post. However, I could have an indirect interest in the security or securities mentioned as some of my clients may have an interest in the acquisition or disposal of the aforementioned security or securities. As investor, you should fully research any security before making an investment decision.

Thursday, November 22, 2018

Boxpak: Finally Profits Came!

Background

Box-pak (Malaysia) Berhad ("Boxpak") is one of the leading corrugated carton and die cut trays manufacturers in the Asean region. It has 2 plants in Malaysia (Selangor and Johor), 2 plants in Vietnam ( Hanoi adn Ho Chi Minh) and 1 plant in Myanmar (opened this year). The group has 1400 employees and plant capacity of 175000 MT. It is a subsidiary of Kianjoo.


Result Update

For QE30/9/2018, Boxpak returned to the black after 7 quarters of losses. It made a net profit of RM1.2 million on a revenue of RM168 million. Group revenue rose 12.6% q-o-q mainly due to increased sales volume in Q3, 2018. Gross profit increased from RM11.3 million in Q2, 2018 to RM15.4 million in Q3, 2018, as a result of higher sales tonnage and improved margins contributed by higher selling prices. Consequently, the Group recorded a profit before taxation of RM1.0 million in Q3, 2018 as compared to a loss before taxation of RM2.8 million in Q2, 2018.


Table: Boxpak's last 8 quarterly results


Graph: Boxpak's last 54 quarterly results

Financial Position

Due to its rapid growth, Boxpak's financial position is a bit stretched. Liquidity is tight with current ratio at 1.0 time as at 30/9/2018 while gearing is elevated with total liabilities to total equity at 1.7 times.

Valuation

Boxpak (closed at RM0.87 yesterday) is now trading at a Price to Book of 0.40 time (based on NTA per share of RM2.15).

Technical Outlook

Boxpak has been sliding for the past 3 years, from a high of RM3.00 to a recent low of RM0.87. There is no sign yet that it is even attempting to make a bottom. That might change with the report of its first quarterly profit after nearly 2 years.


Chart: Boxpak's monthly chart as at Nov 21, 2018 (Source: Malaysiastock.biz)

Conclusion

Based on its return to profitability and deeply discounted share price, Boxpak could be a good stock for long-term investment. Share price recovery will come slowly and it will be dependent on the continuity and magnitude of its profitable financial performance.

Note:
I hereby confirm that I do not have any direct interest in the security or securities mentioned in this post. However, I could have an indirect interest in the security or securities mentioned as some of my clients may have an interest in the acquisition or disposal of the aforementioned security or securities. As investor, you should fully research any security before making an investment decision.

Wednesday, November 21, 2018

Astro: End of a Monopoly


Astro lost its monopoly over paid TV broadcasting (here). While existing competitors, such as HYPP TV, cannot match with Astro's current offering. However the real game-changer may be the high speed broadband which may bring out competitors from the left field that we have yet to factor in the impact.

Notwithstanding the above, I believe that this news has been discounted over the past few months. I think if Astro dropped to RM1.00, it could be a good long-term BUY.


Chart: Astro's weekly chart as at Nov 19, 2018 (Source: Malaysiastock.biz)

Monday, November 19, 2018

Kossan: Earnings Rebounded

Result Update

For QE30/9/2018, Kossan's net profit rose 21% q-o-q or 19% to RM54 million while revenue rose 16% q-o-q or 17% y-o-y to RM574 million. The improved performance was mainly attributable to the improved performance in the Gloves division.

The Gloves division’s revenue rose 16.98% to RM506 million, while PBT surged 36% to RM63 million. The improved performance was mainly attributable to the continued strong demand for the Group’s glove products with higher volume sold (+7.71%) arising from the new capacity coming onstream as well as existing plants running at full capacity, improved average selling prices (+1.8%), increased manufacturing and production efficiency and effective cost controls.

The TRPs division’s revenue rose 4% to RM46 million, while PBT decreased to RM7 million compared with RM8 million in the immediate preceding quarter. The lower performance was mainly attributable to the sales mix of lower margin products in the current quarter as compared with QE30/6/2018.


Table: Kossan's last 8 quarterly results


Graph: Kossan's last 49 quarterly results

Financial Position

Kossan's financial position as at 30/9/2018 is deemed healthy with current ratio at 1.9 times while gearing ratio was at 0.6 time.

Valuation

Kossan (closed at RM4.30 last friday) is now trading at a PE of 29.3 times (based on last 4 quarters' EPS of 14.7 sen). At this PER, Kossan is deemed fully valued.

Technical Outlook

Kossan's gradual uptrend is capped by the horizontal line at RM4.40.


Chart: Kossan's weekly chart as at Nov 16, 2018 (Source: ShareInvestor.com)

Conclusion

Based on good financial performance and financial position, Kossan is a good stock for long-term investment. However, its valuation is fairly demanding and there is little room for upside gain in the short to medium-term. Due to recovery in earning, Kossan's rating is now revised from SELL to HOLD.

Note: 

I hereby confirm that I do not have any direct interest in the security or securities mentioned in this post. However, I could have an indirect interest in the security or securities mentioned as some of my clients may have an interest in the acquisition or disposal of the aforementioned security or securities. As investor, you should fully research any security before making an investment decision.

Elsoft: Earnings Continued to Grow

Background

Elsoft Research Berhad ('Elsoft') is involved in the research, design and development of test and burn-in systems and application-specific embedded systems. It provides products for semiconductor, opto-electronic (such as image sensors) and automation industries (such as lighting).

Historical Financial Performance

Elsoft's top-line and bottom-line grew at a rapid pace in the past 6 years.


Graph 1: Elsoft's last 14 years' P&L

Recent Financial Performance

In QE30/9/2018, Elsoft's net profit rose by 13.6% q-o-q or 61.7% y-o-y to RM13.6 million while revenue rose 1.3% q-o-q or 47.1% y-o-y to RM24.5 million. Revenue rose q-o-q mainly due to greater demand from smart devices industry and continuous demand from automotive and general lighting industry. The increase in revenue led to increase in profits.


Table: Elsoft's last 8 quarters' P&L


Graph 2: Elsoft's last 24 quarters' P&L

Financial Position

Elsoft's financial position as at 30/9/2018 is deemed very healthy with current ratio at 4.6 times and gearing ratio at 0.2 time.

Valuation

Elsoft (closed at RM1.42 last Friday) is now trading at a PER of 17 times (based on last 4 quarters' EPS of 8.25 sen). Based on last 5 years' earnings CAGR of 30%, Elsoft's PEG ratio stood at only 0.6 time. At this PEG ratio, Elsoft is deemed fairly attractive for a growth stock.

Technical Outlook

Elsoft is in a gradual uptrend in the past 5 years- reflective of its steady earning growth.


Chart: Elsoft's weekly chart as at Nov 16, 2018 (Source: Malaysiastock.biz)

Conclusion

Based on good financial performance and position, attractive valuation and bullish technical outlook, Elsift is a god stock for long-term investment.

Note: 

I hereby confirm that I do not have any direct interest in the security or securities mentioned in this post. However, I could have an indirect interest in the security or securities mentioned as some of my clients may have an interest in the acquisition or disposal of the aforementioned security or securities. As investor, you should fully research any security before making an investment decision.

Thursday, November 15, 2018

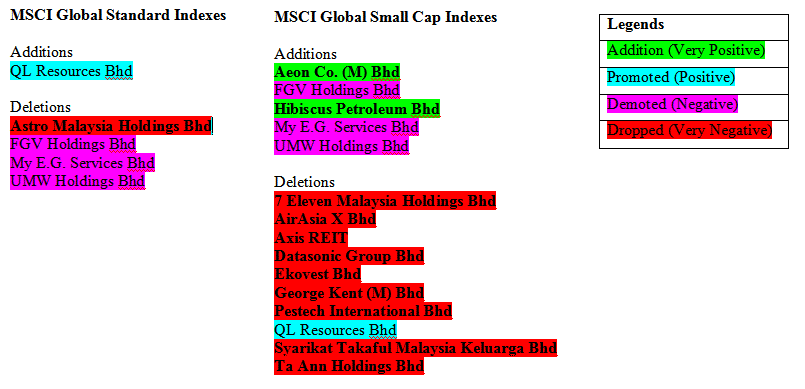
MSCI Global Indexes Component Stocks Changes

Yesterday, MSCI has announced changes in the component stocks from Malaysia in its Global Standard Index and Global Small Cap Index. For more, go here.

I have summarized the changes for your easy viewing below. This should not be taken as a guide for buying and selling immediately, but to understand the reasons behind some of the price rallies or declines in the market for the past few days or weeks. For example, I feel that QL is running ahead of its valuation while Astro is certainly very attractive at the current price. Should you buy into QL or sell out your Astro? I don't think you should do either one if you are investing long-term.


PTGTIN: Last Opportunity To Exit A Delisted Stock

Petaling Tin Berhad (Short name: PTGTIN & Stock code: 2208) has been taken private and delisted from the exchange on August 16, 2018 (here). I learned about it when a client inquired whether the stock has changed its name.

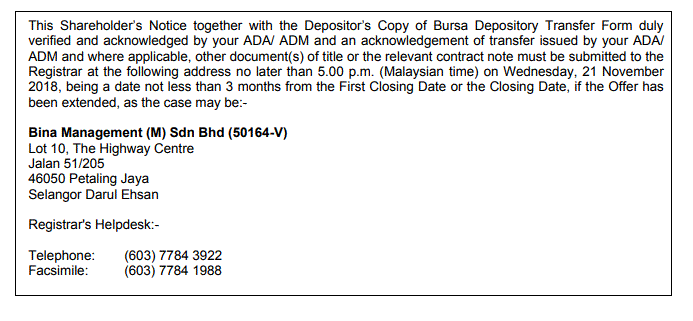
After further inquiry, I have learned that minority shareholders who are still holding the shares can still accept the offer to sell the shares to the acquirer. Follow the guidelines as outlined in the Notice-Section 223 of CMSA (here). In brief, the steps are:

1) Accept the offer as per Shareholder's Notice

2) Transfer the shares to the offer


3) Mail back the accepted offer and the transfer receipt to the registrar, BINA MANAGEMENT by November 21, 2018

Tuesday, November 13, 2018

QL: A Good Trading BUY

Last week, QL broke above its "horizontal resistance" at RM7.12-7.13 and rallied to a high of RM7.50. Last 2 days, the share price dropped back. Today it went below the horizontal resistance-turned-support of RM7.12-7.13. It went as low as RM7.07 before recovering. As at 10.40am, QL was trading at RM7.25.

From the chart below, you can see that QL has done a breakout/pullabck and then continued to go higher. The current "dance" is likely to be the same. Thus, QL could be a trading BUY now. A note of caution; do exercise careful discretion in all trading given the present weakness in the market. 

Chart: QL's daily chart as at Nov 13, 2018_10.15am (Source: Malaysiastock.biz)

Monday, November 12, 2018

DUFU: Earnings Soared

Result Update

For QE30/9/2018, Dufu's net profit rose 64% q-o-q or 201% y-o-y to RM19 million while revenue rose 14% q-o-q or 54% y-o-y to RM67 million. Revenue rose strongly q-o-q due to the continued strong demand in the HDD segment, economies of scale and together with the favorable USD exchange rates against MYR also attributed to the increase in profit before tax.


Table: Dufu's last 8 quarterly result


Graph: Dufu's last 21 quarterly result

Financial Position

Dufu's financial position as at 30/9/2018 is deemed healthy. Its current ratio and gearing ratio stood at 3.3 times and 0.3 times respectively.

Valuation

Dufu (closed at RM3.01 last Friday) is now trading at a trailing PER of 11.4x (based on last 4 quarters' EPS of 26.5 sen). At this PER, Dufu is deemed fairly attractive.

Technical Outlook

Dufu closed at a new all-time high of RM3.01 last Friday. This surpassed the previous closing high of RM2.81 on October 5. Since it is trading in all-time high territory, Dufu may go even higher in the next few weeks. On weakness, it may find support at RM3.00 & RM2.80. A break below RM2.80-2.81 could be a warning that the uptrend will be ending. We watch out for that.


Chart 1: Dufu's daily chart as at Nov 9, 2018 (Source: Malaysiastock.biz)


Chart 2: Dufu's monthly chart as at Nov 9, 2018 (Source: Malaysiastock.biz)

Conclusion

Based on good financial performance, healthy financial position and fairly attractive valuation, Dufu is a good stock for long-term investment.

Note:

I hereby confirm that I do not have any direct interest in the security or securities mentioned in this post. However, I could have an indirect interest in the security or securities mentioned as some of my clients may have an interest in the acquisition or disposal of the aforementioned security or securities. As investor, you should fully research any security before making an investment decision.

Tuesday, November 06, 2018

US Market Outlook: Uptrend is Over!

Since US markets began to recover on November 1, none of the main market barometers - DJIA, S&P500 & Nasdaq - has climbed above their violated uptrend lines. Normally I would give indices 1-3 days to recover from a breakdown. If they don't recover by then, the breakdown will unlikely to comeback up. Looking at the 3 charts below, I think the uptrend for US markets is likely over. We will wait for the next few weeks to see whether these markets will move sideways or go into downtrend. 

 Chart 1: DJIA's daily chart as at Nov 5, 2018  (Source: Stockcharts.com)


Chart 2: S&P500's daily chart as at Nov 5, 2018 (Source: Stockcharts.com)

 
Chart 3: Nasdaq's daily chart as at Nov 5, 2018 (Source: Stockcharts.com)

The end/pause of the rally in US markets may be a good news for other global markets. In the past, when markets are not so correlated, a downtrend in US markets may co-exist with uptrend in other markets. These days, US market downturn tends to lead to downturn in other markets. However, since the US markets have moved up for so long while emerging markets, like Malaysia, have been trending sideways or downward in the past 2-3 years, we may see a break of the tight correlation between global markets. If so, it may lead to foreign funds coming back to the emerging markets, such as Malaysia. Let's wait and see.

Happy Deepavali

I like to wish all who celebrate... A Happy Deepavali.


Source: Diwali wallpaper


Monday, November 05, 2018

Market Outlook as at November 5, 2018

Over the weekend, we have 2 pieces of good news; a sensible budget from our Finance Minister and a possible resetting of the trade war rhetoric between the US and China.

On the local front, I am encouraged by the following:
1. We are not strait-jacket by deficit reduction target; the Budget is relatively expansionary. 
2. There are additional or new taxes but they are not broad-based (except for sugar-tax on beverages). 
3. The proposed tax amnesty can be a good source of revenue.
4. There is effort made to address the need of house buyers - which may help to inject life into the property development and construction sectors.

This Budget, along with the final determination of legacy projects, should give clarity to the business & investing community to make their decision in 2019. Hopefully this will reinvigorate private investment - and boost our stock market. I am cautiously optimistic that FBMKLCI can go up to 1750.

Chart: FBMKLCI's daily chart as at Nov 5, 2018_9.30am (Source: Malaysiastock.biz)

On the foreign front, the unexpected happened. Trump has proposed a meeting with Xi prior to the G20 leaders summit in Buenos Aires (Nov 30 to Dec 1) plus a formal dinner with Xi after the summit (here). Whether these 2 events could lead to a resolution of the trade war between the US and China remains to be seen, but the motivation behind them suggests that Trump has begun to walk back his belligerent policies towards China. Once the relationship between both nations is on the mend, trades & investment will flow again. Global economy and stock market may be given a new leaf of life.

GENTING & GENM: Hit by Increased Gaming Tax

The announced Budget for 2019 include increase in gaming tax for casino from 25% to 35%. The last increase in gaming tax for casino was in 1998. In an article in 2016, The Edge entitled "Is Gaming Tax Next to Go Up" an analyst from HLIB opined that a 1%-increase in gaming tax will lower earnings by3% for GENM and 1% for Genting. Thus it is not unreasonable to project that the proposed 10%-increase will lead to a 30%-drop in earnings for GENM and 10% for Genting.

The drop in share price for Genting from RM7.20 to an intra-day low of RM6.35 is about 12%. That nearly mirrors the expected decline in earning of 10%. Its immediate support is at RM6.50.

Chart 1: Genting's monthly chart as at Nov 2, 2018_9.30am (Source: Malaysiastock.biz)

Similarly, the drop in share price for GenM from RM4.54 to an intra-day low of RM3.18 is 30%. That nearly mirrors the expected decline in earning of 30%. Its immediate support is at RM3.30.

Chart 2: GenM's monthly chart as at Nov 2, 2018_9.30am (Source: Malaysiastock.biz)

The trading of these 2 stocks will be very volatile in the next 1-2 days. If you are looking to invest for long-term, you can do so gradually. This huge increase in gaming tax took 20 years to land. It will take another 20 years for the next increase to take place. Thus, this may be a good opportunity to buy into a good growth stock. I believe either one of these stocks are good. However the bigger bang may come from GenM since its Genting Integrated Tourism Plan is expected to be completed in 1H2019 (including the Twentieth Century Fox Theme Park which will be ready in 2Q2019). Good luck.

Friday, November 02, 2018

Supermx: Earnings Rebounded

Result Update

For QE30/9/2018, Supermx's net profit increased by 265% q-o-q or 29% y-o-y to RM36 million while revenue rose 11% q-o-q or 18% y-o-y to RM367 million. Revenue rose q-o-q due to increased sales (on account of the added capacity from the remaining lines that were commissioned at its 2 newest plants in QE31/12/2017) and a stronger USD vs RM.

Meanwhile, EBITDA and PBT rose sharply by 79% and 125%. The improvement was attributed to a combination of factors including higher sales recorded, decreased costs from improved operational efficiency and some extraordinary one-off costs recorded in the preceding quarter which were not incurred in the current quarter. As mentioned earlier, there was also an extraordinary gain of RM6.5 million recorded in the current quarter arising from an insurance claim for consequential loss. (My take: If the extraordinary gain of RM6.5 million is deducted, profit before tax would be lowered to RM46.1 million. This is comparable to PBT for QE31/3/2018 of RM45.5 million. I avoid comparing with PBT for QE30/6/2018 which was depressed by unexplained extraordinary one-off costs. When compared to same quarter last year, QE30/9/2017, adjusted PBT did increase by 13%!)


Table : Supermx's last 8 quarters' P&L


Graph: Supermx's last 48 quarters' P&L

Financial Position

Supermx's financial position as at 30/9/2018 is deemed adequate with current ratio at 1.0 time while gearing ratio was at 0.7 times.

Outstanding Corporate Exercise

Supermx has declared a 1-for-1 bonus which is pending shareholders' approval at its EGM to be held on November 30.

Valuation

Supermx (closed at RM3.24 yesterday) is now trading at a PER of 19x (based on last 4 quarters' adjusted EPS of 17.45 sen). At this PER, Supermx is deemed fairly valued.

Technical Outlook

Supermx share price had a sharp pullback since it peaked at RM4.50-4.60 in July. The decline brought the share price back to its uptrend line, SS at RM2.60. Its immediate resistance will be at RM3.35 & then RM3.50.


Chart: Supermx's weekly chart as at Nov 1, 2018 (Source: Malaysiastock.biz)

Conclusion

Based on better financial performance, fairly attractive valuation, generous bonus issue ahead and mildly positive technical outlook, I am revising my rating for Supermx from a REDUCE to a BUY ON WEAKNESS.

Note:

I hereby confirm that I do not have any direct interest in the security or securities mentioned in this post. However, I could have an indirect interest in the security or securities mentioned as some of my clients may have an interest in the acquisition or disposal of the aforementioned security or securities. As investor, you should fully research any security before making an investment decision.

Penta: Earnings Remained Strong

Results Update

For QE30/9/2018, Penta's PBT increased by 23% q-o-q or 120% y-o-y to RM17 million while revenue rose 6% q-o-q or 30% y-o-y to RM108 million. Revenue rose q-o-q  due to increase in sales from automated manufacturing solution operating segment. The Group recorded a higher profit before taxation of RM29 million in the current quarter as compared to the profit before taxation of RM24 million in the preceding quarter, representing an increase of 18.4% which was in tandem with the increase in revenue.


Table: Penta's last 8 quarterly results

 
Graph: Penta's last 23 quarterly results 

Financial Position

Penta's financial position is satisfactory, with current ratio at 2.9 times and gearing ratio at 0.4 time.

Valuation

Penta (closed at RM3.25 yesterday) is now trading at a PER of 21 times (based on last 4 quarters' EPS of 15.35 sen). Based on an earning CAGR of 60% over the past 3 years, PENTA's PEG ratio is at 0.4 time. At this PEG ratio, Penta is deemed an attractive growth stock.

Technical Outlook

Last 4 weeks, Penta dropped below its uptrend line, SS at RM2.95 momentarily before recovering back up above RM3.00. Due to the sharp decline over the past 4 weeks, the stock's MACD has gone below the zero line, indicating possible downtrend. Since it has reclaimed its uptrend line, a bearish call is delayed.

Chart 1: Penta's daily chart as at Nov 1, 2018 (Source: Malaysiastock.biz)


Chart 2: Penta's weekly chart as at Nov 1, 2018 (Source: Malaysiastock.biz)

Conclusion

Based on good financial performance & financial position and attractive valuation, Penta is a good stock for long term investment. The mild weakness in its technical outlook will likely be worked out in the next few weeks, and thereafter the stock may continue with its prior uptrend.

Note: 

I hereby confirm that I do not have any direct interest in the security or securities mentioned in this post. However, I could have an indirect interest in the security or securities mentioned as some of my clients may have an interest in the acquisition or disposal of the aforementioned security or securities. As investor, you should fully research any security before making an investment decision.

Wednesday, October 31, 2018

Gtronic: Earning Continued to Grow

Result Update

For QE30/8/2018, Gtronic's net profit rose 153% q-o-q or 64% y-o-y to RM24 million while revenue rose 23% q-o-q or 1% y-o-y to RM88 million. Revenue & profits dropped q-o-q due to higher volume loadings from certain customers in the Group as well as better utilization of our operational resources and facilities.


Table: Gtronic's last 8 quarterly results

Quarterly profits rose to the high achieved in QE31/12/2017, despite a lower revenue. This was due to higher profit margins which may not be sustainable.


Chart: Gtronic's last 51 quarterly results

Financial Position

Gtroni's financial position is healthy with current ratio at 2.7 times and gearing ratio at 0.3 time.

Valuation 

Gtronic (closed at RM2.27 yesterday) is now trading at a PE of 37 times (based on last 4 quarters' EPS of 8.98 sen). At this elevated PER, Gtronic is deemed fully valued.

Technical Outlook

Gtronic has been correcting in the past 2 months after it broke its intermediate line, S1-S1 at RM2.60. It is now resting on the horizontal line at RM2.15.


Chart 1: Gtronic's daily chart as at Oct 30, 2018 (Source: Malaysiastock.biz)

Despite the near-term weakness, Gtronic is still comfortably above its long-term uptrend line, SS.


Chart 2: Gtronic's weekly chart as at Oct 30, 2018 (Source: Malaysiastock.biz)

Conclusion

Based on satisfactory financial performance and strong financial position, Gtronic can be a good stock for long-term investment. 

Note:

I hereby confirm that I do not have any direct interest in the security or securities mentioned in this post. However, I could have an indirect interest in the security or securities mentioned as some of my clients may have an interest in the acquisition or disposal of the aforementioned security or securities. As investor, you should fully research any security before making an investment decision.