Tuesday, February 22, 2022

GCB: Earnings Improved On Increased Sales Volume & Higher Profit Margins

Results Update

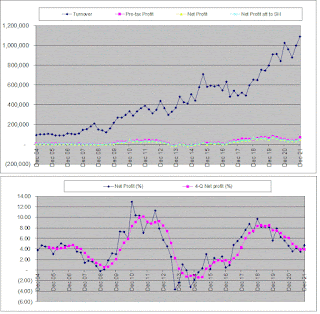
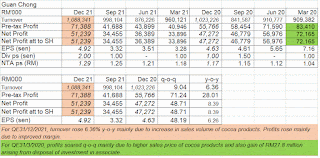
For QE31/12/2021, GCB's net profit rose 49% q-o-q or 8% y-o-y to RM51 million while revenue rose 9% q-o-q or 6% y-o-y to RM1.088 billion. Revenue rose y-o-y mainly due to increase in sales volume of cocoa products. Profits rose mainly due to improved margin.


Table: GCB's last 8 quarterly results


Graph: GCB's last 69 quarterly results

Financial Position

As at 31/12/2021, GCB's financial position is deemed fair while current ratio at 1.49 times and gearing ratio at 1.58 times. The high gearing was due to the suppliers' credit and bank borrowings taken to finance high inventory. The increase in inventory is attributable to weaker demand for cocoa butter in Europe and America. Cocoa butter is used in the production of chocolate, which has seen a drop in demand due to the pandemic. 

Valuation

GCB (closed at RM3.05 yesterday) is now trading at a trailing PER of 20 times (based on last 4 quarters' EPS of 15.03sen). At this PER, GCB is deemed fairly valued.

Technical Outlook

Since the start of 2021, GCB has been trading sideways between RM2.60 and RM3.20. Until a breakout is attained, GCB is expected to be range-bound.


Chart : GCB's weekly chart as at Feb 21, 2022 (Source: isaham.my)

Conclusion

Despite the improved financial performance, GCB will likely remain in a dull holding pattern until a technical breakout is attained. 

Note:

I hereby confirm that I do not have any direct interest in the security or securities mentioned in this post. However, I could have an indirect interest in the security or securities mentioned as some of my clients may have an interest in the acquisition or disposal of the aforementioned security or securities. As investor, you should fully research any security before making an investment decision. 

CSCSTEL: Earnings Soared On Higher Selling Prices

Results Update

For QE31/12/2021, CSCStel's net profit rose 290% q-o-q or 81% y-o-y to RM39 million while revenue rose 164% q-o-q or 45% y-o-y to RM532 million. The higher revenue was mainly due to significant increase in steel price, while the sales volume has reduced by 16.5% compared to preceding year’s corresponding quarter. Despite the decrease in sales volume, the Group reported a higher profit before tax of RM51 million in the current quarter, an increase of 77% compared with a profit before tax of RM29 million a year ago.


Table: CSCStel's last 8 quarterly results


Graph: CSCStel's P&L for last 57 quarterly results

Financial Position

As at 31/12/2021, CSCStel's financial position is deemed very healthy with current ratio at 6.2 times and gearing ratio at 0.18 time. It has net cash of RM162 million which is equivalent to RM0.44 per share.

Valuation

CSCStel (RM1.37 yesterday) has a PER of 5.9 times (based the last 4 quarters' EPS of 23.3 sen). If the cash balance of RM0.44 per share is deducted from the share price, CSCStel's PER would be reduced further to only 4 times. At this PER multiple, CSCStel is deemed very attractive. In addition, CSCStel has proposed a dividend of 14 sen for the current year- an increase of 100% over last year's dividend. At this dividend payout, CSCSTEL's dividend yield stands at 10.2%.

Technical Outlook

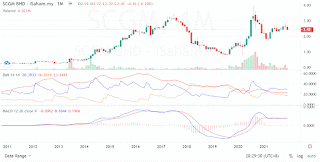
CSCStel has been trading in a wavy pattern. The share price appears poised to begin its next wave upwards.


Chart: CSCStel's monthly chart as at Feb 21, 2022(Source: isaham.my)

Conclusion

Based improved financial performance, healthy financial position and attractive valuation, CSCStel is a good stock for long-term investment.

Note:
I hereby confirm that I do not have any direct interest in the security or securities mentioned in this post. However, I could have an indirect interest in the security or securities mentioned as some of my clients may have an interest in the acquisition or disposal of the aforementioned security or securities. As investor, you should fully research any security before making an investment decision.

Monday, February 21, 2022

MSC: Earnings Soared As Tin Prices Made New Historical High

Results Update

For QE31/12/2021, MSC's net profit rose 121% q-o-q or 329% y-o-y to RM64 million while revenue rose 16.7% q-o-q or 9.7% y-o-y to RM255 million.

Revenue rose y-o-y due to higher tin price has negated the drop in refined tin production quantity as a result of continued operation disruption from the declaration of force majeure because of coronavirus-related disruption to production. The force majeure, which has been in force since 7 June 2021 (here), had been lifted on 20th December 2021 (here).

The Group recorded a profit before tax of RM85.2 million in 4Q 2021 as compared with RM20.5 million in 4Q 2020, mainly due to higher average tin prices of RM158,267 (4Q 2021) as compared with RM76,870 (4Q 2020) per metric tonne. 

The tin smelting segment recorded a profit before tax of RM13.9 million in 4Q 2021 as compared with RM17.8 million in 4Q 2020, mainly due to the absence of a reversal of inventories written down of RM21.1 million that was recorded in 4Q 2020. The tin smelting segment has also benefited from higher profit margins from sales of refined tin derived from its tin intermediates, and also from higher average tin prices. 

The tin mining segment recorded a profit before tax of RM57.9 million in 4Q 2021 as compared with RM11.4 million in 4Q 2020, mainly due to higher average tin prices in 4Q 2021. 

The Group’s share of results of associates and joint ventures recorded a net share of profit of RM1.0 million in 4Q 2021 as compared with a net share of loss of RM4.1 million in 4Q 2020.


Table: MSC's last 8 quarterly results


Graph; MSC's last 60 quarterly results

Tin Price Movement

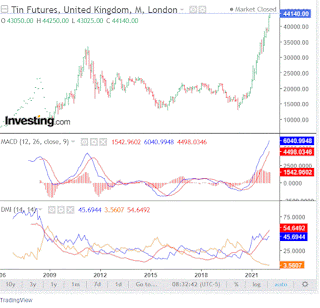
Like prices of many commodity, tin prices rose sharply after the start of the pandemic, from a low of USD13,350 in March 2020 to the current price of USD44,200. The sharp price rally is driven by increased demand for tin used in the production of electronics and electrical products coupled with constrained supply due to the COVID-19 pandemic. Any change in this supply & demand dynamics will have an impact on the prices of tin. 


Chart 1: Tin price chart as at 18 Feb 2022 (Source: Investing.com)

Valuation

MSC (closed at RM4.08 last Friday) is trading at a PE of 14 times (based on the last 4 quarters' EPS of 28.50 sen). As such, MSC is deemed fairly valued.

Technical Analysis

MSC rose sharply after it broke above the line connecting its peaks from 2011 to 2020 (R1-R1) at RM1.00 in December 2020 (see Chart 2). This bullish breakout sent the share price to a high of RM2.93 in February 2021. Thereafter, the share prices consolidated until October 2021 under the downtrend line, RR (see Chart 3). In middle of October 2021, MSC broke above the downtrend line, RR at RM2.50 and the uptrend resumes.

Chart 2: MSC's monthly chart as at Feb 18, 2022 (Source: isaham.my)


Chart 3: MSC's daily chart as at Feb 18, 2022 (Source: isaham.my)

Conclusion

Based on good financial performance, fair valuation & bullish technical outlook, MSC could be a good stock to ride the rally in tin prices. 

Note:
I hereby confirm that I do not have any direct interest in the security or securities mentioned in this post. However, I could have an indirect interest in the security or securities mentioned as some of my clients may have an interest in the acquisition or disposal of the aforementioned security or securities. As investor, you should fully research any security before making an investment decision.

Friday, February 11, 2022

BJFOOD: Earnings Soared!

Results Update

For QE31/12/2021, BJFood's net profit rose by 234% q-o-q or 250% y-o-y to RM38.9 million while revenue rose 45% q-o-q or 57% y-o-y to RM273 million. BJFood explained its improved performance as fllows:

The Group registered a revenue of RM272.75million and pre-tax profit of RM60.28 million in the current quarter ended 31 December 2021 as compared to a revenue of RM174.1 million and pre-tax profit of RM16.8 million reported in the previous year corresponding quarter. With the resumption of interstate and overseas travel starting from 11 October 2021, together with the calendar year end festive sales and Christmas season, the Group recorded a significant increase in revenue. The higher revenue was mainly due to higher same-store-sales growth particularly from Starbucks cafe outlets. The Group's pre-tax profit jumped 259% to RM60.28 million against RM16.79 million in the previous year corresponding quarter. The significant increase was in tandem with the higher revenue recorded in the current quarter as well as improved performance from the KRR operations in Malaysia.


Table: BJFood's last 8 quarterly results


Graph: BJFood's last 20 quarterly results 

Valuation

BJFood (closed at RM2.40 yesterday) is now trading at a PE of 11 times (based on last 4 quarters' EPS of 21.33 sen). At this PER, BJFood is deemed vary attractive.

(Note: At 9:20 am, BJFood was trading RM3.01- a gain of 61 sen!! At this price, BJFood's PE is at 14 times. Notwithstanding the sharp rise, BJFood is still deemed fairly attractive.)

Technical Outlook

BJFood has broken above its trading range at RM2.30. This upside breakout, coupled with the previous long-term "irregular" downtrend line, RR breakout (see the weekly chart below), means that the stock could be finally free to trend higher.

Chart 1: BJFood's daily chart as at as at Feb 10, 2022 (Source: iSaham.my)


Chart 2: BJFood's weekly chart as at Feb 10, 2022 (Source: iSaham.my)

Conclusion

Based on improved financial performance, attractive valuation and bullish technical outlook, I revise BJFood's rating from a HOLD to a BUY. 

Note:
I hereby confirm that I do not have any direct interest in the security or securities mentioned in this post. However, I could have an indirect interest in the security or securities mentioned as some of my clients may have an interest in the acquisition or disposal of the aforementioned security or securities. As investor, you should fully research any security before making an investment decision.

Tuesday, February 08, 2022

BAT: Green Shots of Recovery

Result Update

For QE31/12/2021, BAT's net profit dropped 9.4% q-o-q or 2.0% y-o-y to RM71.5 million while revenue rose by 40.6% q-o-q or 30.5% y-o-y to RM862 million.

As explained in its press release, BAT "performed remarkably in 2021 with the volume growing for the first time since 2002, profit growing for the first time since 2015 and strong quarter on quarter improvement in our financial performance. The growth momentum comes from an increase in volume and share of market which, in turn, improved revenue and profit from operations. The volume increase was mainly due to the reduction in the tobacco black market by 6.1% compared to FY2020. This growth in volume led to a revenue of RM2.6 billion for FY2021 compared to RM2.3 billion in FY2020 (growth of 14%) and a profit from operations of RM411 million compared to RM346 million in FY2020 (increase of 19%)."


Table 1: BAT's last 8 quarterly results

In fact, the improved performance was seen mainly in the last quarter, ie. QE31/12/2021. See the sharp spike in the revenue in the graph below.


Graph: BAT's last 53 quarterly results

However, BAT's bottomline did not increase because the company made additional charge-off in the form of inventories write-down and restructuring expenses. See the table below.

Table 2: Changes in P&L items in QE31/12/2021, QE30/9/2021 & QE31/12/2020

Valuation

BAT (closed at RM12.40 today) is now trading at a PER of 12.4 times (based on the last 4 quarters' EPS of 99.8 sen). BAT has paid out quarterly dividend payment totaling of 98 sen over the past 4 quarters; thus giving a Dividend Yield of 7.9%. Based on the above, BAT is considered fairly attractive for a recovery play.

Technical Outlook

BAT dropped from its high of about RM74.00 in Dec 2014 to a low of RM9.20 in Mar 2020. In the last 12-13 months, the share prices were well-supported at the horizontal line at RM12.20-12.30. 


Chart 1: BAT's monthly chart as at Feb 8, 2022 (Source: isaham.my)

Chart 2: BAT's daily chart as at Feb 8, 2022 (Source: isaham.my)

Conclusion

Based on an improved financial performance, BAT is a good stock for a recovery play. This is notwithstanding its technical outlook remains bearish as the downtrend has yet to be reversed.

Note:
I hereby confirm that I do not have any direct interest in the security or securities mentioned in this post. However, I could have an indirect interest in the security or securities mentioned as some of my clients may have an interest in the acquisition or disposal of the aforementioned security or securities. As investor, you should fully research any security before making an investment decision.

Wednesday, December 29, 2021

SCGM: Earnings Continued To Stall

 Results Update

In QE31/10/2021 (2Q22), SCGM's net profit dropped 6% q-o-q or 19% y-o-y to RM7.8 million while revenue increased 5% q-o-q or 19% y-o-y to RM72.5 million. 

For 2Q22, the Group revenue increased 5% q-o-q "resulting from higher sales of F&B packaging and extrusion sheet. Local sales increased by 4.7% to RM49.207 million from RM46.990 million in 1Q22 while export sales increased by 4.6% to RM23.335 million from RM22.312 million in 1Q22. Despite the 4.7% increase in Group revenue, the Group’s profit before tax decreased marginally by 0.1% to RM9.872 million in 2Q22 compared to profit before tax of RM9.880 million in 1Q22 mainly due to costs of COVID-19 vaccination exercise and related expenses for workers and loss on foreign exchange during the current quarter. The Group recorded 5.6% lower net profit of RM7.825 million in 2Q22 versus RM8.289 million in the preceding quarter due to higher deferred tax expenses".

 
Table: SCGM's last 8 quarterly results

 
Graph: SCGM's last 51 quarterly results

Financial Position

SCGM's financial position is deemed healthy with current ratio at 1.65 times while gearing ratio is elevated at 0.55 time.

Valuation

SCGM (closed at RM2.42 yesterday) is now trading at a PE of 15X (based on the last 4 quarters' EPS of 16.54sen).  At this PE, SCGM is deemed fairly attractive.

Technical Outlook

SCGM's medium-term uptrend may have ended after the share prices went below the uptrend line, SS. Its next support should be at the horizontal line at RM2.35.


Chart 1: SCGM's daily chart as at  Dec 28, 2021 (Source: iSaham.my)


Chart 2: SCGM's monthly chart as at  Dec 28, 2021 (Source: iSaham.my)

Conclusion

Despite the weaker financial performance, SCGM is still a good stock for long-term investment based on healthy financial position & fair valuation,

Note:

I hereby confirm that I do not have any direct interest in the security or securities mentioned in this post. However, I could have an indirect interest in the security or securities mentioned as some of my clients may have an interest in the acquisition or disposal of the aforementioned security or securities. As investor, you should fully research any security before making an investment decision.

Friday, December 10, 2021

Topglov: Revenue & Profits Have Landed

Result Update

For QE30/11/2021 (1QFY2022), Topglov's net profit dropped 69% q-o-q or 92% y-o-y to RM186 million while revenue dropped 25% q-o-q or 67% y-o-y to RM1.584 billion. The Group’s weaker quarter-on-quarter performance for 1QFY2022 was mainly attributed to declining average selling prices ('ASPs') and higher operating costs as a result of lower utilisation rates, while raw material costs reduced at a much slower pace in comparison to glove ASPs, thereby impacting profit. Raw material prices for the quarter ended 1QFY2022 have reduced from 4QFY2021, with average natural latex concentrate prices reducing by 8% from RM5.54/kg to RM5.09/kg, whilst nitrile latex price fell 19% from USD2.21/kg to USD1.79/kg.


Table: Topglov's last 8 quarterly results

Looking at the quarterly result graph below, we can see that revenue, profits and even profit margins are now lower than QE31/5/2020. Not surprisingly, dividend is lower than that paid out in QE31/5/2020.


Graph: Topglov's last 77 quarterly results

The perennial qustion - are we there yet? - has to be asked. To be frank, I don't think anyone has a quick answer. The mismatched between increased supply and reduced demand could lead to a period of lower ASPs. If that's a serious problem, imagine what would happen if a price war broke out. You may ask why would anyone engage in a price war at a time like this. The need to increase sales to match the increased capacity, would drive the players to engage in a price war! 

The price war would lead to lower revenue & lower contribution. With lower contribution, you would not be able to cover the increased overhead expenses from the increased capacity. You may note that Topglov's Property, Plant & Equipment has risen by 42% from RM2.874 billion as at May 2020 to RM4.090 billion as at November 2021. 

Based on the above, I think the prospect of further decline in profit cannot be ruled out.

Financial Position

As at 30/11/2021, Topglov's financial position is deemed healthy with current ratio at 2.0 times and Total liabilities to Total equity at 0.30 time.

Valuation

Topglov (closed at RM2.18 as at 4.05 pm) is now trading at a PE of 23 times (based on annualized EPS of 9.28 sen). That's a fair valuation if we assumed that Topglov's profit remains steady at current level. As discussed above, the prospect of lower profits or even losses, could not be discounted.

Its planned listing on the HKEX may give an indication of the management's "outlook" for the share price (here). The amount it plans to raise from its proposed Hong Kong listing is about RM2.21 billion. The number of shares it will issue for the Hong Kong listing remains at 793.5 million shares. That means the IPO price will be about RM2.785 per share. However, things are moving so fast that the expected share price may not be achieved. Nevertheless, this is an indication of the internal thinking of its management.

Technical Outlook

Topglov's downtrend after peaking in October 2020, is still intact. The immediate support is the psychological level of RM2.00.


Chart: Topglov's daily chart as at Dec 10, 2021 (Source: isaham.my)

Conclusion

Based on the current poor financial performance and industrial outlook, Topglov is a stock to be avoided.

Note:

I hereby confirm that I do not have any direct interest in the security or securities mentioned in this post. However, I could have an indirect interest in the security or securities mentioned as some of my clients may have an interest in the acquisition or disposal of the aforementioned security or securities. As investor, you should fully research any security before making an investment decision.
Wednesday, June 30, 2021

HIAPTEK: Earnings Remained Strong

Results Update

For QE30/4/2021, Hiaptek's net profit rose 117% q-o-q or 12-fold to RM66 million while revenue was mixed- down 7% q-o-q but up 100% y-o-y to RM330 million. Its revenue decreased by 7% q-o-q due to lower sales volume for both the Trading and Manufacturing divisions attributable to the Chinese New Year holidays in February 2021. Despite the lower revenue, Profit from Operations increased by 67% to RM63.53 million due to higher steel prices and cost optimization efforts undertaken during the quarter under review. "Together with an improved contribution from the JV entity of RM19.81 million in the current quarter as compared to RM2.88 million in the immediate preceding quarter, the Group recorded a 114% improvement in Profit before Tax to RM80.16 million in 3Q2021 as compared to RM37.42 million in 2Q2021". 

The company is positive on its outlook, post lockdown, given the strength of steel prices and the JV entity’s continuous investments in plant and equipment to achieve cost efficiencies. The JV entity’s first 200,000 tonnes of coke oven plant is expected to complete by the second half of 2021, in which substantial cost savings can be achieved. For more, go here.


Table: Hiaptek's last 8 quarterly results


Graph: Hiaptek's last 70 quarterly results

Financial Position

Hiaptek's financial position as at 30/4/2021 is deemed satisfactory with current ratio at 1.63 times and gearing ratio at 0.49 time. 

Valuation

Hiaptek (closed at RM0.565 yesterday) is now trading at a PE of 6.8 times (based on last 4 quarters' EPS of 8.29 sen). At this PE ratio, Hiaptek is deemed fairly attractive.

Technical Outlook

Hiaptek has broken above its long0term downtrend line at RM0.20 in September 2020.

 
Chart 1: Hiaptek's monthly chart as at Jun 29, 2021 (Source: Kenanga BTX)

Hiaptek then rallied to a high of RM0.70 in May 2021. Like other steel stocks, Hiaptek has corrected substantially in the past few weeks. However it is still in an uptrend line with support at RM0.52. 


Chart 2: Hiaptek's weekly chart as at Jun 29, 2021 (Source: Kenanga BTX)

Conclusion

Based on improved financial performance & financial position, reasonable valuation and mildly bullish technical outlook, Hiaptek is a good stock for medium-term investment.

Note:

I hereby confirm that I do not have any direct interest in the security or securities mentioned in this post. However, I could have an indirect interest in the security or securities mentioned as some of my clients may have an interest in the acquisition or disposal of the aforementioned security or securities. As investor, you should fully research any security before making an investment decision.