Monday, May 31, 2010

Kenmark plunged into the abyss

Kenmark dropped 45 sen to 33 sen on May 27. This morning, it dropped 16 sen to 10.5 sen before the trading in the stock was suspended as at 10.09am . What could cause the sharp selldown for this quiet stock?


Chart 1: Kenmark's 5-min chart as at May 31, 2010_10.10am (Source: Quickcharts)

There are two things to note:

1. The company is due to file its results for QE31/3/2010 today. Could there be a failure to file in its financial statement?

2. Looking at the last reported results for QE31/12/2009, we can note a few issues that are plaguing Kenmark. They are:
i) An outstanding legal judgment obtained by O-stable Sdn Bhd against the company in September 2009. The judgment sum payable was RM1.58 million. The company has filed an appeal against the court decision.
ii) The company has high bank borrowings, comprising short-term debts of RM88.8 million and long-term debts of RM53.4 million. While bank borrowings looks high, as a percentage of shareholders' funds, it stood at 0.4 times only.
iii) The company's trade receivables stood at RM248.7 million, representing 71% of Total Assets. Debtors turnover period stood at 350 days (based on annualized revenue of RM258.7 million). The debtors increased alarmingly over the past 3 years- by RM52.4 million in FY2008; RM36.6 million in FY2009; and RM87.4 million in 9-month ended 31/12/2009.
iv) For the 9-month ended 31/12/2009, Kenmark purchased Fixed Assets of RM45.2 million. This plus the increase in Debtors of RM87.4 million was financed by Trade Creditors of RM77 million, which increased by 306% from RM34.7 million to RM106.3 million.

I believe that Kenmark is now wrestling with the issue of the quality of its debtors. If half of the debtors are not collectible, Kenmark's shareholders' funds would drop to RM230 million. Its bankers & trade creditors- with amount owing of RM142.2 million & RM106.3 million respectively- may be feeling very uncomfortable now? For more on Kenmark's financial statement for QE31/12/2009, go here.

The above scenario raised the question on whether Kenmark can continue as a going concern. If this question was not in the investors' mind, then Kenmark appears to be trading at ridiculously cheap multiples, with Price to Book of only 5% or Price to Earning of 1.4 times (based on NTA per share of RM1.95 as at 31/12/2009 & annualized EPS of 7 sen).

Technically, Kenmark is now trading at the all-time low. It has even surpassed the low of about RM0.45 recorded during the Asian Financial Crisis. The market action is screaming of bad times ahead for this stock.


Chart 2: Kenmark's month chart as at May 27, 2010 (Source: Tradesignum)

Technical analysts would caution against catching a falling knife. At 10 sen, many investors would find Kenmark to ignore. How low can it go, they may ask. That I cannot answer.

Latest Update

Kenmark Bhd was suspended this morning as news that its managing director, James Hwang, a Taiwanese, went absent without leave spread in the market. In addition, key company executives, including deputy general manager Goh Kim Chon as well as the finance and administration manager, have also resigned. For more, go here.

Thursday, May 27, 2010

Allianz- a cheap insurer

Results Update

Allianz has just announced its results for QE31/3/2010. Its net profit dropped by 61.5% q-o-q but increased by 14.5% y-o-y to RM23.2 million while turnover increased by 19.4% q-o-q or 28.2% y-o-y to RM626 million. The drop in the net profit on a q-o-q basis was partly due to Allianz's practice of valuing its Life Funds' liabilities at its financial year end, with surplus taken into its book in the 4th quarter. As a result, Allianz booked in a surplus of RM12 million from its Life Funds in QE31/12/2009. In addition, its profit for QE31/3/2010 was also impact by a lower underwriting results from its general insurance subsidiary.


Table 1: Allianz's last 10 quarterly results


Chart 1: Allianz's 17 quarterly results

Valuation

Allianz (closed at RM4.82 yesterday) is now trading at a PER of 6.1 times (based on last 4 quarters' EPS of 79 sen). At this PER multiple, Allianz is deemed very attractive.

Technical Outlook

Allianz has been in an uptrend since October 2009. Its uptrend line accelerated from SS to S1-S1. In the past 4 weeks, Allianz dropped to its 40-week SMA line support at RM4.82. If this support is broken, it may test its immediate uptrend line at RM4.45-50.


Chart 2: Allianz's weekly chart as at May 26, 2010 (Source: Tradesignum)

Conclusion

Based on good financial performance & attractive valuation, Allianz could be a good stock for long-term investment. However, after a strong rally and the current uncertainty in the overall market, one should be more circumspect about buying into any stock in a substantial manner.

Mamee reported higher profit & higher sales

Results Update

Mamee has just announced its results for QE31/3/2010. Its net profit increased by 16.2% q-o-q or 13.6% y-o-y to RM12.0 million while turnover increased by 11.9% q-o-q or 26.0% y-o-y to RM115 million. The improved performance was attributable to higher sales, both domestically & overseas, and the return to profitability for its Chinese subsidiary.


Table 1: Mamee's last 8 quarterly results


Chart 1: Mamee's 16 quarterly results

Valuation

Mamee (closed at RM2.78 yesterday) is now trading at a PER of 9.3 times (based on the last 4 quarters' EPS of 30 sen. At this multiple, Mamee is considered quite attractive.

Technical Outlook

Mamee has been in an uptrend since November 2009. Its uptrend line accelerated twice, from SS to S1-S1 and then S2-S2. In the past 2 weeks of market selloff, Mamee broke below its accelerated uptrend line, S2-S2. It may consolidate further & may test the 20-week SMA line at RM2.76 or the next accelerated uptrend line, S1-S1 support at RM2.70.


Chart 2: Mamee's week chart (on Log scale) as at May 26, 2010 (Source: Tradesignum)

Conclusion

Based on good financial performance & attractive valuation, Mamee could be a good stock for long-term investment. However, after a strong rally- punctuated by a breakdown of its immediate accelerated uptrend line- and the current uncertainty in the overall market, one should be more circumspect about buying into Mamee in a substantial manner for now.

Keuro broke above its downtrend line!

Keuro has a train to catch. Despite the turmoil of the past 2 weeks, Keuro has been rising after breaking above its strong horizontal resistance at RM0.51-52. This morning, it has been testing its long-term downtrend line resistance at RM0.77-78. As at 11.55am, it traded at RM0.795, which means that it has just surpassed that downtrend line. The next resistance will be the horizontal line at RM0.85 & then the psychological resistance at RM1.00.

The only significant announcement made by Keuro is that it had disposed of 134,925,600 ordinary shares, representing 5.21% of the shares capital of Talam Corporation Berhad between 9 March 2010 and 12 May 2010.


Chart: Keuro's week chart as at May 26, 2010 (Source: Tradesignum)

Keuro had received a notification dated 24 May 2010 from Tan Sri Dato’ (Dr) Ir. Chan Ah Chye @ Chan Chong Yoon, its President/Chief Executive – Executive Director that he intends to deal in the securities of the Company (go here). Chan Ah Chye has direct & indirect interest in 143.6 million shares of Keuro. I think it is very likely that he is planning to sell into the current sharp rally.

While the upside breakout above the downtrend line should be viewed as a bullish development, this breakout came after a sharp rise of more than 50% over the past 4 days. Any trade based on this breakout could be a risky proposition. A failure to stay above the breakout level could lead to a sharp correction. Avoid Keuro despite the bullish breakout. If you have position in Keuro, sell if it failed to stay above RM0.78.

Wednesday, May 26, 2010

Golden Cross, another technical idea

I have posted yesterday that all of the major markets have crossed below their 200-day Simple Moving Average (SMA). It is generally accepted that when a stock or an index crossed below its 200-day SMA, that stock or index has entered into a bear market. Being a general rule, there are occasions when the stock or index actually rebounded & continued onto its prior trend. We have witnessed this in our FBM-KLCI in August 2007. Then, our market suffered a sharp selloff which begun in w/e 27/7/2007 and in a mere 4 weeks, FBM-KLCI lost about 18% to hit a low of 1141 (in w/e 17/8/2007). The current selloff started only last week & todate, FBM-KLCI has lost about 7%.


Chart: FBM-KLCI's week chart as at May 24, 2010 (Source: Tradesignum)

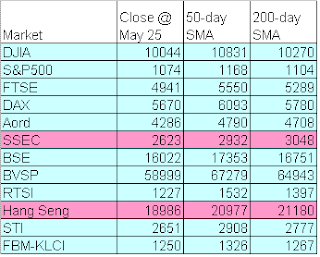
The other indicator that market strategists like to follow is the golden cross, which is normally defined as the crossover of the faster 50-day SMA & the slower 200-day SMA. If the 50-day SMA cut below the 200-day SMA, the market outlook is deemed bearish and vice versa. We can see an example of a bearish golden cross in our market in March 2008 and a bullish golden cross in May 2009 (see the chart above). Despite the recent sharp selloff, our FBM-KLCI has yet to record a bearish golden cross. If you looked at the table below, you will see that only two major markets have recorded a bearish golden cross- SSEC & HSI.


Table: Main market indices as at May 25, 2010 (Source: Stockcharts for all indices, except FBM-KLCI where I rely on Tradesignum)

No systems or indicators can be the final arbiter of the state of the market. One has to take into account many factors. The golden cross may give a more accurate reading than the crossing of the 200-day SMA but that level of certainty is purchased at a price of ceding more profits or taking on more losses if you have acted earlier. Similarly, a system or indicator that gives earlier reading may not be better because it would be more prone to whipsaws or false readings.

This article is intended to introduce the concept of the golden cross. I seldom looked for golden cross and the crossing of the 200-day SMA in order to call a potential market top or bottom because they are extremely slow systems. By the time you get the reading, the prices would have gone up or down substantially. In fact, some technicians go as far as using the golden cross as a contrarian indicator. I can see their logic but I would prefer not to do so. For a good reading on the generally accepted usage of the golden cross, check out this post.

Finally, I like to say that no technical indicator or system is foolproof. Technical analysis deals with probability. Even when the signals or readings are bearish, the outcome may 'surprise' to the upside. That's a fact of life that all market players have to accept.

AJI's net profit plunged

Results Update

AJI has just announced a disappointing set of results for QE31/3/2010. Its net profit dropped by 84% q-o-q or 18% y-o-y to RM1.5 million, while turnover increased by 18% y-o-y but slipped 1% q-o-q to RM71.9 million. The drop in net profit was attributable to higher input & energy cost & more competitive pressure, which resulted in higher expenditure incurred for sale promotion.


Table 1: AJI's last 8 quarterly results


Chart 1: AJI's 19 quarterly results

Valuation

The problem for AJI is in the forecasting of its future earning, which ranges from the low of 5.44 sen achieved last quarter to the high of 15.67 sen achieved in QE31/12/2009. If we assumed an average of 9.1 sen, then AJI, which closed at RM4.16 yesterday, would be trading at a PER of 11 times. Based on the sharp drop in commodities prices in the past few weeks, I believe that the average EPS of 9.1 sen is reasonable.

Technical Outlook

AJI should have a good psychological support at RM4.00. The next support is about RM3.40-50, based on horizontal line support at RM3.50 & uptrend line support at RM3.40.


Chart 2: AJI's week chart as at May 24, 2010 (Source: Tradesignum)

Conclusion

Based on poor financial results, AJI's share price would come under selling pressure for the next few weeks. If the share price were to drop to RM3.40-50 level, AJI would be an attractive stock for long-term investment, trading at PER of about 9.3 times.

Tuesday, May 25, 2010

All main stock markets broke below the 200-day SMA

One of my client spoke to me about the market just now. He was not convinced about a potential rebound in the market (as discussed in my recent posting). Being a non-technical person, he asked what's the most reliable, yet simple technical indicator of a bull or a bear market. Traditionally, the 200-day SMA line is the most widely-used indicator of the state of the stock market. If the index is below the 200-day SMA line, the market would be deemed in a bearish market or vice versa. Based on this, I look through the main stock markets & tabulated the finding below. Except for DAX & our FBM-KLCI, all the major stock markets had broken below the 200-day SMA line as at yesterday. As at 3.30pm, both our FBM-KLCI & DAX have also broken below the 200-day SMA line, with FBM-KLCI trading at 1250 & DAX at 5671. With all the global markets trading below their 200-day SMA line, I agree with my client that we have entered into a bear market & we must avoid the temptation of nibbling in the falling market.


Table: Main market indices as at May 24, 2010 (Source: Stockcharts for all indices, except FBM-KLCI where I rely on Tradesignum)

MBMR's results vroomed UP!

Results Update

MBMR Measat has just announced its results for QE31/3/2010. Its net profit increased by 78% q-o-q or 327% y-o-y to RM40 million while turnover increased by 12% q-o-q or 48% y-o-y to RM364 million. The improved performance was attributable to strong demand for passenger & commercial vehicles as well as the strengthening of the RM against the Japanese Yen, which lifted the operating margin. For the last 8 quarters' results & the highlights of the results for QE31/3/2010, see Taable 1 & 2 below.


Table 1: MBMR's last 8 quarterly results


Table 2: MBMR's financial highlights for QE31/3/2010 (Source: Link to the filling on Bursa Malaysia)


Chart 1: MBMR's 16 quarterly results

Valuation

MBMR (closed at RM2.70 yesterday) is now trading at a PER of 6.6 times (based on last 4 quarters' EPS of 41 sen). Price to Book is about 0.70 time. At these multiples, MBMR is deemed very attractive.

Technical Outlook

MBMR broke above its downtrend line at RM2.35 in October 2009. Thereafter, MBMR rose steadily- initially on a gradual uptrend line ('SS') and later accelerated (as per 'S1-S1'). The stock is now sliding back & it has just broken below S1-S1 at RM2.65. Its next support will be the horizontal line at RM2.50 and then the uptrend line, SS support at RM2.40.


Chart 2: MBMR's week chart as at May 17, 2010 (Source: Quickcharts)

Conclusion

Based on satisfactory financial performance and attractive valuation, MBMR could be a good stock for long-term investment. A good entry level could be at RM2.40-50.

Monday, May 24, 2010

Market Outlook as at May 24, 2010

Our FBM-KLCI opened with a sharp drop to hit an intra-day low of 1264 at 9.50 am. That was surprising given the positive close for US & European markets. Looking at Chart 1, we can see that DJIA had a fairly successful 'Test of the Low' which failed to make a new low & closed with a gain of 125 points. While FTSE did make a new low, it closed with an bullish hammer as well as a bullish divergence in the RSI. See Chart 2.


Chart 1: DJIA's daily chart as at May 21, 2010 (Source: Stockcharts.com)


Chart 2: FTSE's daily chart as at May 21, 2010 (Source: Stockcharts.com)

This morning, SSEC broke above its medium-term downtrend line ('RR') at 2600. It may test the horizontal resistance at 2900 or the 50-day SMA line at 2947. See Chart 3.


Chart 3: SSEC's daily chart as at May 21, 2010 (Source: Stockcharts.com)

HSI has also rebounded off its strong horizontal support of 19400. If it can surpass the psychological 20000 level, it may test the horizontal resistance at 21000. See Chart 4.


Chart 4: HSI's daily chart as at May 21, 2010 (Source: Stockcharts.com)

Based on the above technical outlook, I believe the global equity markets could be in for a decent rebound over the few days. The big question is whether the worst is over or has it just begun.

Measat's bottom-line benefited from forex gain

Results Update

Measat has just announced its results for QE31/3/2010. Its net profit increased by 137% q-o-q to RM49.8 million on the back of a marginal 1.1%-increase in turnover to RM70.5 million. Compared to the previous corresponding quarter, Measat's bottom-line turned around from a net loss of RM41.5 million (in QE31/3/2009) while turnover was up 30.4%. The improved bottom-line was attributable to forex translation gain of RM41.7 million. If the impact of the forex translation gain is excluded, Measat's net profit would still be up by 42% to RM12.5 million.


Table 1: Measat's last 8 quarterly results


Table 2: Measat's adjusted profit for QE31/3/2010 cf QE31/12/2009 (Source: Link to the filling on Bursa Malaysia)


Chart 1: Measat's 12 quarterly results

Valuation

Based on Measat (closed at RM2.93 on Friday) is now trading at a PER of 23 times (based on annualized, adjusted net profit of RM12.5 million fro QE31/3/2010). At this multiple, Measat is deemed fully valued.

Technical Outlook

Measat has strong resistance at RM2.90-3.00. Its support is at RM2.40-2.50.


Chart 2: Measat's week chart as at May 17, 2010 (Source: Tradesignum)

Conclusion

Measat is deemed fully valued at the present price. As such, it is a good idea to take profit on this stock.

MPHB reported an encouraging results

Results Update

MPHB has just announced its results for QE31/3/2010. Its net profit increased by 51.5% y-o-y to RM68.2 million on the back of a 19.4%-increase in turnover to RM993 million. Compared to the immediate preceding quarter (QE31/12/2009), its net profit dropped by 40.3% while turnover increased by 13.4%. The q-o-q decline in net profit is attributable to gains on disposal of quoted securities of RM45 million previously as compared to a gain of RM3 million in QE31/3/2010.


Table 1: MPHB's last 8 quarterly results


Chart 1: MPHB's 16 quarterly results

Valuation

MPHB (closed at RM1.98 last Friday) is now trading at a PER of 8 times (based on annualized EPS of 6.3 sen recorded for QE31/3/2010). At that multiple, MPHB is deemed very attractive. Assuming a PER of 12 times, MPHB's fair value is about RM3.02.

Technical Outlook

MPHB has broken below its uptrend line at RM2.00 last Friday. A quick recovery is crucial, failing which the stock could drift lower.


Chart 2: MPHB's weekly chart as at May 17, 2010 (Source: Tradesignum)

Conclusion

Based on strong financial performance & attractive valuation, MPHB could be a good stock for long-term investment. However, its short-term outlook is clouded by the breakdown of its uptrend line at RM2.00.

Wednesday, May 19, 2010

Market Outlook as at May 19, 2010

The FBM-KLCI looks BAD. As at 4.17 pm, it has lost 20 points to 1310. It broke below the 50-day SMA line at 1328 in the morning. Its next important support will be the 100-day SMA line at 1303 (which will coincide with the psychological 1300 level). That's very crucial support. We can see that a quick succession of breakdown of the 50 and 100-day SMA lines was followed by sharp selloff in 2007 & then 2008.


Chart 1: FBM-KLCI's daily chart as at May 18, 2010 (Source: Tradesignum)


Chart 2: FBM-KLCI's weekly chart as at May 18, 2010 (Source: Tradesignum)

CRB, another telling sign

Another indicator pointing to a tougher time ahead is the Reuters/Jefferies CRB Index ('CRB'). From Chart 1 below, we can see that a downtrend has begun for CRB. A reversal in CRB normally coincides with a reversal in DJIA (see Chart 2), with a small timing difference. See the bullish reversal in March 2009 (denoted as 'B') and the bearish reversal in August 2008 (denoted as 'A'). The start of a downtrend in CRB, as noted earlier, would probably lead to a bearish reversal for DJIA.


Chart 1: CRB's daily chart as at May 18, 2010 (Source: Stockcharts.com)


Chart 2: CRB & DJIA's daily chart as at May 18, 2010 (Source: Stockcharts.com)

China- to lead the way?

There was an interesting interview this morning on either Bloomberg or CNBC where the host asked an analyst why has the Chinese stock market been so weak. The analyst (I didn't get his name) said that the Chinese stock market was the first major stock market to recover after the recent Global Financial Crisis because they started reflating early. In the past few months, the Chinese authority had begun to tighten their monetary policies in order to control the runaway bubble in the property market as well as the overheated economy. The current tightening of the monetary policies caused further selldown in the SSEC, which has been consolidating since August last year.

If we look at the period from November 2008 to March 2009 in the chart below, we can see the sequence of events as follow:
- China started reflating & SSEC made a bottom (A)
- SSEC started to recover (A1)
- US finally brought the Banking system under control & DJIA began to recover (A2)

Now for the current state of play:
- China tightened its monetary policies & SSEC consolidated within a triangle (B)
- China further tightened its policies & SSEC broke below its triangle (B1)
- US to normalize? Possibly leading to a top in the DJIA? (B2?)


Chart: DJIA & SSEC's daily chart as at May 18, 2010 (Source: Stockcharts.com)

The normalization of monetary policies is now gathering steam worldwide. In Malaysia, Bank Negara had raised interest rates twice over the past 2-3 months. Part of the reasons for doing so is to tackle inflationary pressure (as reflected in the sharp rise in property prices). The other important reason to raise interest rate & to tighten up our monetary policies is to conserve some bullets for the rainy days. This would likely to extend to fiscal policies too, where the government would likely to reduce its fiscal deficit. The last thing any government needs is to be caught out in a crisis with heavy debts, large fiscal deficit & lower interest rates, with no room to maneuver. In such scenario, we can expect our stock market to also consolidate.

Jobst's profit & revenue continued to improve

Results Update

Jobst has just announced its results for QE31/3/2010. Its net profit increased by 39% q-o-q or 53% y-o-y to RM8.7 million while turnover increased by 19% q-o-q or 27% y-o-y to RM27.6 million.


Table 1: Jobst's last 8 quarterly results


Chart 1: Jobst's 27 quarterly results

Valuation

Jobst (closed at RM2.03 yesterday) is now trading at a PER of 21 times (based on last 4 quarters' EPS of 9.6 sen). At this multiple, Jobst is deemed fairly valued.

Technical Outlook

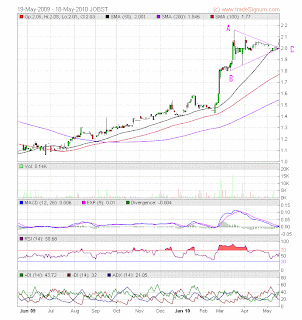
From the daily chart (Chart 2), Jobst appears to be trapped in a symmetrical triangle ('ABC'). While the share price broke to the upside of that triangle yesterday, the breakout was on thin volume. It must also be noted that a breakout at the apex of a triangle (denoted as 'C') is prone to fail- be it an upside breakout or a downside breakout. From the weekly chart (Chart 3), we can see that Jobst had a sharp jump from RM1.45 to above RM2.00 over the past 3 months. As such, the stock is likely to continue to consolidate its recent gain before the next price movement is revealed.


Chart 2: Jobst's daily chart as at May 18, 2010 (Source: Tradesignum)


Chart 3: Jobst's weekly chart as at May 18, 2010 (Source: Tradesignum)

Conclusion

Based on continued improvement in its top-line & bottom-line, Jobst is a good stock for long-term investment. However, the stock may consolidate at the RM2.00 level for a while longer after its recent sharp rise.

Tuesday, May 18, 2010

Evergrn- Cheap, but will it get cheaper?

Results Update

Evergrn has just announced its results for QE31/3/2010. Its net profit jumped by 6-fold y-o-y but declined by 20.4% q-o-q to RM33.1 million. The drop in net profit was due to higher tax provision in the current quarter as one of the companies in the Group no longer enjoys continuous tax incentive unlike the previous quarter which had a tax write back instead of tax provision. Pre-tax profit, which may be a better indication of its operational performance, increased by more than 12-fold y-o-y or 8.1% q-o-q to RM37.0 million. Turnover increased by 54% y-o-y or 6.5% q-o-q to RM239 million.


Table 1: Evergrn's last 8 quarterly results


Chart 1: Evergrn's 21 quarterly results

Valuation

Evergrn (closed at RM1.49 yesterday) is now trading at a PER of 6.6 times (based on last 4 quarters' EPS of 22.6 sen). At this multiple, Evergrn appears very attractive. However, Evergrn had traded at such lower PER multiple before but the share price continued to decline as the earning rolled over. This was observed in August 2007 & February 2008 where the PER was only at 5.6-5.7 times. The decline in its earning in 2008 was partly due to competitive pressure from overcapacity as well as the global economic slowdown due to the US financial crisis. Go here & here.

Technical Outlook

We can see Evergrn has just broken below its uptrend line, based on the daily chart plotted on log scale (Chart 2). From the weekly chart (Chart 3), we can see that Evergrn is now resting on its 30-week SMA line (at RM1.48-50). In 2007, the break below the 30-week SMA line was followed by a sharp selloff (in August 2007) & a reversal (in November 2007).


Chart 2: Evergrn's daily chart (log scale) as at May 17, 2010 (Source: Tradesignum)


Chart 3: Evergrn's weekly chart (linear scale) as at May 17, 2010 (Source: Tradesignum)

Conclusion

Despite the good financial performance & attractive valuation, Evergrn may deserve a HOLD rating due to its mildly negative technical reading. However, if the share price were to drop below RM1.50 convincingly, we can expect further downside for Evergrn.

Airport- time for some profit-taking

Results Update

Airport has just announced its results for QE31/3/2010. Its net profit dropped by 48% q-o-q or 21% y-o-y to RM72.5 million while turnover increased by 11.9% y-o-y but declined by 8.4% q-o-q to RM436 million. The drop in net profit was attributable to the following reasons:
1. Adoption of FRS139 which resulted in higher share of losses in an associate company, whereby the concession payable by the said company is recognized at fair value & subsequently at amortized cost. Gains & losses arising from changes in the fair value were recognized in the income statement. Stripping off the impact from the adoption of FRS139, Airport's pre-tax profit would increase by 12% y-o-y to RM139.9 million.

2. The pre-tax profit for QE31/3/2009 was positively impact by reversal of lease rental payable to the Government of RM52.0 million as well as a backdated user fee for FY2008 of RM45.8 million subsequent to the signing of the Operating Agreements.

If we factored in these reasons, we can see that Airport's financial performance remain satisfactory.


Table 1: Airport's last 8 quarterly results


Chart 1: Airport's 16 quarterly results

Valuation

Airport (closed at RM4.98 yesterday) is now trading at a PER of 15.6 times (based on last 4 quarters' EPS of 32 sen). At this multiple, Airport is trading very near its fair value.

Technical Outlook

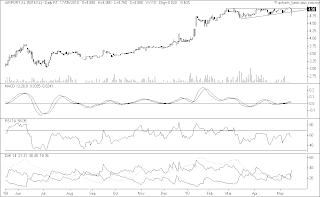
Airport has a very strong rally in the past 17 months, rising from a low of RM2.00 in January 2009 to the present level of about RM5.00. Airport share price appears to be trapped within an ascending triangle pattern, with resistance at RM5.00. A break above the RM5.00 level would lead to a continuation of the prior uptrend. However a downside breakout below RM4.90 could lead to a bearish reversal.


Chart 2: Airport's daily chart as at May 17, 2010 (Source: Quickcharts)

Conclusion

After the recent strong rally, I believe some profit-taking for Airport may be a good idea.

Monday, May 17, 2010

PIIGS- dragging down the EURO

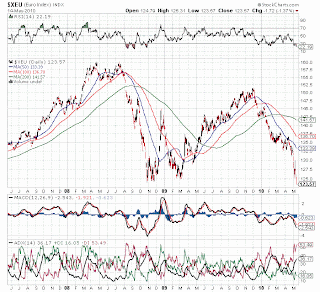
The hope engendered by the proposed EU & IMF plan to rescue Greece & other PIIGS nations has since faded. This is clearly reflected by the sharp plunge in the Euro (see Chart 1). The Euro may find good support at the horizontal line of 1.24-1.25 (the low recorded in October- November 2008 & March-April 2009). Conversely, the USD index has shot up (see Chart 2). It may test the highs of 88-90 recorded in October- November 2008 & March 2009.


Chart 1: EURO's daily chart as at May 14, 2010 (Source: Stockcharts.com)


Chart 2: USD's daily chart as at May 14, 2010 (Source: Stockcharts.com)

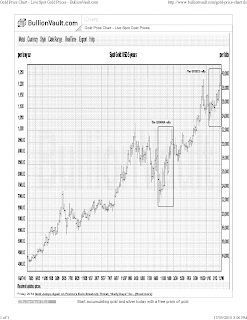
Another indicator of the flight to safety is the sharp rise in the price of gold. We have seen that in October 2008 to March 2009, and we are seeing that again since February this year (see Chart 3 below). Last week, gold price has surpassed the high of USD39000 per kg recorded in November 2009. Until a more workable or pragmatic solution is found to the problem of high government debts amongst developed nations in general and the PIIGS nations in particular, the financial markets will continue to be in bearish mode. For more on the problem of high debt among developed nation, go here. For more on the PIIGS nations' indebtedness, go here.


Chart 3: Gold's 5-year weekly chart as at May 14, 2010 (courtesy of Bullionvault.com)

Friday, May 14, 2010

Spritzr- uptrend to continue?

Background

Spritzer Bhd ('Spritzr') is involved in the manufacturing and distribution of natural mineral water, sparkling natural mineral water, distilled drinking water, carbonated fruit flavoured water, carbonated fruit flavour isotonic water, teas, toothbrushes, preforms and packaging bottles.

I posted on this stock in September last year, which was entitled "Spritzr- a not-so fizzy stock". Well, it is bubbling up now.

Recent Financial Results

For QE28/2/2010, Spritzr's net profit increased by 1.7% q-o-q or 32% y-o-y to RM3.2 million while its turnover increased by 10.0% q-o-q or 17% y-o-y to RM32.5 million.


Table 1: Spritzr's last 8 quarterly results


Chart 1: Spritzr's 15 quarterly results

Valuation

Spritzr (at RM1.15 as at 4.30pm today) is now trading at a PER of 13 times (based on last 4 quarters' EPS of 8.7 sen. Due to its strong growth over the past few quarters, Spritzr could easily trade at a PER of 15 times. At a PER of 15 times, Spritzr would command a fair value of RM1.30.

Technical Outlook

Spritzr broke above its recent high of RM1.05 (after a few attempts). With this breakout, Spritzr could continue with its prior uptrend.


Chart 2: Spritzr's daily chart as at May 14, 2010 (Source: Quickcharts)


Chart 3: Spritzr's monthly chart as at May 3, 2010 (Source: Tradesignum)

Conclusion

Based on good financial performance, reasonable valuation & further technical breakout, Spritzr could be a good trading BUY.