Showing posts with label agricultural products. Show all posts

Sunday, December 08, 2019

QL: Quarterly Revenue Crossed the Billion Mark!

Results Update

For QE30/9/2019, QL's net profit increased by 38% q-o-q or 15% y-o-y to RM69 million while revenue increased by 8% q-o-q and 17% y-o-y to RM1.073 billion. The result was announced on November 29.


Table: QL's last 8 quarterly results

From the graph below, we can see that QL's quarterly revenue has surpasssed the RM1 billion mark though quarterly profits are shy of its recent new high!!


Graph: QL's last 46 quarterly results

Financial Position

As at 30/9/2019, QL's financial position is deemed satisfactory, with current ratio at 1.58 times and gearing ratio at 0.92 time.

Valuation

QL (closed at RM7.45 last Friday) is now trading at a PE of 52 times (based on last 4 quarters' EPS of 14.33 sen). At this PER, QL is more than fully valued.

Technical Outlook

QL is steady uptrend, and is poised to test its all-time high of RM7.58 which was recorded in November 2018.


Chart: QL's weekly chart as at Dec 6, 2019 (Source: Malaysiastock.biz)

Conclusion

Based on satisfactory financial performance, QL can be a good stock for long-term investment. Its demanding valuation makes it very difficult to call a BUY on the stock. For now, it deserves a HOLD rating because of its promising technical set-up for an upside breakout of its all-time high.

Note:

I hereby confirm that I do not have any direct interest in the security or securities mentioned in this post. However, I could have an indirect interest in the security or securities mentioned as some of my clients may have an interest in the acquisition or disposal of the aforementioned security or securities. As investor, you should fully research any security before making an investment decision.

Thursday, October 03, 2019

LHI: Rally Starting

Leong Hup International Bhd ('LHI') was listed with much fanfare in May at an IPO price of RM1.10. Unfortunately the share price dropped over the next 3 months after its listing to make a low of RM0.72 in August. Since then, it has risen and broken above its downtrend line. 

Today, it has just broken above the high recorded in the August rally of RM0.865. At this moment, LHI is trading at RM0.88. If this rally can recruit enough support, the share price may go to RM0.95-1.00. 

The set-up and bullish breakout look tradable. It takes a tough mind to trade in this challenging market, but if you have what it takes to do it, and you're going in, I wish you all the best of luck! 

Chart: LHI's daily chart as at Oct 3, 2019 (Source: Malaysiastock.biz)


Monday, April 08, 2019

Teoseng: Egg Prices Started to Decline

Result Update

In QE31/12/2018, Teoseng's net profit rose 146% q-o-q or 35% y-o-y to RM17 million while revenue rose 18% q-o-q or 25% y-o-y to RM147 million. The revenue increased by RM22.0 million representing 17.5% higher mainly due to the stable selling price of eggs and higher sales quantity.Due to higher revenue and better efficiency, the Group recorded a pre-tax profit of RM24.8 million representing an increase of 188%. The latest result was announced on 20 February.


Table: Teoseng's 8 quarterly result


Graph: Teoseng's 25 quarterly result

Egg prices began to slide in the last week of March. The decline accelerated in April. If this continued, we may see average egg prices dropping to 25-28 sen apiece.


Graph 2: Egg Average Price Chart as at April 5, 2019 (Source: DVS. gov.my)

Latest Financial Position

As at 31/12/2018, Teoseng's financial position is adeqaute, with current ratio of 1.11x and gearing ratio of 0.57x.

Valuation

Teoseng (closed at RM1.22 last Friday) is now trading at a trailing PER of 12 times (based on last 4 quarters' EPS of 10.12 sen). Based on this PER, Teoseng is fairly valued.

Technical Outlook

Teoseng broke above its long-term downtrend, RR at RM0.92 in December 2018.


Chart 1: Teoseng's weekly chart as at Apr 5, 2019 (Source: Malaysiastock.biz)

After the breakout of the downtrend line, Teoseng began its uptrend and hit a high of RM1.37. This upswing is supported by the short-term uptrend line, SS at RM1.18.


Chart 2: Teoseng's daily chart as at Apr 5, 2019 (Source: Malaysiastock.biz)

Conclusion

Despite improved financial performance and bullish technical outlook, Teoseng's rally is dependent on the outlook for egg prices. The current drop in egg prices could lead to lower revenue and profits in the near future. Thus, it may be a good idea to take some profit on this stock.

Note:
I hereby confirm that I do not have any direct interest in the security or securities mentioned in this post. However, I could have an indirect interest in the security or securities mentioned as some of my clients may have an interest in the acquisition or disposal of the aforementioned security or securities. As investor, you should fully research any security before making an investment decision.

Friday, March 01, 2019

QL: Quarterly Profits at New High

Results Update

For QE31/12/2018, QL's net profit increased by 14% q-o-q or 16% y-o-y to RM69 million while revenue increased by 6% q-o-q and 10% y-o-y to RM979 million.


Table 1: QL's last 8 quarterly results

When compared to the result for QE31/12/2017, the higher revenue was mainly due to a 21%-increase in revenue from Integrated Livestock Farming (from RM522 million to RM629 million) while higher PBT was mainly due to a 32%-increase in PBT from Marine Product Manufacturing (from RM39 million to RM52 million).


Table 2: QL's Segmental Results

From the graph below, we can see that QL's quarterly revenue is fast approaching the RM1 billion mark while quarterly profits are at the new high!!


Graph: QL's last 43 quarterly results

Valuation

QL (closed at RM6.90 yesterday) is now trading at a PE of 50 times (based on last 4 quarters' EPS of 13.55 sen). Like Nestle, QL's overvaluation is simply mind-boggling. Some investors are probably waiting for the Family Mart's profits to show up in QL's books. We will have to wait and see.

Technical Outlook

QL is hanging onto its uptrend line, SS at RM6.90.


Chart: QL's weekly chart as at Feb 28, 2019 (Source: Malaysiastock.biz)

Conclusion

Based on satisfactory financial performance, QL can be a good stock for long-term investment if its valuation is not so demanding. It is tough but I have to say I just could not rate QL any batter than a HOLD if you have the stock. If you don't have the stock, you should wait for the price to retreat.

Note:

I hereby confirm that I do not have any direct interest in the security or securities mentioned in this post. However, I could have an indirect interest in the security or securities mentioned as some of my clients may have an interest in the acquisition or disposal of the aforementioned security or securities. As investor, you should fully research any security before making an investment decision.

Tuesday, November 13, 2018

QL: A Good Trading BUY

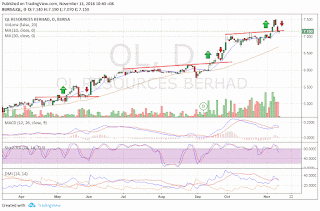
Last week, QL broke above its "horizontal resistance" at RM7.12-7.13 and rallied to a high of RM7.50. Last 2 days, the share price dropped back. Today it went below the horizontal resistance-turned-support of RM7.12-7.13. It went as low as RM7.07 before recovering. As at 10.40am, QL was trading at RM7.25.

From the chart below, you can see that QL has done a breakout/pullabck and then continued to go higher. The current "dance" is likely to be the same. Thus, QL could be a trading BUY now. A note of caution; do exercise careful discretion in all trading given the present weakness in the market. 

Chart: QL's daily chart as at Nov 13, 2018_10.15am (Source: Malaysiastock.biz)

Friday, March 02, 2018

Teoseng: In a Sweet Spot

Result Update

In QE31/12/2017, Teoseng's net profit rose 179% q-o-q or 237% y-o-y to RM12.8 million while revenue rose 8% q-o-q or 6% y-o-y to RM118 million. The revenue increased mainly due to the increase in selling price of eggs and sales quantity. Coupled with the lower raw material and operating cost, the pre-tax profit increased from RM3.1 million to RM11.9 million.


Table: Teoseng's 8 quarterly result


Graph 1: Teoseng's 21 quarterly result

Heading for Higher Profit

Poultry players can be involved in layer or broiler operation (to produce either egg or meat), upstream feedmill operation or downstream retail operation. Teoseng is involved mainly in layer operation and it is the biggest layer farm operator in the country. This is based on an old report from Bursadummy (here).


Table 2: Malaysian major poultry operators (Source: Bursadummy)

For Teoseng o make good profit, it needs to have good egg prices and low raw material prices. In the past 6 months, egg prices have been fairly firm at around an average of 35 sen apiece. If egg prices can stay at this level for a few more months, Teoseng will get a big boost in revenue. Teoseng will get a secondary lift in revenue due to higher output - unlike some operators which have not increased their output capacity due to earlier depressed egg prices.


Graph 2: Egg Average Price Chart as at Feb 9, 2018 (Source: DVS. gov.my)

Teoseng will benefit from lower corn prices. Corn, which is the main input for production of chicken feed, have been at the low for the past 3 years. Despite this favorable price, poultry farmers did not enjoy the full benefit due to weak MYR. Now that MYR has strengthened, the poultry farmer will enjoy the benefit of lower corn prices.


Chart 1: Corn price for 10 years to Feb 2018 (Source: Nasdaq.com)

Based on the above, I believe Teoseng is likely to see higher profit next few months.

Valuation

Teoseng (closed at RM0.985 yesterday) is now trading at a trailing PER of 84 times (based on last 4 quarters' EPS of 1.16 sen). However, if we annualized the profit (using the QE31//12/2017 number), the PER for Teoseng is 6 times. At this PER, the stock is deemed fairly attractive.

Technical Outlook

Teoseng is in a downtrend. If it can surpass the RM1.00-1.05, the stock may be over and the next upleg may begin.


Chart 2: Teoseng's weekly chart as at Mar 1, 2018 (Source: ShareInvestor.com)

Conclusion

Based on improved financial performance and attractive valuation, Teoseng could be a good stock for a recovery play.

Note:
I hereby confirm that I do not have any direct interest in the security or securities mentioned in this post. However, I could have an indirect interest in the security or securities mentioned as some of my clients may have an interest in the acquisition or disposal of the aforementioned security or securities. As investor, you should fully research any security before making an investment decision.

Thursday, November 24, 2016

Huatlai: Earnings Soared

Background

According to a recent Affin report, Huat Lai is a major integrated poultry player in Malaysia. It is Malaysia’s largest layer and the second largest broiler player in the country, behind unlisted Leong Hup. Based in Marlimau, Malacca, its operations span from the production of poultry feed, the breeding of day old chics, broilers, layering and also downstream processing of chicken. Huat Lai has intentions to further beef up its boiler and layering capacity with planned capex of RM80-100m over the next 2 years.

From Company's website

It announced a sterling set of results 2 days ago. Prior to that, its major shareholders, the Lim Brothers had offered to buy up the remaining shares not owned by them (about 25%) at RM5.00 apiece. For more, go here.

Industry Outlook

In QE30/9/2016, the  prices of chicken egg were quite volatile while prices of meat were relatively stable. In the current quarter, prices of egg has been sliding while prices of meat has recovered some of the lost ground. See Graph 1 below.

Graph 1: Price charts of chicken egg and meat from June to November 2016 (Source:
Jabatan Perkhidmatan Veterinar)


Graph 2: Price charts of chicken egg and meat for the past 4 years  (Source:
Jabatan Perkhidmatan Veterinar ) 

Financial Performance

For QE30/9/2016, Huatlai's net profit rose 221% -o-q or 245% y-o-y to RM45 million while revenue rose 12% q-o-q or 6% y-o-y to RM441 million. The improved profits for the current quarter was mainly attributed by improved selling prices of eggs and higher average selling prices of broilers as compared to the preceding quarter due to the shortage in the supply of poultry products in the market.


Table: Huatlai's last 8 quarters' result

Over the past 14 quarters, we can see that revenue has been on steady rise while profits have also been rising but on a zigzag pattern.


Graph 3: Huatlai's last 14 quarters' results

Latest Financial Position

Huatlai's financial position is stretched as at 30/9/2016, with current ratio at 0.8 times and gearing ratio at 1.4 times. The reason for this is due to its aggressive expansion plan and a small paid-up capital of RM86.6 million (comprising of 86.6 million shares). 

Valuation

Huatlai(closed at RM4.97 today) is trading at a PER of 7.6 times (based on last 4 quarters' EPS of 65 sen). This compares favorably to Teoseng and LTKM which are trading at PER of 14 and 13 times respectively. If Huatlai trades up to a PER of 13 times, its fair value could be RM8.45.

Technical Outlook

Huatlai is in a long-term uptrend. Its immediate resistance will be at the psychological RM5.00 (which is also the offer price for the buy-out by the Lim Brothers). Beyond that, it may test the November 2015 high of RM5.28. 


Chart 1: FGV's weekly chart as at Nov 23, 2016_4.00 (Source: Shareinvestor.com)

Conclusion

Based on good financial performance, attractive valuation and positive technical outlook, Huatlai is a good stock for long-term investment. I think we should not be deterred by the presence of the buy-out offer at RM5.00, which under-valued the stock. If the offerors are keen to privatize Huatlai, they may have to raise the offer price to get more acceptance. The risk is that the offer lapsed and the share price drops back. If that were to happen, then the share price will have to find its fair value, which I hope will eventually be closer to my estimate of RM8.45.

Note:
I hereby confirm that I do not have any direct interest in the security or securities mentioned in this post. However, I could have an indirect interest in the security or securities mentioned as some of my clients may have an interest in the acquisition or disposal of the aforementioned security or securities. As investor, you should fully research any security before making an investment decision.

Monday, May 30, 2016

LTKM: Earnings Plummeted

Results Update

In QE31/3/2016, LTKM's net profit plummeted  97% q-o-q or 99% y-o-y to a mere RM0.137 million while revenue was down 10% q-o-q or 19% y-o-y to RM40 million. Profits declined sharply q-o-q due to the fall in egg prices.


Table 1: LTKM's 8 quarterly result


Chart 3: LTKM's 38 quarterly results

Valuation

LTKM (closed at RM1.56 yesterday) is now trading at a high PER of 17 times (based on last 4 quarters' EPS of 9 sen). However, with a Price to Book ratio of 0.9X (based on NTA of RM1.71 as at 31/3/2016), LTKM's downside is well-cushioned.

Technical Outlook

LTKM has been moving sideways, leaning on its 30-month EMA line. I expect this line and the line connecting the trough in December 2014 & September 2015 (AB) to provide support for the stock.


Chart 4: LTKM's monthly chart as at May 27, 2016 (Source: ShareInvestor.com)

Conclusion

Based on poor financial performance, overvaluation & bearish technical outlook, LTKM is rated as a SELL.

Note: 
In addition to the disclaimer in the preamble to my blog, I hereby confirm that I do not have any relevant interest in, or any interest in the acquisition or disposal of, LTKM.

Monday, November 23, 2015

QL: Earning continued to trend higher

Results Update

For QE30/9/2015, QL's net profit increased by 35% q-o-q or 15% y-o-y to RM55 million while revenue increased by 5% q-o-q & y-o-y to RM690 million.


Table 1: QL's last 8 quarterly results

PBT increased q-o-q due to higher PBT & revenue from both the Marine Products Manufacturing & Integrated Livestock Farming divisions. The increased PBT from these divisions had more than offset the drop in PBT in the Palm Oil Activities division.


Table 2: QL's Segmental Results

It is good to note that the profit margin has inched up in the past 5 quarters. This, plus the rising revenue, would lead to higher bottom-line going forward.


Chart 1: QL's last 30 quarterly results

Valuation

QL (closed at RM4.20 last Friday) is now trading at a PE of 26 times (based on last 4 quarters' EPS of 15.90 sen). Based on the PE of 26 times & last year's earning growth of 12%, QL's PEG ratio stood at 2.2 times. This means that QL is overvalued.

Technical Outlook

QL continued its uptrend line with support at RM4.00. Immediate resistance is the recent high of RM4.20.


Chart 2: QL's weekly chart as at Nov 20, 2015(Source: ShareInvestor.com)

Conclusion

Based on satisfactory financial performance & positive technical outlook, QL is still a good stock for long-term investment. However, its upside is limited as it is fairly valued with signs of technical weakness emerging. 

Note: 
In addition to the disclaimer in the preamble to my blog, I hereby confirm that I do not have any relevant interest in, or any interest in the acquisition or disposal of, QL.

Monday, November 09, 2015

Chicken egg & meat prices dropped

In early October, I posted about the recovery in chicken egg & meat prices. With that price recovery, we saw a decent rally in poultry stocks, such as LTKM & Teoseng. Today, I managed to find a source for the prices of egg & chicken meat (here). To my surprise, the prices of egg had been declining since early November while the prices of chicken had been sliding since middle of October.

In line with this decline, one can expect the earnings of poultry farms to be affected. Thus, it is advisable to take some profit on the poultry stocks.


 Chart 1: Chicken meat prices from Dec 2012 to Nov 2015 (Source: Dept of Veterinary Services)

 
 Chart 2: Chicken egg prices from Dec 2012 to Nov 2015 (Source: Dept of Veterinary Services)