Showing posts with label telecommunication and media. Show all posts

Friday, September 13, 2019

ASTRO: Earnings Rebounded

Results Update

For QE31/7/2019, Astro's net profit rose 9 folds y-o-y to RM169 million on the back of a 13%-drop in revenue to RM1.24 billion. Compared to the immediate preceding quarter (QE30/4/2019), net profit dropped 4% while revenue rose marginally by 0.2%.

Revenue was lower by RM180 million or 13% against corresponding quarter mainly due to a decrease in subscription revenue and licensing income. EBITDA margin improved by 15.0% against corresponding quarter, due to lower content costs and marketing and distribution expenses. Net Profit increased by RM153 million or 10 folds compared with the corresponding quarter mainly due to increase in EBITDA and lower net finance costs, offset by higher tax expenses.


Table: Astro's last 8 quarterly results


Graph: Astro's last 32 quarterly results

Financial Position

Astro's financial position improved slightly with current ratio of 0.98 time and gearing ratio of 6.6 times.

Valuation

Astro (closed at RM1.39 in the morning session) is now trading at a trailing PE of 11 times (based on last 4 quarters' EPS of 11.83 sen). In addition, Astro paid out dividend quarterly which amounted to 6 sen for the last 4 quarters; giving the stock an attractive DY of 4.3%. Based on these PER and DY, Astro is deemed fairly attractive.

Technical Outlook

Astro is trapped in a triangle, with the upside capped at RM1.45 and downside supported at RM1.30. Until Astro can break out of this triangle, it will likely be around the RM1.40 level.


Chart 1: Astro's daily chart as at Sep 13, 2019_12.30 (Source: Malaysiastock.biz)


Chart 2: Astro's weekly chart as at Sep 13, 2019_12.30 (Source: Malaysiastock.biz)

Conclusion

Based on improved financial performance, I believe Astro is still a good stock for long-term investment based on fair valuation.

Note:

I hereby confirm that I do not have any direct interest in the security or securities mentioned in this post. However, I could have an indirect interest in the security or securities mentioned as some of my clients may have an interest in the acquisition or disposal of the aforementioned security or securities. As investor, you should fully research any security before making an investment decision.

Tuesday, September 10, 2019

Axiata & Telenor: Merger Deal off


Axiata and Telenor (DIGI's parent company) have just called off their merger deal (here and here). This should bring down the share prices of Axiata & DIGI to the levels just preceding the announcement on 6 May (here and here). If we were to factor in the unwinding of any position built-up after the merger announcement, then the price levels may go down a bit more (say, another 10 sen lower). Thus, if you want to buy into the selldown of Axiata and DIGI, the good price to aim for would be RM3.85-4.00 for Axiata and RM4.30-4.40 for DIGI.


Chart 1: Axiata's daily chart as at Sep 10, 2019_9.15am (Source: Malaysiastock.biz)


Chart 2: DIGI's daily chart as at Sep 10, 2019_9.15am (Source: Malaysiastock.biz)

Wednesday, June 26, 2019

Redtone: Revenue and PBT Continued to Rise

Result Update

For QE310/4/2019, Redtone's net profit dropped 11% q-o-q but rose 53% y-o-y to RM4.8 million while revenue rose 62% q-o-q or 132% y-o-y to RM73 million. Revenue rose q-o-q mainly due to higher revenue from Managed Telecommunication Network Services ("MTNS") segment.


Table: Redtone's last 8 quarterly results


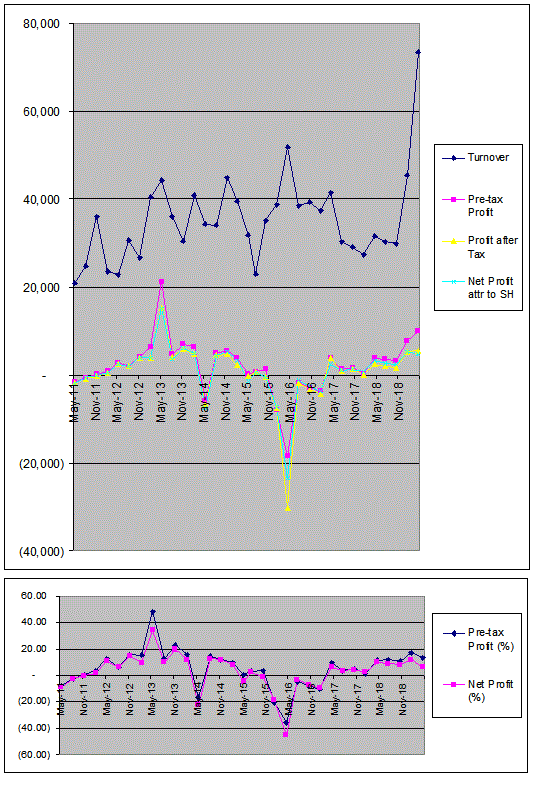
Graph: Redtone's last 33 quarterly results

Financial Position

As at 30/4/2019, Redtone's financial position is healthy with current ratio at 2.5 times and gearing ratio at 0.5 time.

Valuation

Redtone (closed at RM0.305 yesterday) is now trading at a trailing PE of 15 times (based on last 4 quarters' EPS of 2.01 sen).  At this PE, Redtone is still deemed attractive for a turnaround stock with room for further growth.

Technical Outlook

Redtone is trying to stay above its long-term downtrend line, RR as well as its intermediate uptrend line, RR- both at RM0.29.


Chart 1: Redtone's weekly chart as at Jun 25, 2019 (Source: Malaysiastock.biz)


Chart 2: Redtone's daily chart as at Jun 25, 2019 (Source: Malaysiastock.biz)

Conclusion

Based on improved financial performance, healthy financial position and mildly bullish technical outlook, Redtone could be a good stock for long-term investment.

Note:

I hereby confirm that I do not have any direct interest in the security or securities mentioned in this post. However, I could have an indirect interest in the security or securities mentioned as some of my clients may have an interest in the acquisition or disposal of the aforementioned security or securities. As investor, you should fully research any security before making an investment decision.

Wednesday, March 20, 2019

Redtone: Higher Earning Due to Higher MTNS Revenue

Result Update

For QE31/1/2019, Redtone's net profit increased by 116% q-o-q or 7-fold to RM5.4 million while revenue rose 52% q-o-q or 66% y-o-y to RM45.4 million. Revenue rose q-o-q due to higher revenue from Managed Telecommunication Network Services ("MTNS") segment. The Group's profit before tax rose q-o-q due to higher revenue in the MTNS segment (see Table 2 below).


Table 1: Redtone's last 8 quarterly results

Table 2: Redtone's segmental results for QE31/1/2019 

From Table 3 below, we can see that MTNS segment is now catching up with the Telecommunication Services segment. If MNTS segment can match the performance of the Telecommunication Services segment, Redtone's bottom-line will be much better than what's it like today.


Table 2: Redtone's 9-mth segmental results 


Graph: Redtone's last 32 quarterly results

Financial Position

As at 31/1/2019, Redtone's financial position is healthy with current ratio at 2.5 times and gearing ratio at 0.4 time.

Valuation

Redtone (closed at RM0.26 yesterday) is now trading at a trailing PE of 14 times (based on last 4 quarters' EPS of 1.79 sen).  At this PE, Redtone is still deemed attractive for a turnaround stock with room for further growth.

Technical Outlook

Redtone has broken above its downtrend line at RM0.24 on March 13. If it can also take out the immediate downtrend line, RR with resistance is at RM0.32-0.33, Redtone's uptrend may begin.


Chart: Redtone's weekly chart as at Mar 19, 2019 (Source: Malaysiastock.biz)

Conclusion

Based on the turnaround story, exciting future prospects, healthy financial position and mildly bullish technical outlook, Redtone could be a good stock for long-term investment.

Note:

I hereby confirm that I do not have any direct interest in the security or securities mentioned in this post. However, I could have an indirect interest in the security or securities mentioned as some of my clients may have an interest in the acquisition or disposal of the aforementioned security or securities. As investor, you should fully research any security before making an investment decision.

Thursday, March 14, 2019

Timecom: Uptrend Resumed

Timecom has been valued at around RM10.00 by BIMB Securities and Hong Leong Investment Bank (here and here). When it was trading at around RM7.50-8.00 in the second half of 2018, I have been keeping an eye on the stock. 

Chart 1: Timecom's weekly chart as at Mar 13, 2019 (Source: Malaysiastock.biz)

On March 4, it broke above the horizontal line at RM8.50, and consolidated around that price level for the next 3-4 days. On March 8, it began rising cautiously. Today it surpassed the intraday high of RM8.66 recorded on Mar 4, and closed at RM8.70.

Chart 2: Timecom's daily chart as at Mar 13, 2019 (Source: Malaysiastock.biz)

Based on the technical analysis, Timecom is poised to continue with its prior uptrend.

Wednesday, December 05, 2018

TM: A Bullish Breakout

TM broke above its downtrend line, RR at RM2.35 on November 29. After that breakout, TM remained at that price level for 2 days. Yesterday, TM broke above the horizontal line at RM2.47 as well as the psychological RM2.50 mark.

With these breakouts, TM is likely to begin its recovery provided it does not drop back below RM2.47-2.50. Based on technical consideration, TM could be a good stock for a recovery play. If you choose to get into the stock now, please exercise careful discretion in view of current market weakness.
.

Chart: TM's daily chart as at Dec 4, 2018 (Source: Malaysiastock.biz)

Note:

I hereby confirm that I do not have any direct interest in the security or securities mentioned in this post. However, I could have an indirect interest in the security or securities mentioned as some of my clients may have an interest in the acquisition or disposal of the aforementioned security or securities. As investor, you should fully research any security before making an investment decision.

Wednesday, November 21, 2018

Astro: End of a Monopoly


Astro lost its monopoly over paid TV broadcasting (here). While existing competitors, such as HYPP TV, cannot match with Astro's current offering. However the real game-changer may be the high speed broadband which may bring out competitors from the left field that we have yet to factor in the impact.

Notwithstanding the above, I believe that this news has been discounted over the past few months. I think if Astro dropped to RM1.00, it could be a good long-term BUY.


Chart: Astro's weekly chart as at Nov 19, 2018 (Source: Malaysiastock.biz)

Thursday, September 27, 2018

Astro: Earnings Plunged

Results Update

For QE31/7/2018, Astro's net profit dropped 91% q-o-q or 93% y-o-y to RM17 million while revenue was mixed- up 8% q-o-q but down 0.2% y-o-y to RM1.42 billion.

Revenue dropped y-o-y mainly due to a decrease in subscription and advertising revenue, offset by higher merchandise sales, licensing income and sales of program broadcast rights. The decrease in subscription revenue was mainly due to lower package take-up and the decrease in advertising revenue was due to lower spending over festivities as compared to corresponding quarter. The increase in merchandise sales was due to increase in number of products sold, mainly driven by the tactical campaigns executed for the current quarter.

Net profit decreased y-o-y mainly due to higher content costs from FIFA World Cup and higher cost of merchandise sales and higher net finance costs. Higher net finance cost was mainly due to unfavorable unrealized forex movement arising from unhedged finance lease liabilities and vendor financing and increase in interest expenses from borrowings. The drop was partially offset by lower tax expenses.


Table: Astro's last 8 quarterly results


Graph: Astro's last 28 quarterly results

Financial Position

Astro's financial position is weak with current ratio of 0.9 time and gearing ratio of 9 times. I believe that the investment community accepts these weak ratios because of the concession-like income stream. Will the faster and cheaper broadband affect this assumption in the future? We will ahve to wait and see.

Valuation

Astro (closed at RM1.66 yesterday) is now trading at a trailing PE of 16 times (based on last 4 quarters' EPS of 9.97 sen). In addition, Astro paid out dividend quarterly which amounted to 11.50 sen for the last 4 quarters; giving the stock an attractive DY of 6.9%. Based on these PER and DY, Astro is deemed fairly attractive.

Technical Outlook

Astro dropped from RM2.90 in October last year to a low of RM1.31 in May this year. After a rebound to RM1.97 in August, the share price is again on the retreat. It may re-test the low- hopefully giving us a double bottom!


 Chart: Astro's weekly chart as at Sep 26, 2018 (Source: Malaysiastock.biz)

Conclusion

Despite the weaker financial performance, I believe Astro is still a good stock for long-term investment based on fair valuation. For those who like to buy into Astro, you can afford to wait for lower prices before accumulating.

Note:

I hereby confirm that I do not have any direct interest in the security or securities mentioned in this post. However, I could have an indirect interest in the security or securities mentioned as some of my clients may have an interest in the acquisition or disposal of the aforementioned security or securities. As investor, you should fully research any security before making an investment decision.

Thursday, March 29, 2018

Astro: Earnings Continued To Rise

Results Update

For QE31/1/2018, Astro's net profit rose 24% q-o-q or 25% y-o-y to RM182 million while revenue dropped 0.6% q-o-q or 0.7% y-o-y to RM1.39 billion.

Revenue dropped y-o-y mainly due to a decrease in subscription revenue, offset by higher merchandise sales, advertising and production revenue. The decrease in subscription revenue was mainly due to lower package takeup. The increase in merchandise sales was due to increase in number of products sold which was mainly driven by the tactical campaigns executed for the current quarter. The increase in advertising revenue was due to higher spending for year-end festive celebration.

Net profit increased by RM37.6m or 26.3% compared with the corresponding quarter due to lower net finance costs. Lower net finance cost was due to favorable unrealised forex gain arising from unhedged non-current balance sheet liabilities comprising, finance lease liabilities and vendor financing. The increase was offset with decrease in EBITDA and higher tax expenses.


Table 1: Astro's last 8 quarterly results


Graph: Astro's last 26 quarterly results

Valuation

Astro (closed at RM2.02 yesterday) is now trading at a trailing PE of 13.7 times (based on last 4 quarters' EPS of 14.79 sen). In addition, Astro paid out dividend quarterly which amounted to 12.50 sen for the last 4 quarters; giving the stock an attractive DY of 6.2%. Based on these PER and DY, Astro is deemed fairly attractive.

Technical Outlook

Astro dropped from RM2.90 in October last year to a low of RM2.02 yesterday. It is now revisiting the low when the stock was re-quoted in October 2012.


 Chart: Astro's weekly chart as at Mar 28, 2018 (Source: Malaysiastock.biz)

Conclusion

Based on satisfactory financial performance & attractive valuation, I believe Astro is a good stock for long-term investment.

Note:

I hereby confirm that I do not have any direct interest in the security or securities mentioned in this post. However, I could have an indirect interest in the security or securities mentioned as some of my clients may have an interest in the acquisition or disposal of the aforementioned security or securities. As investor, you should fully research any security before making an investment decision.

Tuesday, March 20, 2018

Astro: Looking Even More Attractive

Astro has been dropping over the past 4 months, from a high of RM2.90 to a low of RM2.14 now. If you look at the chart below, we can see that Astro share prices have been moving in a steep downward channel, ABCD which flattened out slightly into WXYZ. Occasionally it would go below the lower line before rebounding back into the downward channel (see C"D" and Y"Z"). Assuming this pattern persists, Astro may test the second lower, Y"Z" possibly at RM2.10 before recovery.

Astro (currently at RM2.16) is now trading at a trailing PER of 15.3 times (based on last 4 quarters' EPS of 14.1 sen) and has a dividend yield of 5.8% (based last 4 quarters' dividend totaling 12.5 sen). At these ratios, Astro is deemed fairly attractive.


Chart: Astro's weekly chart as at Mar 20, 2018_4.06pm  (Source: Malaysiastock.biz)

Conclusion

Based on satisfacoiry financial performance & attractive valuation, Astro is considered a good stock for long-term investment.

Note:
I hereby confirm that I do not have any direct interest in the security or securities mentioned in this post. However, I could have an indirect interest in the security or securities mentioned as some of my clients may have an interest in the acquisition or disposal of the aforementioned security or securities. As investor, you should fully research any security before making an investment decision.

Thursday, February 01, 2018

Astro: Earnings may get a Boost from WC2018

Results Update

For QE31/10/2017, Astro's net profit dropped 40% q-o-q or 3% y-o-y to RM147 million while revenue dropped 2% q-o-q and y-o-y to RM1.40 billion.

Revenue dropped y-o-y mainly due to a decrease in subscription, advertising and licensing revenue, offset by higher production revenue. The decrease in subscription revenue was mainly due to lower package take-up. The decrease in advertising revenue was due to subdued advertising market. The decrease in licensing revenue was due to loss of content recovery for sports channel.

Net profit decreased y-o-y due to decrease in EBITDA, which was offset with impairment of investment in associate of RM15.1 million in the corresponding quarter and lower net finance costs. Lower net finance cost was due to favorable unrealized forex gain arising from unhedged non-current balance sheet liabilities comprising, finance lease liabilities and vendor financing.
(Note: Astro's result for QE31/10/2017 was announced on December 6, 2017.)


Table 1: Astro's last 8 quarterly results


Graph: Astro's last 25 quarterly results

Prospect for FY2019

Being the main provider of live sport event, Astro is likely to get a boost from FIFA World Cup 2018. To compute the financial impact, I have compared the increase in revenue and  profit for the TV segment from FIFA World Cup 2014. We can see the TV segmental revenue & profit for 1H2015 increased by 13% and 28% respectively. Net profit rose by 25% from RM213 million to RM266 million in 1H2015.

Assuming the same level of increase were to happen in 1H2019, then revenue & segmental profit would increase to RM3.057 billion & RM764 million respectively while net profit would increase to RM552 million. Divided by total shares outstanding of 5214 million, 1H2019 EPS would be about 10.6 sen. Assuming 2H2019 EPS is about 6 sen, then Astro's full-year earning for FY2019 would be about 16.6 sen- giving the stock a prospective PER of 15.7times.


Table 2: Astro's forecast earning for 1H2019

Valuation

Astro (closed at RM2.60 on Thursday) is now trading at a trailing PE of 18 times (based on last 4 quarters' EPS of 14.09 sen). In addition, Astro paid out dividend quarterly which amounted to 12.50 sen for the last 4 quarters; giving the stock a decent DY of 4.8%. Based on the above PER and DY, Astro is fairly attractive.

Technical Outlook

Astro is transitioning from a downtrend to a sideways trend, with resistance from the line, XY and support from the line, AB.


 Chart: Astro's weekly chart as at Jan 30, 2018 (Source: Malaysiastock.biz)

Conclusion

I like to revise Astro's rating from a HOLD to a BUY based on steady financial performance, relatively attractive valuation & potential boost from WC2018.

Note:

I hereby confirm that I do not have any direct interest in the security or securities mentioned in this post. However, I could have an indirect interest in the security or securities mentioned as some of my clients may have an interest in the acquisition or disposal of the aforementioned security or securities. As investor, you should fully research any security before making an investment decision.

Thursday, January 25, 2018

Sasbadi- Earnings Recovered

Background

Sasbadi Holdings Bhd ("Sasbadi") is a publisher of educational materials, undertaking print publishing as well as online publishing of educational materials based on the Malaysian National School Curriculum.  It is also involved in the distribution of applied learning products - miniature building blocks and mechanical, electrical and electronic components, as well as devices for measuring and analysing live signals, and software to create measurement and control systems - designed to provide hands-on learning experience to students. 

Diagram: Sasbadi's Main Businesses

Result Update

For QE30/11/2017, Sasbadi reported to a net profit of RM4.4 million as compared to a net loss of RM4.2 million in the immediate preceding quarter (QE31/8/2017). The turnaround was due to higher revenue & lower operating expenses.

The poor performance in QE31/8/2017 was due to a drop in revenue from the academic publishing subsidiaries d- partially due to a seasonally weaker quarter as well as weaker retail market. This decline was only partially offset by the increase in revenue of the online/digital products division - leading to an overall drop in revenue. In addition, the group incurred higher operating costs in QE31/8/2017 due to the consolidation of the United Publishing Group's full quarter results, impairment loss on trade receivables, and increased interest expense arising from higher gearing.

(Note: This latest quarterly result was announced on Jan 18.)


Table: Sasbadi's last 8 quarters' financial performance


Graph: Sasbadi's last 14 quarters' financial performance

Financial Position

As at 30/11/2017, Sasbadi's financial position is deemed satisfactory with current ratio at 3.1x and gearing ratio at 0.50x.

Valuation

Sasbadi (closed at RM0.605 yesterday) is now trading at a trailing PER of 21 times (based on last 4 quarters' EPS of 2.89 sen). However, if we were to exclude the exceptional loss from QE31/8/2017, the 4 quarters' EPS could be raised to 5.0-5.5 sen. Based on a full year EPS of 5 sen, Sasbadi's PER would be 12 times. At this adjusted PER of 12 times, Sasbadi looks fairly attractive.

Technical Outlook

Sasbadi share price is moving within a large expanding triangle. As noted in the past, an expanding triangle is an unusual price pattern where the bulls get more bullish over times while the bears get more bearish as well. At some point, the stalemate must be resolved. Failing which, the share price will move sideways or begin to converge. If we make the fair assumption that the price will stay within the triangle, then the next likely movement is for the share price to rise up to the middle line. Thus the stock could be a good buy at the current price of RM0.60.


Chart: Sasbadi's weekly chart as at Jan24, 2018 (Source: Malaysiastock.biz)

Conclusion

Based on satisfactory financial performance & position and reasonable valuation, Sasbadi is a good stock for long-term investment.

Note:
I hereby confirm that I do not have any direct interest in the security or securities mentioned in this post. However, I could have an indirect interest in the security or securities mentioned as some of my clients may have an interest in the acquisition or disposal of the aforementioned security or securities. As investor, you should fully research any security before making an investment decision.

Wednesday, September 27, 2017

STAR: A Costly Dividend

Star went ex today for first interim and special dividends totaling 36 sen. Yesterday, it dropped 6 sen ahead of the dividend ex date. It closed at RM2.30. After deducting the 36-sen dividend, Star's reference price is RM1.94. Amazingly Star is now trading at RM1.80 as at 3.20pm. This means that a shareholder who held the stock for the dividend received 36-sen dividend but is down 50 sen.    

It is worth highlighting that the selldown is overdone notwithstanding the competitive nature of the media business, etc. Chartwise, we can see that the share price is trading just below its long-term uptrend line (in blue) at RM1.85 as well as the line connecting the last 2 years' troughs (in orange) at RM1.80. I won't be surprised that the stock may see a 10-15 sen rebound over the next few days.

Assuming Star continues with its twice yearly dividend of 9 sen each (or, 18 sen in total), its dividend yield is now a whopping 10%.


Chart 1: Star's weekly chart as at Sep 27, 2017_3.20pm (Source: Malaysiastock.biz)


Chart 2: Star'smonthly chart as at Sep 27, 2017_3.20pm (Source: Malaysiastock.biz)

Tuesday, September 05, 2017

Axiata: Earning Rebounded

Background

Axiata Group Berhad (“Axiata”) provides various telecommunications products and services in Asia. It has controlling interests in six mobile operators under the brand names of ‘Celcom’ in Malaysia, ‘XL’ in Indonesia, ‘Dialog’ in Sri Lanka, ‘Robi’ in Bangladesh, ‘Smart’ in Cambodia and ‘Ncell’ in Nepal, with strategic interests in ‘Idea’ in India and ‘M1’ in Singapore. The Group has an infrastructure company, ‘edotco’, which operates in five countries to deliver telecommunications infrastructure services, and operates and manages a regional portfolio of over 25,000 towers. For more information on the group, go here.  

Historical Financial Performance

Axiata’s top-line has been on a steady uptrend over the past 10 years. However its bottom-line suffered a decline in the past 5 quarters, with net profit below RM400 million from QE31/3/2016 to QE31/3/2017. It even incurred a net loss of RM309 million in QE31/12/2016. The reasons for the decline in profit (and loss) for these 5 quarters are:
  • amortisation of intangibles assets arising from acquisition of Nepal operation
  • accelerated depreciation in Indonesia & Bangadesh
  • foreign exchange losses
  • higher net finance costs
In QE30/6/2017, Axiata net profit climbed back above the RM400 million. This may mark the beginning of its earning recovery.

Graph: Axiata’s last 42 quarters revenue & profits

Recent Financial Result

Axiata announced its latest quarterly result for QE30/6/2017 last week. Its net profit rose 70% q-o-q or 116% y-o-y to RM407 million while revenue rose 3% q-o-q or 14% y-o-y to RM6.06 billion. The q-o-q improvement in profit was due to improved performance in all major operating companies with the exception of the Cambodian operation. Improved revenue and effective cost management resulted in EBITDA growth by 5.6%. For the quarter, share of results from associates and joint ventures declined by more than 100% mainly as a result of the investment in India. India continues to face intense market aggression arising from the new entrant in the Indian market. PAT improved by 82.8% and PATAMI increased by 70.4% to RM407.2 million contributed mainly by the improved quarter performance by all major operations.

Table: Axiata’s last 8 quarters’ P&L

Latest Financial Position

Axiata’s financial position is relatively weak as at 30/6/2017, with current ratio at 0.66x and total liabilities to total equity at 1.25x. The weak financial position - due to over-expansion - need to be rectified by either capital-raising or partial disposal of its stakes in some of the operating units (such as its tower asset company).

Valuation

Axiata (closed at RM4.93 on August 30, 2017) is now trading at a trailing PER of 75x (based on last 4 quarters’ EPS of 6.6 sen). At this PER, the stock is over-valued. However Axiata may be on the path of recovery. If its net profit can climb back to RM600 million a quarter, its full-year EPS would be about 28 sen - bringing down its PER to 18x. At a PER of less than 20x, Axiata will again be an attractive telco stock.

Technical Outlook

Axiata broke its long-term uptrend in 2015 when its share price went below its 30-month EMA line. Since then, Axiata has been on a downtrend.  

Chart 1: Axiata’s monthly chart as at August 30, 2017 (Source: Shareinvestor.com)

If Axiata can surpass the intermediate downtrend line, RR at RM5.30, the share price recovery may begin.

Chart 2: Axiata’s weekly chart as at August 30, 2017 (Source: Malaysiastock.biz)

Conclusion

Axiata could be a good stock for a recovery play based on tentative sign of earning recovery. It is a home-grown multi-national company with good management, steady revenue growth and, until recently, long track record for profitable operation. However the stock is not cheap as its earning had declined sharply over the past 5 quarters. With earning recovery beckons, Axiata could be a good stock to consider for long-term investment. 

Note:
I hereby confirm that I do not have any direct interest in the security or securities mentioned in this post. However, I could have an indirect interest in the security or securities mentioned as some of my clients may have an interest in the acquisition or disposal of the aforementioned security or securities. As investor, you should fully research any security before making an investment decision.

Thursday, June 15, 2017

Astro: Earnings Weaker y-o-y

Results Update

For QE30/4/2017, Astro's net profit rose 35% q-o-q but dropped 3% y-o-y to RM196 million while revenue dropped 5% q-o-q or 3% y-o-y- at RM1.326 billion.

Revenue dropped y-o-y mainly due to a decrease in licensing, subscription and advertising revenue. The decrease in licensing revenue was due to loss of content recovery for sports channel. The decrease in subscription revenue was mainly due to lower package take-up. Lower advertising revenue in the current quarter owing to Chinese New Year advertisement spending recorded in the corresponding quarter.

Net profit decreased y-o-y due to increase in the proportion of content costs against revenue and increase in net finance costs, offset by lower depreciation of property, plant and equipment. Higher net finance cost was due to lower unrealised forex gain arising from unhedged non-current balance sheet liabilities comprising, finance lease liabilities and vendor financing.


Table: Astro's last 8 quarterly results

Astro's revenue seems to have broken its "uptrend". Can the profits "uptrend" sustain if revenue uptrend ceased? The break in the revenue uptrend is a concern, especially with the start of the Free Digital Broadcast under MYTV.


Graph: Astro's last 23 quarterly results

Valuation

Astro (closed at RM2.70 yesterday) is now trading at a trailing PE of 23 times (based on last 4 quarters' EPS of 11.86 sen). At this PER, Astro is fairly valued. However, Astro paid out dividend quarterly which amounted to 12.50 sen for the last 4 quarters; giving the stock a decent DY of  4.6%.

Technical Outlook

Astro is in a downtrend line, at RM2.80.Immediate support is from the horizontal line at RM2.50.


 Chart: Astro's weekly chart as at Jun 15, 2017_12.30pm (Source: ShareInvestor.com)

Conclusion

Despite its steady financial performance and fair valuation, Astro's rating remains a HOLD because it has not broken above its downtrend line.

Note:

I hereby confirm that I do not have any direct interest in the security or securities mentioned in this post. However, I could have an indirect interest in the security or securities mentioned as some of my clients may have an interest in the acquisition or disposal of the aforementioned security or securities. As investor, you should fully research any security before making an investment decision.

Thursday, February 23, 2017

Axiata: In The Red Thanks To Forex Losses

Result Update

For QE31/12/2016, Axiata reported a net loss of RM309 million while revenue rose 6% q-o-q or 8% y-o-y to RM5.79 billion. Revenue increased q-o-q with all the segments registered positive growth. For the period, operating costs increased by 13.2% q-o-q to RM3,809.9 million mainly arising from higher operation cost in Indonesia, Bangladesh and Sri Lanka. As a result, EBITDA margin decreased by 4.1 percentage points to 34.0%. The Group reported an after tax loss of RM272.1 million arising from higher depreciation and amortization due to network modernization in Indonesia and Bangladesh, net finance cost, foreign translation losses and share of losses from associates and joint ventures.  The foreign exchange (forex) losses amounted to RM685 million at PAT level, was mainly due to the USD exposed debt incurred from the acquisition of Ncell.


Table; Axiata's last 8 quarters' P&L

From the 10-year P&L record, Axiata had reported losses in 2 other quarters: December 2008 & December 2010. In December 2008, Axiata (then TMI) incurred a loss after tax of RM613.5 million “mainly driven by exchange loss in the quarter of RM472.3 million which was mainly derived from XL” which resulted from “the strengthening of USD against IDR, RM and other local currencies”. It was also compounded by “negative contribution from Dialog and share of loss from jointly controlled entities”. 

In December 2010, Axiata recorded loss after tax of RM260.8 million mainly due to the impairment on the investment in an associate. The total impairment was RM1,085.0 million and it as for its investment in Idea Cellular Limited (“Idea”) in conjunction with the impairment assessment requirement under FRS 136 “Impairment Of Assets”. The impairment test was undertaken following an impairment indicator arising from the shortfall between the carrying value and market value of the Group’s investment in India as well as intense competition following the entry of a number of new operators into the Indian market.
From these earlier loss events, we can take it that Axiata is likely to bound back. This is part and parcel of operating in an international environment.


Graph: Axiata's last 40 quarters' P&L

Valuation

Axiata (closed at RM4.53 today) is now trading at a PER of 79x (based on last 4 quarters' adjusted EPS of 5.7 sen). This is not a meaningful guide. A better matrix to look at is the Price to Book ratio of the stock today as compared to the last 2 occasions when it made a loss. This is given below:

I think Axiata is fairly priced compared to its book value or NTA p.s.
  
Technical Outlook

Axiata is in a downtrend line, RR. Its immediate support will come from the horizontal line at RM4.45 & then the recent low at RM4.10.


Chart 1: Axiata's weekly chart as at Feb 23, 2017_15.00  (Source: MalaysiaStock.Biz)
 

Chart 2: Axiata's monthly chart as at Feb 23, 2017_15.00  (Source: MalaysiaStock.Biz)
 
Conclusion

As I believe Axiata can recover in the next 1-2 quarter(s), I rate it as a HOLD or a contrarian BUY if it drops to RM4.00-4.20.

Note:
I hereby confirm that I do not have any direct interest in the security or securities mentioned in this post. However, I could have an indirect interest in the security or securities mentioned as some of my clients may have an interest in the acquisition or disposal of the aforementioned security or securities. As investor, you should fully research any security before making an investment decision.

Monday, February 06, 2017

DIGI: Uptrend Poised To Continue (UPDATE)

Last Thursday, DIGI’s broke above its intermediate downtrend line (rr) at RM4.95. The following day, it broke above the psychological RM5.00 mark. This morning, it tested its Sep 13, 2016 high of RM5.11. I rate the RM5.11 as a resistance event where the stock may correct and pullback toward the support from its psychological RM5.00 mark.  

(Note: The chart below is adjusted for dividend payment. As a result, the September 2016 high is not reflected as RM5.11 but as RM5.06. I believe the RM5.11 will still pose some resistance for the current breakout.) 

Chart 1: DIGI's daikly chart as at Feb 6, 2017_11.30 (Source: MalaysiaStock.Biz)

Quick Update

On Jan 23, DIGI announced its result for QE31/12/2016 where its net profit dropped 2% y-o-y to RM375 million while revenue dropped 3% y-o-y to RM1.67 billion. Compared to the results with the immediate preceding quarter (QE30/9/2016), its revenue increased marginally q-o-q due to solid postpaid growth momentum and stronger internet adoption which offset weaker prepaid business. However EBITDA & PBT dropped q-o-q after accounting for associated cost for the higher device sales; increased marketing cost in supporting subscriber acquisition; and progressive network expansion cost. Nevertheless EBITDA margin remained robust at 44% following strong operational efficiency discipline and well-managed cost structure. For more, check out my recent post.

Despite the relatively high valuation, I have kept DIGI’s rating as a HOLD based on improved performance over the past few quarters (albeit weaker one in QE31/12/2016), decent dividend yield and mildly positive technical outlook.


Chart 2: DIGI's weekly chart as at Feb 6, 2017_11.30 (Source: MalaysiaStock.Biz)


The last time, DIGI broke above its intermediate downtrend and followed up with an upside breakout of the ensuing sideways trading range was in early 2014. In that rally, DIGI rose from the breakout point of RM4.20 to a high of RM6.00- giving investors a return of 42% over a 1-year period. If the current breakout leads to a similar rally, we might see DIGI making a high of RM7.00.

Conclusion

Based on the current technical breakout, I believe that DIGI could be a good trading BUY.

Note:
I hereby confirm that I do not have any direct interest in the security or securities mentioned in this post. However, I could have an indirect interest in the security or securities mentioned as some of my clients may have an interest in the acquisition or disposal of the aforementioned security or securities. As investor, you should fully research any security before making an investment decision.