Thursday, May 31, 2018

GHLSYS: Earnings at a New High

Result Update

For QE31/3/2018, GHLSYS's net profit rose 19% q-o-q or 10% y-o-y to RM5.9 million while revenue dropped 6% q-o-q or 12% y-o-y to RM60 million. Despite a -12% -o-y decline in group revenue to RM59.8 million vs RM68.0 million in 1Q2017, the net profit after tax rose due to better product mix as well as better performance from solutions services and TPA divisions whereas shared services were flat. Net margins also improved to 9.8% (1Q17 – 7.8%) due to higher solutions software sales as well as higher TPA transaction fees earned.


Table: GHLSYS's last 8 quarters' P&L

You can see that GHLSYS's profit is now at a new high.


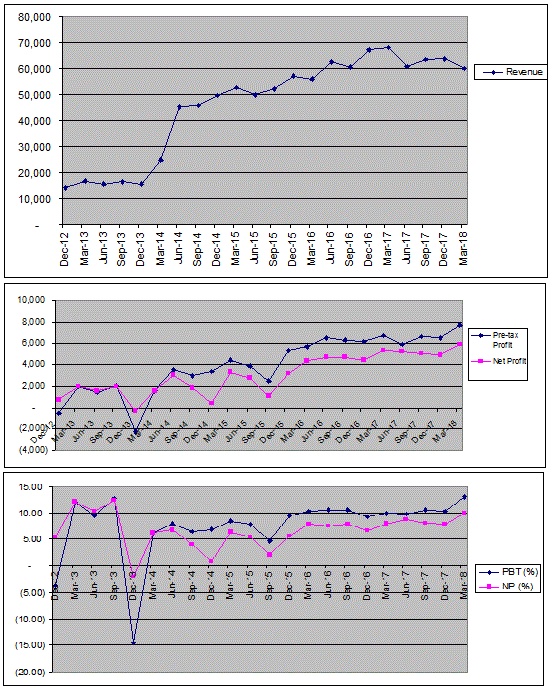
Graph : GHLSYS's las22 quarters' P&L

Valuation

GHLSYS (closed at RM1.44  yesterday) is now trading at a PER of 44x (based on last 4 quarters' adjusted EPS of 3.21 sen). Based on its earning CAGR of 35% over the past 3 years, GHLSYS's PEG ratio is only 1.25x. As such, GHLSYS is deemed reasonably priced

Technical Outlook

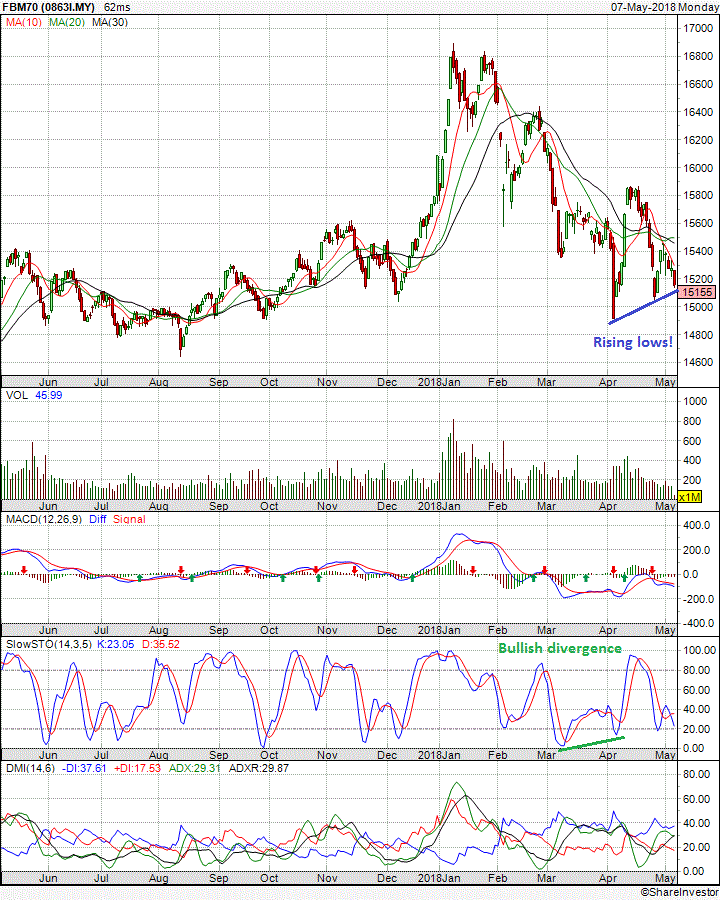
GHLSYS is now testing its medium-term downtrend line at RM1.45. If it can break above this level, the stock may go into an uptrend.


Chart: GHLSYS's monthly chart as atMay 30, 2018 (Source: ShareInvestor)

Conclusion

Based on satisfactory financial performance and reasonable valuation as a growth stock, GHLSYS is rated a good stock for long-term investment. If it can break above the RM1.45 level, the stock can go into an uptrend.

Note:

I hereby confirm that I do not have any direct interest in the security or securities mentioned in this post. However, I could have an indirect interest in the security or securities mentioned as some of my clients may have an interest in the acquisition or disposal of the aforementioned security or securities. As investor, you should fully research any security before making an investment decision.

Wednesday, May 30, 2018

MUDA: Earnings Stayed Heallthy

Results Update

For QE31/3/2018, Muda's net profit dropped 56% q-o-q or 13% y-o-y to RM15.7 million while its turnover was mixed - down 18% q-o-q but rose 17% y-o-y to RM372 million.

Revenue rose y-o-y 17.3% mainly attributable to higher selling price of industrial paper and paper packaging products and higher sales volume from the latter. Sales volume for industrial paper suffered a minor setback during the quarter due to competition from imported paper. Strengthening ringgit and increased supply from overseas paper mills to Malaysia has resulted in lower turnover during the quarter under review. However, the shortfall was compensated by better selling price. For paper packaging products, improving economy and the success of selling price increase to cover increased raw material cost has resulted in higher revenue to the Group.

Compared to the corresponding quarter in 2017, lower cost of waste paper, higher selling price of industrial paper and better selling price of paper packaging products contributed to improvement in gross margin of the Group despite higher operating cost for the quarter under review. The improved gross margin has resulted in higher profit before tax in the current quarter. Profit before tax for the quarter under review is 7.6%  higher than the corresponding period in 2017. If the impact of net compensation from the insurer for the fire which occurred in 2016 was eliminated, the adjusted profit of RM19.4 million for the current quarter under review is 2.4 times higher the adjusted profit of RM8.2 million in the corresponding quarter in 2017.


Table: Muda's last 8 quarterly results


Graph: Muda's last 48 quarterly results
 

Valuation

Muda (trading at RM2.15 as at 11.45am) is trading at a PE of 11.6 times (based on last 4 quarters' EPS of 18.5 sen). At this PER, Muda is deemed fairly attractive.

Technical Outlook

Muda is in a steep short-term uptrend based on the 10-week SMA line at RM2.20.


Chart 1: Muda's weekly chart as at May 30, 2018_11.45 (Source: ShareInvestor.com)

From Chart 2, we can see that Muda is in a long-term uptrend line, with support at RM1.40.


Chart 2: Muda's monthly chart as at May 30, 2018_11.45 (Source: ShareInvestor.com)

Conclusion

Based on improving financial performance, attractive valuation and bullish technical outlook, Muda is rated a BUY on WEAKNESS.

Note:

I hereby confirm that I do not have any direct interest in the security or securities mentioned in this post. However, I could have an indirect interest in the security or securities mentioned as some of my clients may have an interest in the acquisition or disposal of the aforementioned security or securities. As investor, you should fully research any security before making an investment decision.

RCECap: Earnings Growth Intact

Result Update

For QE31/3/2017, RCECap's net profit rose marginally by 0.5% q-o-q or 8% y-o-y to RM23 million. Its revenue is mixed - down 2% q-o-q but rose 10% y-o-y to RM63 million. Revenue rose y-o-y primarily led by higher interest and fee income backed by the expanded loan base from its consumer financing segment. Correspondingly, this led to a higher pre-tax profit of RM30.1 million in the current quarter as compared to RM28.9 million in the corresponding quarter.


Table: RCECap's last 8 quarterly results

RCECap's financial performance continued to crawl up after bottoming in last 2013.


Graph: RCECap's last 44 quarterly results

Valuation

RCECap (closed at RM1.33 on May 28, 2018) has a trailing PE of 5.1 times (based on last 4 quarters' EPS of 26.02 sen). Starting this financial year, it is paying out dividend twice yearly totaling 7 sen. Dividend yield is 5.3%. Based on this PER & DY, RCECap is deemed fairly attractive.

Technical Outlook

RCECap is in a medium-term downtrend with resistance at RM1.45.


Chart 1: RCECap's weekly chart as at May 28, 2018 (Powered by ShareInvestor.com)

However, RCECap is still in a long-term uptrend.


Chart 2: RCECap's monthly chart as at May 28, 2018 (Powered by ShareInvestor.com)

Conclusion

Based on continued good financial performance, and attractive valuation, RCECap is good stock for long-term investment. However it's medium-term outlook is still neutral as it is still in a downtrend line.

Note:

I hereby confirm that I do not have any direct interest in the security or securities mentioned in this post. However, I could have an indirect interest in the security or securities mentioned as some of my clients may have an interest in the acquisition or disposal of the aforementioned security or securities. As investor, you should fully research any security before making an investment decision.

Success: Earnings Plummeted

Results Update

For QE31/3/2018, Success's net profit plummeted 83% q-o-q or 88% y-o-y to RM1.1 million while revenue dropped 18% q-o-q or 17% y-o-y to RM76 million. PBT dropped sharply mainly due to decrease in sales from transformer and lighting segment and losses under process equipment segment due to its lower margin contribution from certain projects as compared to immediate preceding quarter ended 31 December 2017.


Table: Success's last 8 quarterly results


Graph: Success's last 44 quarterly results

Valuation

Success (closed at RM1.00 on 28/5/2018) is now trading at a PE of 10 times (based on past 4 quarters' EPS of 10.1 sen). At this PER, Success is deemed fairly valued.

Technical Outlook

Success has been in a steady decline after it peaked at RM2.15 in May 2017.


Chart 1: Success's weekly chart as at May 28, 2018 (Source: ShareInvestor.com)

Success is in a long-term uptrend line with support at RM0.80.


Chart 2: Success's monthly chart as at May 28, 2018 (Source: ShareInvestor.com)

Conclusion

Based on poor financial performance, I downgrade Success's rating to HOLD. Nevertheless Success would be fairly attractive if the share price dropped back to RM0.80.

Note:

I hereby confirm that I do not have any direct interest in the security or securities mentioned in this post. However, I could have an indirect interest in the security or securities mentioned as some of my clients may have an interest in the acquisition or disposal of the aforementioned security or securities. As investor, you should fully research any security before making an investment decision.

Monday, May 28, 2018

Crude Oil Poised to Correct

Last Friday, crude oil price tumbled 4% last Friday on reports that Opec and Russia may consier easing oil cap (here). The price continued to weaken this morning, with Brent trading at USD75.63 as at 3.07 a.m. (EDT). This means Brent is now marginally below its uptrend line, SS. In February, Brent broke the uptrend line, S1-S1, when it dropped from the high ofUSD71 to USD62. The current breakdown of the uptrend line, if not quickly reversed, could send the price to USD70.


Chart 1: Brent's daily chart as at May 28, 2018_3.00pm (Source: stockchart.com)

At the same time, the continued strengthening of the USD has led to a slow but steady rise in USD-MYR. A break above the 4.00 mark could easily send USD-MYR to 4.10-4.15.


Chart 2: USD-MYR's daily chart as at May 28, 2018_3.00pm (Source: Investing.com)

The weakness of the crude oil price coupled with the rise in USD-MYR may weaken investors' resolve in our stock market. With so many projects and policies up in the air, investors may feel that it is wiser to take their money off the table. I would agree with that if the share prices were not trading at such a low level. In fact some stocks are trading at such attractive prices that a case can be made that this may be a good time to slowly buy into the market. Looking at the chart below, I believe the FBMKLCI support at 1750-1760 may still hold up our market in the near term. However, if this support is violated, we will have to refer to the long-term uptrend line support at 1700.   


Chart 3; FBMKLCI's daily chart as at May 28, 2018_3.00pm (Source: Shareinvestor.com)

If you choose to invest in the market today, please do so slowly and always pick attractively-priced stocks that have good earnings, decent dividend payout and healthy financial position. Good luck!

Thursday, May 24, 2018

Market Outlook as at May 24, 2018

Our market is shaken by reported huge losses in 1MDB and higher government debts exceeding RM1 trillion and counting. This is a quick take on the market outlook. I believe FBMKLCI will likely test the horizontal support at 1760 and then the intermediate uptrend line at 1750. See Chart 1.


Chart 1: FBMKLCI's weekly chart as at May 24, 2018_9.30am (Source: Shareinvestor.com)

Depending on news flow, the market selldown may break the above-mentioned supports and send the index all the way to the long-term uptrend line support of 1700. We will see whether this long-term uptrend line will hold or be violated.


Chart 2: FBMKLCI's monthly chart as at May 24, 2018_9.30am (Source: Shareinvestor.com)

A few blue chip stocks look quite attractive even as I am writing this post. They are Maybank at the uptrend line of RM10.00 (it violated that momentarily) and Tenaga at the uptrend line of RM14.40-14.50. Exercise careful discretion in your investment. Good luck!

MBMR: Earnings "rebounded"

Results Update

For QE31/3/2018, MBMR reported a PBT of RM39.2 million as compared to a pre-tax loss of RM202.6 million while revenue rose 4.4% to RM463 million. MBMR's losses incurred in the preceding quarter was mainly due to 3 major impairment losses, which are goodwill written off of RM145.637 million; investment in JV of RM31.030 million and for PPE of RM65.891 million. If these items were excluded, PBT would jump to RM39.9 million.


Table: MBMR's last 8 quarterly results


Graph: MBMR's 48 quarterly results

Valuation

MBMR (closed at RM2.35 yesterday) is now trading at a PER of 11 times (based on adjusted EPS of 22 sen*). In addition, its Price to Book ratio is at 0.6 time only. At these ratios, MBMR is deemed fairly attractive in view of the expected recovery in this sector. In any event, MBMR is trading below the offer price of RM2.56 made by UMW to takeover the company.

(/Note: Adjustment by excluding the 3 major impairment losses explained above.)

Technical Outlook

MBMR has been in a downtrend after it peaked in 2013 at RM4.20. The decline may be arrested by its long-term uptrend line support at RM2.00-2.10. If it can break above its downtrend line, RR at RM2.60-2.65, its next upleg may begin.


Chart 1: MBMR's monthly chart as at May 22, 2018 (Source: ShareInvestor.com)


Chart 2: MBMR's weekly chart as at May 22, 2018 (Source: ShareInvestor.com)

Conclusion

Based on improved financial performance, I would rate MBMR as a BUY due to its strong position in the local automotive sector, good management. and strong asset-backing per share.

Note: 
In addition to the disclaimer in the preamble to my blog, I hereby confirm that I do not have any relevant interest in, or any interest in the acquisition or disposal of, MBMR

Wednesday, May 23, 2018

PENTA: Earnings Continued to Grow

Results Update

For QE31/3/2018, Penta's PBT increased by 23% q-o-q or 76% y-o-y to RM16.5 million while revenue rose 1% q-o-q or 109% y-o-y to RM99 million.

Revenue rose marginally q-o-q mainly due to increase in sales from automated equipment. Taking into account the non-recurring expenses of RM7.1 million, the Group recorded a profit before taxation of RM16.5 million in the current quarter. Should the effects of the non-recurring expenses be excluded, the Group would have exhibited a profit before taxation of RM23.6 million which is RM7.1 million or approximately 42.9% higher than the adjusted profit before taxation of RM16.5 million achieved in the preceding quarter. Profit before taxation increased by 42.9% as compared to the lower increase in revenue of 0.9%, mainly due to better margin secured from projects delivered to customers and higher gain from changes in fair value of the foreign currency forward contracts in the current quarter.


Table: Penta's last 8 quarterly results

 
Graph: Penta's last 21 quarterly results 

Valuation

Penta (closed at RM2.31 yesterday) is now trading at a PER of 21 times (based on last 4 quarters' EPS of 11.24 sen). Based on the earning growth of 14% last year, Penta's PEG ratio of 1.5 times is deemed reasonable.

Technical Outlook

Penta broke above its downtrend line, SS at RM2.10 in May. It may begin its next upleg soon. Immediate support & resistance are at RM2.20 & RM2.40 respectively.


Chart: Penta's weekly chart as at May 22, 2018 (Source: ShareInvestor.com)

Conclusion

Based on good financial performance, reasonable valuation and mildly positive technical outlook, Penta is a good stock for long-term investment.

Note: 

I hereby confirm that I do not have any direct interest in the security or securities mentioned in this post. However, I could have an indirect interest in the security or securities mentioned as some of my clients may have an interest in the acquisition or disposal of the aforementioned security or securities. As investor, you should fully research any security before making an investment decision.

Tuesday, May 22, 2018

BAT: Profits Improved Slightly On Lower Revenue

Result Update

For QE31/3/2018, BAT's net profit rose 23% q-o-q but dropped 16% y-o-y to RM96 million while revenue dropped by 9% q-o-q or 17% y-o-y to RM638 million.

Revenue dropped by 9% q-o-q due to decline in sales volume of 3.0% compared to immediate preceding quarter. The Group registered market share growth from 53.9% in the fourth quarter of 2017 to 54.7% in the first quarter of 2018, as Dunhill registered a 0.5ppt-increase in market share to 38.2% while Value for Money brands increased its market share by 1.2ppt to 30% and Aspirational Premium brands increased their market share marginally from 42 to 44% (despite a drop in volume). As a result of the lower volume performance, BAT's gross profit dropped 5.3% q-o-q. Operating expenses were 39.4% (RM40.6 million) lower than preceding quarter- due to the absence of provision of impairment for prepaid excise duties (compared to RM21 million provided in the preceding quarter), lower distribution & marketing cost and timing of other expenses. Lower operating expenses had more than offset the drop in gross profit- leading to a 23.2%-increase in operating profit. Higher operating profit flowed thru to higher PBT, PAT & NP.


Table: BAT's last 8 quarterly results

BAT's revenue has been on a decline for the past 3 years, with no sign of bottoming out. Profits have been declining in a zig-zag fashion - with the magnitude determined by provisioning exercise or timing of expenses.


Graph: BAT's last 45 quarterly results

Valuation

BAT (closed at RM33.40 yesterday) is now trading at a PER of 20 times (based on the last 4 quarters' EPS of 164.70 sen). BAT has paid out quarterly dividend payment totaling of 162 sen over the past 4 quarters; thus giving a Dividend Yield of 4.85%. If BAT's revenue & profits were to stabilize, the stock will be an attractive stock as these multiples are fairly attractive for a well-managed MNC.

Technical Outlook

BAT is likely to be still in a long-term downtrend. It is now pressing against the 40-week EMA line at RM33.20.


Chart 1: BAT's weekly chart as at May 21, 2018 (Source: Shareinvestor.com)

The immediate support & resistance are at RM32 & RM36.


Chart 2: BAT's daily chart as at May 21, 2018 (Source: Shareinvestor.com)

Conclusion

Based on a still weak financial performance and a still bearish technical outlook, BAT is a stock to be purchased with caution. However once the company's revenue and profits have made a bottom, it could be a good stock to invest in as it is a well-managed company.

Note:
I hereby confirm that I do not have any direct interest in the security or securities mentioned in this post. However, I could have an indirect interest in the security or securities mentioned as some of my clients may have an interest in the acquisition or disposal of the aforementioned security or securities. As investor, you should fully research any security before making an investment decision.

PANAMY: A Bumper Dividend Coming

Results Update

For QE31/3/2018, Panamy's net profit dropped 41% q-o-q or 6% y-o-y to RM27 million while revenue was mixed- dropped by 13% q-o-q but rose 12% y-o-y to RM277 million. Revenue dropped q-o-q mainly due to lower sales from Home Shower products which was seasonally higher in the preceding quarter. As a result, its PBT dropped 34% to RM33.6 million from RM50.9 million in the preceding quarter.


Table: Panamy's last 8 quarterly results


Graph: Panamy's last 52 quarterly results

Valuation

Panamy (closed at RM38.30 yesterday) is trading at a PE of 17.7 times (based on last 4 quarters' EPS of 216 sen). At this PER, Panamy is deemed fairly attractive. In addition, Panamy pays a decent dividend- with DY of 6.5% (including special dividend of RM1.00 per share) or.3.9% (excluding special dividend).

Technical Outlook

Panamy has been range-bound for the past 2 years. Its immediate support & resistance are at RM33 & RM41.


Chart: Panamy's weekly chart as at May 21, 2018 (Source: ShareInvestor.com) 

Conclusion

Despite the weaker financial performance, Panamy is still a good stock for long-term investment based on attractive valuation and positive technical outlook.

Note:
I hereby confirm that I do not have any direct interest in the security or securities mentioned in this post. However, I could have an indirect interest in the security or securities mentioned as some of my clients may have an interest in the acquisition or disposal of the aforementioned security or securities. As investor, you should fully research any security before making an investment decision.

Tuesday, May 15, 2018

Exporters to Benefit from a Stronger USD

Over the past 5 weeks, we have seen a steady increase in USD-MYR pair, from 3.86 to 3.95. This 2% strengthening of USD-MYR may be misconstrued by some to be a weakening of our currency.


 Chart 1: USD-MYR daily chart as at May 15, 2018 (Source: Investing.com)

If MYR is really weakening, then That may explain why the SGD-MYR pair should also hook up. It did not hook up but seems to be trading sideways instead of hooking-up as seen in the earlier chart for unlike USD-MYR pair. The reason for USD-MYR hooking up is the strengthening in USD.


 Chart 2: SGD-MYR daily chart as at May 15, 2018 (Source: Investing.com)

If we can look the chart below, we will see that USD index has broken above its downtrend line, RR at 90.5 in April. The upside breakout of USD index marked the start of an uptrend for USD. When this move becomes more pronounced, we will likely see an improvement in the sentiment for our exporters. 


Chart 3: USD index's daily chart as at May 11, 2018 (Source: Stockcharts.com)

Let's look at the O&G sector. This sector should benefit more in the medium-term from both the strengthening of the USD and improving crude oil prices. We have seen Brent crude rising from as low as USD45 in June last year to USD77 today.


Chart 4: Brent's daily chart as at May 11, 2018 (Source: Stockcharts.com)

O&G stocks seems to move in tandem with the rising Brent prices. However O&G share prices started to consolidate & trade sideways since February this year. That coincided with the continued drop in USD-MYR during that period. See the next two composite charts below.


Chart 5: Brent, Hibiscs & Armada's daily chart as at May 11, 2018 


Chart 6: USD-MYR, Hibiscs & Armada's daily chart as at May 11, 2018 

Next, we will look at the semiconductor stocks. These stocks have dropped about 50% since November last year. This sharp drop happened even though the Philadelphia Semiconductor Index (SOX) appears to be in an uptrend line- which was only convincingly violated in Mar this year.


Chart 7: SOX's daily chart as at May 11, 2018 (Source: Stockcharts.com)

The drop in semiconductor share prices seem to be closely correlated to the weakening of the USD-MYR pair. They seem to be indifferent to the continued rise in SOX. Based on this, I believe semiconductor share prices will likely recover once USD-MYR pair begins to rise- notwithstanding the weakness in SOX. See the next two composite charts below.


Chart 8: USD-MYR, Unisem & MPI's daily chart as at May 11, 2018 


Chart 9: SOX, Unisem & MPI's daily chart as at May 11, 2018 

Based on the above, I would recommend that you track USD-MYR closely if you want to get into some good O&G stocks as well as buying Unisem & MPI. Other exporters, such as furniture makers & EMS players, should also benefit from a rising USD. Good luck!

Monday, May 14, 2018

Opcom: Too Good to Pass Up?

Just before GE14, I posted that Opcom's rally was overdone. I still stand by my previous take on the stock. However, I would readily admit that it may exceed my expectation as it is a penny stock. Most penny stocks are strange creatures that move at the rhythm of the more volatile players in our market- the retail players. Once a retail player buys into a trading idea, there is no stopping him or her. 

If you have the stock, your goal is to exit before the game ends. If you don't have the stock, and you feel lucky, be my guest. I'm a cautious man who subscribes to the principle that one bird in hand is better than two in the bush. 

Opcom will probably to revisit its May 8 intraday high of RM0.68. If it can break above that level, it may surge to RM0.80-0.85. It may even try to entice you with the prospect of a limit-up at RM0.905. If that came to pass, you must know what to do. Remember Mae West's famous quote: Too much of a good thing can be wonder! 


Chart: Opcom's daily chart as at May 8, 2018 (Source: Shareinvstor.com)

Sunday, May 13, 2018

Airasia: Business & Politics Do Not Mix

In the final week of the GE14 campaign, we saw Tony Fernandes of Airasia endorsing BN. After what has happened to Stanley Thai - who famously endorsed Anwar in 2013 - I thought it was rather reckless of Tony to do the same. 

Like Stanley Thai before him, Tony's action did not work out quite as well as he has hoped for. Not only did Tony anger a whole lot of Malaysians - who are majority Airasia customers - his action could have no effect at all on the outcome of the election. In an economy where the common man is feeling the pinch from high cost of living, the last thing he wants to hear before he cast his ballot is the sweet advice from a billionaire. Gosh, what happened to Najib's savvy political team.

Anyway, the second episode to this saga has it that Tony was actually forced to endorse BN. Airasia's chair person, Rafidah & political wonder boy, Syed Saddiq have now spoken out in support of Tony. We will leave this story at that and look at the chart.

Airasia is in a long-term uptrend line, SS. I believe it will take a heavy knock tomorrow, which could possibly send the share price to the uptrend line support at RM3.30. That's a hefty 11% drop from its close at RM3.70. At this level, I think support should come in.


Chart 1: Airasia's weekly chart as at May 8, 2018 (Source: Shareinvestor.com)

AAX is the long-haul operation of the Airasia group. It is also the operation that's still finding its footing and is barely profitable. This stock has a tentative long-term uptrend line, SS with support at RM0.35. Since its close was at RM0.375, the uptrend line support at RM0.35 may not hold. If it breaks, AAX may test the lower line of its expanding triangle, ABCD at RM0.30. That's a hefty drop of 20% from its close. I seriously doubt this level of RM0.30 will be tested but if it did, it should hold.


Chart 2: AAX's weekly chart as at May 8, 2018 (Source: Shareinvestor.com)

Airasia is a Malaysian success story and a great export to the world. I sincerely hope that it would not be dragged down by Tony's endorsement of Najib & BN. The short-term weakness in the share price could be an opportunity for investors who want to get into the stock. Good luck!

Market Outlook as at May 13, 2018

GE14 brought a HUGE surprise for all Malaysians – the defeat of omnipotent BN. It is generally true that whatever is good for Malaysia will also be good for the stock market. Alas, the "upset" in GE14 will likely be one of the exceptions to that rule!

It is fair to say that while the market was nervous ahead of the election, it was still pricing in the usual BN win. As such, the unexpected election outcome will lead to a period of heightened political uncertainties, and any uncertainty will likely be viewed as a negative surprise for the market.  

In the short term, I believe the market will undergo a sell-off. How long & deep will the sell-off be, are hard to predict. The appointment of Lim Guan Eng to the post of Finance Minister and the setting up of the Council of Elders (comprising of prominent individuals) may instill a degree of confidence in the market. However this good work can be undone by other development - including internal squabble between the parties in Pakatan Harapan.

From the chart below, I believe that FBMKLCI should have good support at 1800. If that support is violated, it may drop to the long-term uptrend line, SS at 1750.

Chart: FBMKLCI's weekly chart as at May 8, 2018 (Source: Shareinvestor.com)

Pakatan Harapan has proposed the cancellation of the Goods and Services Tax (GST) and raising minimum wage. These measures will boost consumers' spending; thus benefiting the consumer stocks.

Here is a short list of consumer stocks (with closing prices) to consider:
  • Blue chip stocks: BAT (RM22.46), HEIM (RM20.46), CARLSBG (RM17.88), PANAMY (RM34.74) and AJI (RM21.88).
  • 2nd liner stocks: PADINI (RM4.50), MFLOUR (RM1.52), KAWAN (RM1.95), GCB (RM1.45), CAB (RM0.835), CCK (RM1.45) and ASIAFLE (RM2.68).
Pakatan Harapan has promised to review major public projects, such as the East Coast Rail Link (ECRL) and the Kuala Lumpur-Singapore High Speed Rail (HSR), as well as improving the government procurement processes. Both of these measures will likely lead to a  slowdown in large-scale projects over the short and medium term. Thus, they are expected to have a negative impact on the construction and building material sectors. The top losers are likely to be:
  • GAMUDA (RM5.10) – with exposure to MRT 3 and HSR
  • YTL (RM1.33) – with exposure to HSR and Gemas-JB rail double tracking
  • MRCB (RM1.00)– with exposure to HSR 

In the long run, the change of government may lead to a restructuring of the Malaysian economy which could be beneficial to the people and the nation. If our new leaders - including one 92 years young leader - can truly restructure & rejuvenate our economy, then the outlook will be good a few years down the road. The history of Malaysia is about to be re-written and we are all part of that story. 

Tuesday, May 08, 2018

Opcom: A Poisoned Chalice?

Yesterday I posted about the excitement of a possible Pakatan victory in GE14 causing havoc & sharp correction in the stock market. One stock has done the exact opposite- Opcom. This stock is linked to Mokhzani Mahathir and is now a darling in the eyes of punters. For more information on Opcom & Mokhzani's position in the company, go here.

Assuming that Pakatan victory is a done deal - which I doubt - it would be obvious that Opcom will have a tougher time getting contracts from the government for the initial few years because it would be accused of favoritism. On the other hand, if BN win the GE14, you can put Opcom at the bottom of the list of any company tendering for government projects.

If you have Opcom shares, you are one lucky fella in the market today. Remember what I wrote about Mr. Market yesterday? Let that be your guide on what to do if you have the stock or if you don't have the stock.


Chart: Opcom's daily chart as at May 8, 2018_10.00am (Source: Shareinvestor.com)

Monday, May 07, 2018

Mr. Market is Really Depressed

"This imaginary person out there - Mr. Market - he's kind of a drunken psycho. Some days, he gets very enthused, some days he gets very depressed. And when he gets really enthused, you sell to him and if he gets depressed, you buy from him. There's no moral taint attached to that." 

Warren Buffet

Over the past few weeks, our market has been dropping due to uncertainty in the political arena. That's the dominant force in the market now- replacing the previously cautiously optimistic market outlook driven by improving economic numbers, better crude oil prices and strengthening of MYR.

Since the date for the GE14 has been announced, the institutional investors have turned cautious on the market outlook due to concern of an opposition victory. These worldly wise fund managers, whose tenure and income depend on their ability to move with the crowd, have turned decidedly depressed and began to sell in the market.

Mr. Buffet has rightly pointed out that when Mr. Market sells at depressed & attractive prices, you should buy from him. That's no easy feat. Our fear of making a loss in the market tends to drive us into doing the exact opposite; that's by joining in the selling stampede.

There are three questions that you need to consider:
Firstly, what if Pakatan wins?! You will have a government that's very similar to previous BN government when Dr. M was the premier. Sure, it will be a less cohesive alliance but the incoming governing coalition will probably sort itself out after a few weeks. These are no greenhorns. The core leaders have been governing the two most populous & wealthiest states in the country- Selangor & Penang.

Secondly, how much lower would share prices drop?! Let's face it, the share prices have been dropping because of precisely the above scenario. If the share prices have captured 100% of this fear - and don't be surprised if it has over-priced this fear - then it is likely that share prices may not drop on May 14 (the next Monday).

Thirdly, what if BN wins?! I can leave that to your imagination what the market will do.

Let's conclude. While a Pakatan victory is possible, I still believe a BN victory is more likely due to gerrymandering, Sabah & Sarawak safety net and the disruptive role played by PAS. In the less likely event of a Pakatan victory, the share price may drop a bit more since the bulk of the decline would have taken place by now. On the other hand, if BN wins again, it will be Boomtown Charlie for those brave & stubborn souls who stick to their shares.

This is just my opinion. It is easier for me to pen this opinion since the share prices have dropped so very much. If you are one of the unlucky ones who hasn't sold enough, think again. If you are on the opposite side of the fence, will your task be easier?! In the market, you have to be as rational as possible, weighing the probability of an event occurring and the risk and reward that flowed from that outcome.

Good luck and happy voting!!


Chart 1: FBMKLCI's daily chart as at May 7, 2018_11.00am (Source: Shareinvestor.com)


Chart 2: FBM70's daily chart as at May 7, 2018_11.00am (Source: Shareinvestor.com)

From the charts above, I believe FBMKLCI & FBM70 should be well-supported going into the penultimate day of the GE14 campaign.