Showing posts with label Harta. Show all posts

Thursday, October 22, 2020

Glove Stocks: Is That A Temporary Top?

Yesterday, glove stocks dropped sharply. The sell-off came after a 4-day lull in upward price movement for most of the big 4 glove stocks (except for Harta). The price drop yesterday broke the uptrend line in the current rally for most of the glove stocks, which began on 11 September. Unless the share prices can recover above the violated uptrend lines, the glove stocks could well have made a temporary top. 

Chart 1: Harta's daily chart as at Oct 21, 2020 (Source: Malaysiastock.biz)

Chart 2: Kossan's daily chart as at Oct 21, 2020 (Source: Malaysiastock.biz)

Chart 3: Supermx's daily chart as at Oct 21, 2020 (Source: Malaysiastock.biz)

Chart 4: Topglov's daily chart as at Oct 21, 2020 (Source: Malaysiastock.biz)

With increasing news flow of the imminent arrival of vaccines, investors would have to weigh the return from holding onto their glove stocks against the risks that the rally may have peaked. In times like this, investors should consider taking some cash off the table. Redeploying the proceed to some deeply sold-down stocks, like AIRPORT or GENTING, may be a good diversification strategy to benefit from the arrival of the vaccines and the normalization of life as we know. Good luck! 

Wednesday, August 07, 2019

Harta: Earnings Dropped 25% Due to Lower Revenue

Result Update

For QE30/6/2019, Harta's net profit rose 3% q-o-q but dropped 25% y-o-y to RM94 million while revenue dropped 6% q-o-q or 9% y-o-y to RM640 million. Revenue dropped q-o-q mainly due to decrease in sales volume for the quarter. Profit before tax for the quarter increased by RM8.0 million or 7.0% as compared with preceding quarter mainly due to lower cost of upkeep, electricity and packaging.


 Table: Harta's last 8 quarterly results


Graph: Harta's last 47 quarterly results

Financial Position

As at 30/6/2019, Harta's financial position is deemed healthy with current ratio at 2.56x and gearing ratio at 0.31x.

Valuation

Harta (closed at RM5.05 yesterday) is trading at a trailing PER of 40 times (based on last 4 quarters' EPS of 12.58 sen). At this PER, Harta is deemed overvalued.

Technical Outlook

Harta is in an uptrend line, with support at RM4.80.


Chart 1: Harta's daily chart as at Aug 6, 2019 (Source: Malaysiastock.biz)


Chart 2: Harta's monthly chart as at Aug 6, 2019 (Source: Malaysiastock.biz)

Conclusion

Based on weaker financial performance and demanding valuation, I rate Harta as a SELL or TAKE PROFIT.

Note:
I hereby confirm that I do not have any direct interest in the security or securities mentioned in this post. However, I could have an indirect interest in the security or securities mentioned as some of my clients may have an interest in the acquisition or disposal of the aforementioned security or securities. As investor, you should fully research any security before making an investment decision.

Wednesday, May 15, 2019

Market Outlook as at May 15, 2019

FBMKLCI has managed to climb back above 1600. The index may continue to go higher in the next few days though it may be interrupted by the public holidays on next Monday & Wednesday. After the short rebound - which may touch 1630-1635 - the market will likely drift sideways for a while due to global uncertainties such as geopolitical problems between US & Iran (impacting crude oil prices) as well as continuing trade war rhetoric between US and China (impacting global trade). 


Chart 1: FBMKLCI daily chart as at May 15, 2019_10.54am (Source: Malaysiastock.biz)

It is worth noting that USD-MYR has broken above the 4.15 mark, and it could rally quickly to 4.19-4.20. A break above 4.20 will bring out fear of economic problem in the country, which would depress the market sentiment.


Chart 2: USD-MYR daily chart as at May 15, 2019_11:00am (Source: Investing.com)

There will always be winners and losers if the ringgit were to weaken. The usual winners will be the exporters, and none would benefit more than the glove makers. You can see Harta has once again broken above its intermediate downtrend line today.


Chart 3: Harta daily chart as at May 15, 2019_10.45am (Source: Malaysiastock.biz)

As always, a sharp plunge in the market after a prolonged decline has a cathartic effect on the market players. We are seeing a relief rally today and we can adjust our position accordingly so that we will be better position for the next move. Good luck!

Wednesday, May 08, 2019

Harta: Earnings Dipped

Result Update

For QE31/3/2019, Harta's net profit dropped 24% q-o-q or 22% y-o-y to RM91 million while revenue was mix- down 5% q-o-q but up 11% y-o-y to RM684 million. Revenue dropped q-o-q mainly due to lower average selling price for the quarter. Profit before tax for the quarter eased by RM36.3 million or 24% mainly due to sharp strengthening of the ringgit in a short time frame as the Group was unable to pass on the corresponding cost increase to customers in a timely manner. Other factors such as lower average selling price, higher upkeep of office equipment, plant & machinery cost and labor also contributed to lower profits for the quarter.


 Table: Harta's last 8 quarterly results


Graph: Harta's last 53 quarterly results

Financial Position

As at 31/3/2019, Harta's financial position is deemed healthy with current ratio at 1.85x and gearing ratio at 0.32x.

Valuation

Harta (closed at RM5.05 yesterday) is trading at a trailing PER of 37 times (based on last 4 quarters' EPS of 13.74 sen). At this PER, Harta is deemed fully valued.

Technical Outlook

Harta has been declining in a downtrend line (RR) with resistance at RM.10. Until Harta had surpassed this downtrend line, its share price will remain weak. However, the rising low may provide support (SS) at RM4.70.


Chart: Harta's daily chart as at May 7, 2019 (Source: Malaysiastock.biz)

Conclusion

Despite weaker result & demanding valuation, Harta is considered a good stock for long-term investment based on capable management team and strong leadership in the glove sector.

Note:
I hereby confirm that I do not have any direct interest in the security or securities mentioned in this post. However, I could have an indirect interest in the security or securities mentioned as some of my clients may have an interest in the acquisition or disposal of the aforementioned security or securities. As investor, you should fully research any security before making an investment decision.

Wednesday, August 08, 2018

HARTA: Strong Earning & Revenue Growth

Result Update

For QE30/6/2018, Harta's net profit rose 7% q-o-q or 30% y-o-y to RM125 million while revenue rose 15% q-o-q or 18% y-o-y to RM706 million. Revenue increased q-o-q driven by higher sales volume which increased by 6.4% and higher average selling prices. PBT rose 8% q-o-q in line with higher sales revenue attained, lower heat cost, chemical cost, upkeep of plant & machinery and improved operational efficiency.


 Table: Harta's last 8 quarterly results


Graph: Harta's last 43 quarterly results

Valuation

Harta (closed at RM6.17 yesterday) is trading at a trailing PER of 44 times (based on last 4 quarters' EPS of 14.16 sen). At this PER, Harta is deemed fully valued. However, its PEG ratio is fairly reasonable at 1.2 times based on EPS CAGR of 37% over the past 2 years.

Technical Outlook

Harta is trapped within a symmetrical triangle. If it can break to the upside of the triangle at the RM6.20, its uptrend will likely continue.


Chart 1: Harta's daily chart as at Aug 7, 2018 (Source: Shareinvestor.com)


Chart 2: Harta's weekly chart as at Aug 7, 2018 (Source: Shareinvestor.com)

Conclusion

Based on improved operating performance, strong leadership in the glove sector and capable management team, Harta is considered a good stock for long-term investment. Its rating is kept at HOLD due to its demanding valuation.

Note:
I hereby confirm that I do not have any direct interest in the security or securities mentioned in this post. However, I could have an indirect interest in the security or securities mentioned as some of my clients may have an interest in the acquisition or disposal of the aforementioned security or securities. As investor, you should fully research any security before making an investment decision.

Thursday, February 08, 2018

Harta: Bonus is coming

Result Update

For QE31/12/2017, Harta's net profit rose 71% y-o-y to RM113 million while revenue rose 32% y-o-y - to RM603 million. Compared to the immediate preceding quarter, PBT rose a meager 1% on the back of a 3%-increase in revenue while net profit was unchanged.

Revenue increased 3% q-o-q driven by higher sales volume which increase by 4.0% in line with increasing demand from customers. PBT rose 1% q-o-q mainly due to higher sales volume despite lower average selling price.


 Table: Harta's last 8 quarterly results


Graph: Harta's last 41 quarterly results

Proposed Bonus Issue

Harta has proposed a 1-for-1 bonus issue when it announced its latest results. This is the 4th bonus issue after the earlier 3 bonus issue of shares and 1 bonus issue of warrants:
  • In Sep 2010, bonus issue of shares of 1-for-2
  • In May 2012, bonus issue of shares of 1-for-1 cum bonus issue of warrants of 1-for-5
  • In Sep 2015, bonus issue of shares of 1-for-1
Valuation

Harta (closed at RM11.50 yesterday) is trading at a trailing PER of 46 times (based on last 4 quarters' EPS of 25.03 sen). This high PER can only be justified by the high earning growth of 60% achieved in the past 4 quarters. 

The group may be able to sustain this high earning growth based on the recent statement to the press, Harta managing director Kuan Mun Leong updated that the group’s Next Generation Integrated Glove Manufacturing Complex (NGC) is well on schedule to meet growing demand. "We have completed commissioning of Plant 4 with all 12 production lines operational and construction has commenced on Plant 5. In addition to this, we aim to launch our world-first non-leaching antimicrobial nitrile examination gloves by the second quarter of 2018.” For more, go here.

Technical Outlook

Harta is in a long-term uptrend, with share prices moving within an upward channel. The price movement was so bullish that it broke above the upper line of the channel at RM8.00, and rose to a high of RM12.18!


Chart 1: Harta's monthly chart as at Feb 7, 2018 (Source: Shareinvestor.com)

Looking at the weekly chart below, I believe the upside for Harta in the near term is fairly limited. On the other hand, it is possible to it to pullback to RM10.00 over the next few months.


Chart 2: Harta's weekly chart as at Feb 7, 2018 (Source: Shareinvestor.com)

Conclusion

Despite the improved operating performance, strong leadership in the glove sector and capable management team, I think it is a good time to take some profit on this stock.

Note:
I hereby confirm that I do not have any direct interest in the security or securities mentioned in this post. However, I could have an indirect interest in the security or securities mentioned as some of my clients may have an interest in the acquisition or disposal of the aforementioned security or securities. As investor, you should fully research any security before making an investment decision.

Tuesday, January 02, 2018

Harta: Earnings Shot Up!!

Result Update

For QE30/9/2017, Harta's net profit rose 18% q-o-q or 59% y-o-y to RM113 million while revenue was mixed - down 3% q-o-q but up 34% y-o-y - to RM585 million. Revenue dropped q-o-q mainly due to lower average selling price arising from more competitive pricing but the sales volume increased by 5.2% due to increase in demand. PBT rose q-o-q mainly due to lower nitrile and latex cost, lower chemical cost and improvement in operation efficiency.


 Table: Harta's last 8 quarterly results


Graph: Harta's last 40 quarterly results

Valuation

Harta (closed at RM10.68 last Friday) is trading at a trailing PER of 48 times (based on last 4 quarters' EPS of 22.21 sen). At this PER, Harta has surpassed Nestle in term of trailing PER. At RM103.20, Nestle's trailing PER is now at 42 times!

Technical Outlook

Harta broke above a upward "Cup with handle" formation at RM7.80. Assuming a 1-to-1 extension, Harta should reach a high of RM10.20. Well it did better than that. It overshot the RM11.00 before correction set in. How long will correction last? Only time will tell.


Chart: Harta's weekly chart as at Dec 29, 2017 (Source: Malaysiastock.biz)

Conclusion

Based on improved operating performance, strong leadership in the glove sector and capable management team, Harta is considered a good stock for long-term investment. Its rating is kept at HOLD due to its demanding valuation.

Note:
I hereby confirm that I do not have any direct interest in the security or securities mentioned in this post. However, I could have an indirect interest in the security or securities mentioned as some of my clients may have an interest in the acquisition or disposal of the aforementioned security or securities. As investor, you should fully research any security before making an investment decision.

Thursday, October 12, 2017

Topglov & Harta: Upside Breakout

Topglov and Harta have both broken above their downtrend line. In both cases, the upside breakout was followed by strong rally on substantial volume. For Topglov, the breakout level was at RM5.70 and, for Harta, it was at RM7.00. Since Kossan and Supermx have not witnessed similar upside move, I suspect there is a joint development involving Topglov and Harta. Could it be a merger of these companies? Only time will tell...


Chart 1: Harta's daily chart as at Oct 12, 2017_4.00 (Source: Malaysaistock.biz)


Chart 1: Topglov's daily chart as at Oct 12, 2017_4.00 (Source: Malaysaistock.biz)

Based on the bullish breakout, Topglov and Harta are possible trading BUY. Good luck.

Wednesday, August 09, 2017

Harta: Earning Growth Continued

Result Update

For QE30/6/2017, Harta's net profit rose 8% q-o-q or 72% y-o-y to RM96 million while revenue rose 14% q-o-q or 50% y-o-y to RM601 million. Revenue rose q-o-q due to increase in sales volume and average selling price. Profit before tax dropped 2.3% q-o-q mainly due to higher upkeep cost, depreciation expense, packaging material cost, chemical cost and term loan interest expense.


 Table: Harta's last 8 quarterly results


Graph: Harta's last 39 quarterly results

Valuation

Harta (closed at RM7.15 yesterday) is trading at a trailing PER of 36 times (based on last 4 quarters' EPS of 19.68 sen). At this PER, Harta is overvalued.

Technical Outlook

Harta is in a long-term uptrend line, with strong support at the 20-month EMA line at RM5.00. Harta needs to consolidate its recent gain and/or wait for its profit to grow further before the uptrend can continue.


Chart: Harta's monthly chart as at Aug 8, 2017 (Source: shareinvestor.com)

Conclusion

Based on improved operating performance, strong leadership in the rubber glove sector & capable management team, Harta is considered a good stock for long-term investment. Its rating is kept at HOLD due to its demanding valuation.

Note:
I hereby confirm that I do not have any direct interest in the security or securities mentioned in this post. However, I could have an indirect interest in the security or securities mentioned as some of my clients may have an interest in the acquisition or disposal of the aforementioned security or securities. As investor, you should fully research any security before making an investment decision.

Tuesday, May 09, 2017

Harta: Bullish Breakout


In the past few weeks, I have noticed the steady decline in the share prices of Kossan & Topglov. I attribute the weakness in the share price to the strengthening of our MYR. Exporters receiving foreign currency proceed will be getting proceed in MYR. If they can sell forward in the past to protect their revenue (and assured themselves of their profit), this safeguard was withdrawn by BNM a few weeks ago. Hence. exporters are losing out as our MYR strengthens. All's fair in business & economy; what goes up must comes down!!


Chart 1: Kossan's daily chart as at May 9, 2017_11.45 (Source: Malaysiastock.biz)


Chart 2: Topglov's daily chart as at May 9, 2017_11.45 (Source: Malaysiastock.biz)
 
Strangely, Harta was able to maintain its share price at RM4.80-4.90 while Kossan & Topglov were sliding during that period. I noted the anomaly but did nothing about it. Yesterday Harta broke above the RM5.00 psychological after Kossan & Harta had a strong rebound over the past 2 days. 

 
Chart 3: Harta's daily chart as at May 9, 2017_11.45 (Source: Malaysiastock.biz)  

Today we are faced with the age-old dilemma in the stock market: Do you buy a stock that has declined or one had a bullish breakout? If we rephrase that choice between buying a cheaper stock versus a pricey stock, the answer is obvious! However, we "koew" why Kossan & Topglov dropped earlier but we don't know why Harta didn't drop. We "know" why Kossan & Topglov are rebounding but we don't know why Harta is breaking out to the upside. Again, we tend to go with what we know (or think we know). Thus, the choice is obvious. If you have been in the market long enough, and have a memory of an elephant, you will know that if you can't invest based on the obvious case.

My choice is to go with technical analysis. I will choose Harta for a bullish breakout, and to avoid Kossan & Topglov as their prices are in an intermediate downtrend. Good luck!

Wednesday, February 15, 2017

Harta: Improved Operating Performance Masked By Forex Losses

Result Update

For QE31/12/2016, Harta's net profit dropped by 7% q-o-q or 9% y-o-y to RM66 million while revenue rose 4% q-o-q or 15% y-o-y to RM456 million. Revenue rose q-o-q due to increase in demand and the strengthening of the USD. The operating profit margin increased from 20.1% to 23.6% basically due to the reduction of operation overhead, improved operation efficiency and strengthening of USD. Despite higher revenue & better operating profit margin, Harta's profit before tax dropped q-o-q due to the recognition of unrealized foreign exchange loss and fair value loss of foreign exchange contracts.


 Table: Harta's last 8 quarterly results


Graph: Harta's last 37 quarterly results

Valuation

Harta (closed at RM4.75 yesterday) is trading at a trailing PER of 31 times (based on last 4 quarters' EPS of 15.55 sen). Harta is still trading at very demanding multiple.

Technical Outlook

Harta is in a long-term uptrend line, with support at RM4.40-4.50.


Chart: Harta's weekly chart as at Feb 14, 2017 (Source: MalaysiaStock.Biz)

Conclusion

Based on improved operating performance, strong leadership in the rubber glove sector & capable management team, Harta is considered a good stock for long-term investment. Its rating is kept at HOLD due to demanding valuation.

Note:
I hereby confirm that I do not have any direct interest in the security or securities mentioned in this post. However, I could have an indirect interest in the security or securities mentioned as some of my clients may have an interest in the acquisition or disposal of the aforementioned security or securities. As investor, you should fully research any security before making an investment decision.

Tuesday, May 03, 2016

Harta: Earnings Disappoints

Result Update

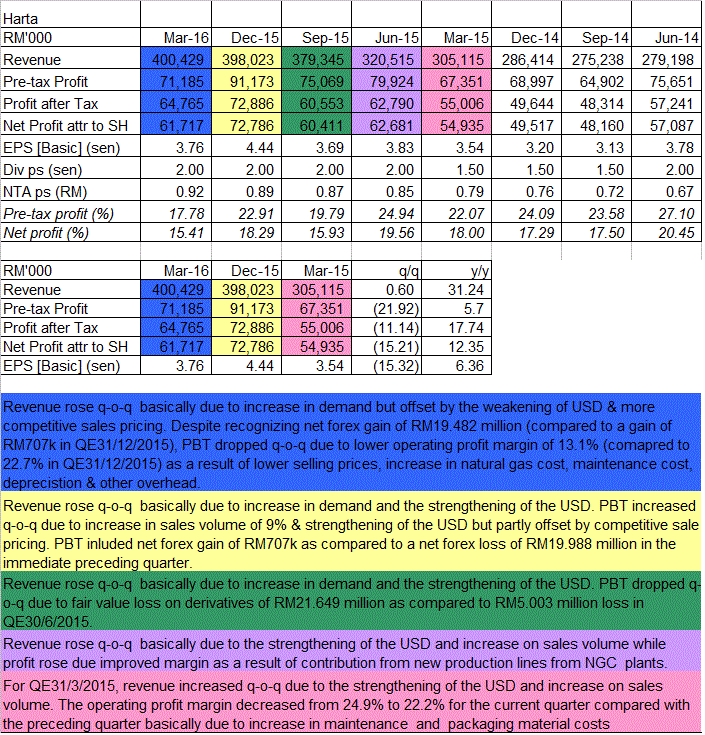
For QE31/3/2016, Harta's net profit dropped by 15% q-o-q but rose by 12% y-o-y to RM62 million while revenue was relatively unchanged q-o-q but rose 31% y-o-y to RM400 million. Revenue rose q-o-q  basically due to increase in demand but was offset by the weakening of the USD & more competitive sales pricing. Despite recognizing net forex gain of RM19.482 million (compared to a gain of RM707k in QE31/12/2015), PBT dropped q-o-q due to lower operating profit margin of 13.1% (compared to 22.7% in QE31/12/2015) as a result of lower selling prices, increase in natural gas cost, maintenance cost, depreciation & other overheads.


 Table: Harta's last 8 quarterly results


Chart 1: Harta's last 34 quarterly results

Valuation

Harta (closed at RM4.14 today) is trading at a trailing PER of 26 times (based on last 4 quarters' EPS of 15.72 sen). Despite a 17%-drop from RM4.98 since mid-February, Harta is still trading at fairly demanding multiple.

Technical Outlook

Harta tested its accelerated uptrend line, S1-S1 support at RM4.00. If this uptrend line holds, the stock will attempt to build a base here. Failure to do so will send the stock to its long-term uptrend line, SS support at RM3.20.


Chart 2: Harta's monthly chart as at May 3, 2016 (Source: Share Investor)

Conclusion

Based on strong leadership in the rubber glove sector & capable management team, Harta is considered a good stock for long-term investment. However, the stock is over-priced due to high expectation of rapid growth which has yet to materialize. Since its recent sharp drop, the rating of SELL INTO STRENGTH is now revised to HOLD.

Note: 
In addition to the disclaimer in the preamble to my blog, I hereby confirm that I do not have any relevant interest in, or any interest in the acquisition or disposal of, Harta.

Wednesday, February 17, 2016

Harta: Earnings increased sequentially

Result Update

For QE31/12/2015, Harta's net profit rose by 20% q-o-q or 47% y-o-y to RM73 million while revenue rose 5% q-o-q or 39% y-o-y to RM398 million. Revenue rose q-o-q  basically due to increase in demand and the strengthening of the USD. This has more than offset the impact of competitive sale pricing and led to higher PBT. PBT also benefited from net forex gain of RM707k as compared to a net forex loss of RM19.988 million in the immediate preceding quarter.


 Table: Harta's last 8 quarterly results


Chart 1: Harta's last 33 quarterly results

Valuation

Harta (closed at RM4.98 yesterday) is trading at a trailing PER of 32 times (based on last 4 quarters' EPS of 15.49 sen). At this PER, Harta is deemed over-valued.

Technical Outlook

Harta is in a long-term uptrend over the past 6 years. Its long-term uptrend is well-supported by the 21-month EMA line at RM4.50 while its intermediate uptrend is supported by the 10-month SMA line at RM4.50.


Chart 2: Harta's monthly chart as at Feb 16, 2016 (Source: Share Investor)

Conclusion

Based on strong leadership in the rubber glove sector, good financial performance & capable management team, Harta is considered a good stock for long-term investment. However, the stock deserves only a rating of SELL INTO STRENGTH due to its demanding valuation.

Note: 
In addition to the disclaimer in the preamble to my blog, I hereby confirm that I do not have any relevant interest in, or any interest in the acquisition or disposal of, Harta.
Friday, November 06, 2015

Harta: Earnings dipped sequentially due to fair value losses

Result Update

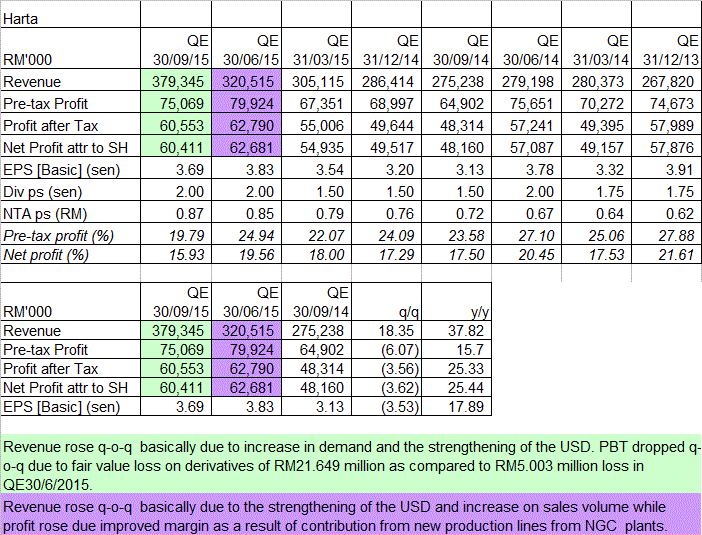
For QE30/9/2015, Harta's net profit was mixed; down 4% q-o-q but up 25% y-o-y to RM60 million while revenue rose 18% q-o-q or 38% y-o-y to RM379 million. Revenue rose q-o-q  basically due to increase in demand and the strengthening of the USD. PBT dropped q-o-q due to fair value loss on derivatives of RM21.649 million as compared to RM5.003 million loss in QE30/6/2015.


 Table: Harta's last 8 quarterly results


The huge fair value loss reminds me of a similar loss suffered by Kossan in 2009. In business, you have to hedge your risk against the occurrence of certain events. Under normal circumstances, the risk distribution is bell-shaped and the tails risk is minimal. Our MYR weakness should fall under the fat tails category where losses (and gains) are disproportionately higher. It probably would not recur in the next quarter or if it does recur, the losses would be less severe.

I have presented below the adjusted bottom-line for Harta (without the fair value losses from forex) and it shows its bottom-line and profit margin to be better.


Chart 1: Harta's last 32 quarterly results, with fair value losses from forex derivatives excluded 

Valuation

Harta (closed at RM5.22 yesterday) is trading at a trailing PER of 37 times (based on last 4 quarters' EPS of 14.25 sen). At this PER, Harta is deemed over-valued.

Technical Outlook

Harta is in a long-term uptrend over the past 6 years. Its long-term uptrend is well-supported by the 21-month SMA line at RM4.00 while its intermediate uptrend is supported by the 10-month SMA line at RM4.50. Neither one of these support is likely to be tested anytime soon. However, Harta is now trading a fair distance above the 10-month SMA line. In 2013, when a similar price run-up occurred, the stock then entered into a fairly sustained correction back to the 21-month SMA line.


Chart 3: Harta's monthly chart as at Nov 5, 2015 (Source: Share Investor)

Conclusion

Based on strong leadership in the rubber glove sector, good financial performance & capable management team, Harta is considered a good stock for long-term investment. However, its demanding valuation & recent sharp price run-up has pushed the stock to be rated as SELL INTO STRENGTH again.

Note: 
In addition to the disclaimer in the preamble to my blog, I hereby confirm that I do not have any relevant interest in, or any interest in the acquisition or disposal of, Harta.