Showing posts with label technology. Show all posts

Thursday, February 25, 2021

EFORCE: Revenue & Earnings Continued to Grow

Result Update

For QE31/12/2020, EForce's net profit rose 48% q-o-q or 142% y-o-y to RM3.9 million while revenue rose 3% q-o-q or 59% y-o-y to RM9.2 million. Revenue grew steadily due to "continuing interest of retail investors in Bursa securities sustained the overall high daily trading volume in quarter 4. Hence the sustained growth in our increase in Application Services Providers (“ASP”) revenue. However, our Application Solution (AS) segment performance was flat to last year. System enhancement project implementations resumed earnestly in this quarter, and billings for work done expected next year."


Table: EForce's last 8 quarterly results


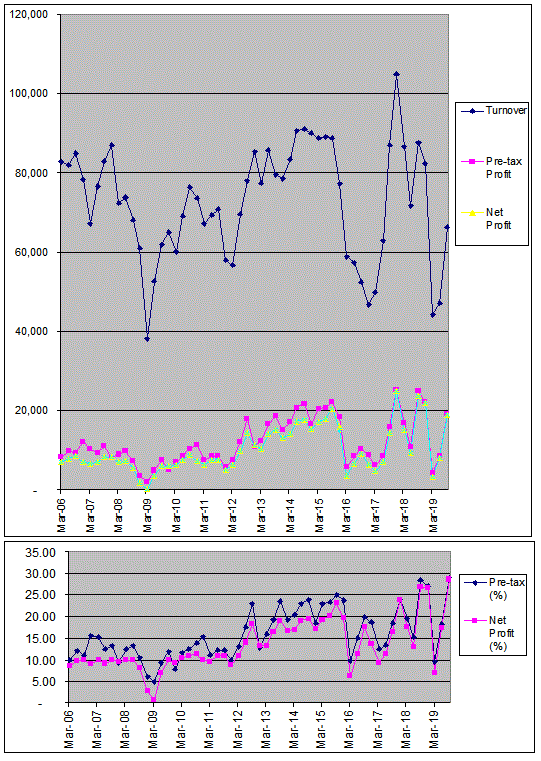
Graph: EForce's last 48 quarterly results  

Financial Position

As at 31/12/2020, EForce's financial position is deemed very healthy with current ratio at 5.7 times. The company has cash balance of RM22.9 million (or equivalent to 3.7 sen per share). It has no borrowing. 

Valuation

EForce (closed at RM0.46 yesterday) is now trading at a PE of 24 times (based on last 4 quarters' EPS of 1.90 sen). Based on this PE ratio, EForce is deemed fairly valued.

Technical outlook

EForce is trading not far from the line connecting the last 5 years' lows (excluding the Mar 2020 extreme low) at RM0.40-0.42. If we drew a line connecting all the lows (including the Mar 2020 extreme low), that baseline will act as support at RM0.25. At this moment, there is no sign that EForce share price is poised for an upside move.

 
Chart: EForce's monthly chart as at Feb 24, 2021 (Source: Malaysiastock.biz)

Conclusion 

Based on improved financial performance, good financial position & reasonable valuation, EForce is a good stock for long term investment.

Note:

I hereby confirm that I do not have any direct interest in the security or securities mentioned in this post. However, I could have an indirect interest in the security or securities mentioned as some of my clients may have an interest in the acquisition or disposal of the aforementioned security or securities. As investor, you should fully research any security before making an investment decision.

Tuesday, February 16, 2021

ARBB: A Promising Small Cap Stock

Background

ARB Berhad ("ARBB") is involved in the manufacture and sales of wood products primarily in Malaysia. It also engages in the provision of scows and tug boats hiring services; consulting services for project management; management services; and timber contracting activities. In addition, the company is involved in reselling customized enterprise resource planning software system and information technology related services.

Results Update

In QE31/12/2020, ARBB's net profit rose 135% q-o-q or 54% y-o-y to RM19.7 million while revenue rose 24% q-o-q or 61% y-o-y to RM72.5 million. The increase in revenue is contributed by Enterprise Resource Planning (ERP) and Internet of Things (IoT) segments. ERP segment is involved in designing and reselling of customised ERP solutions, whereas IoT segment involves in integrated solutions in system (IoT SEPCM). 

Table: ARBB's last 8 quarters' P&L

Graph: ARBB's last 58 quarters' of P&L

Financial Position

As at 31/12/2020, ARBB's financial position is deemed satisfactory with current ratio at 6.3 times while Total Liabilities to Total Equity stood at 0.4 times.

Valuation

ARBB (at yesterday's closing price of RM0.335) is now trading at a PE of 3.1 times (based on last 4 quarters' EPS of 10.87 sen). At this PE, ARBB is deemed fairly attractively.

Technical Analysis

ARBB is poised to break above its downtrend line, RR at RM0.33-0.34.

Chart 1: ARBB's daily chart as at Feb 15, 2021 (Source: Malaysiastock.biz)

Chart 2: ARBB's weekly chart as at Feb 15, 2021 (Source: Malaysiastock.biz)

Conclusion

Based on good financial performance & position and attractive valuation, ARBB can be a good stock for medium-term investment. Its potential share price performance will depend on the ability of its share price to go above the immediate downtrend line at RM0.33-0.34. 

Note:

I hereby confirm that I do not have any direct interest in the security or securities mentioned in this post. However, I could have an indirect interest in the security or securities mentioned as some of my clients may have an interest in the acquisition or disposal of the aforementioned security or securities. As investor, you should fully research any security before making an investment decision.

Sunday, July 05, 2020

Technology Play: Which Sub-sectors or Stocks to Buy?

Last week, tech stocks have chalked up significant gain. If you wondering how to identify laggard tech stocks to add to your portfolio or watch list, this is one way you can consider.

Firstly, you need to identify which sub-sectors have shown out-performance. The Technology sector is divided into 4 sub-sectors: Digital Services, Semiconductors, Software and Technology Equipment. Below I have shown the steps to look at one of the sub-sectors, Digital Services. Then you choose "Price Change" and sort it by "Descending" order to filter out the out-performers.  


Diagram 1: How to pick out stocks in a sub-sector within the Technology sector

Below are the tables of out-performers for all the 4 sub-sectors of the Technology sector. You would notice that there are more gainers among the "Semiconductor" and "Technology Equipment" sub-sectors. This is not surprising as Malaysia is stronger in manufacturing than software or services.


Table 1: Top performers in the Digital Services sub-sector within the Technology sector


Table 2: Top performers in the Semiconductor sub-sector within the Technology sector


Table 3: Top performers in the Software sub-sector within the Technology sector


Table 4: Top performers in the Technology Equipment sub-sector within the Technology sector

After you have narrowed down the out-performing sub-sectors, you can choose the stocks to track or to buy. Assuming you want to buy the laggards; you should study their financial performance and the reason for their poorer financial performance. If you feel that the poorer financial performance may change, and the company's financial position is fairly sound, then you may position yourself in these laggards and wait for their turn to go higher.

You may try the same approach for Health Care sector. You will soon get the confirmation that this sector is pretty much all about glove stocks.

Diagram 2: How to pick out stocks in a sub-sector within the Health Care sector


Table 5: Top performers in the Health Care Equipment & Services sub-sector within the Healthcare sector

Look at the long list of out-performing glove stocks & related CWs above. The laggards among the glove stocks are not really laggards nor are they cheap. In my opinion, the whole glove stocks universe has gone up so much that you have to accept them not as value stocks, but as growth stocks which come with a high premium. The high premium can be justified if the earnings growth continues. If it stopped - or the market perceived that it may stop - the rollback can be very sharp.

That's what happened in late June when the market learned that glove prices have softened (here). Since then, the share prices rallied again, which could only mean that the report of the softening of glove prices was wrong or exaggerated. Anyway, that's the risk that you have to take if you get into glove stocks now.

The above are the steps that you can use to identify the out-performing sub-sectors in the Technology and Health Care sectors, and then you can pick up certain stocks to buy or track according to your investing or trading strategy. Good luck!

Thursday, January 16, 2020

INARI: A Bullish Sign!

One thing you may notice in the past 1-2 years is that share prices generally go lower when the stock is implementing a Right Issue. The reason is simple; no one wants to cough out money to subscribe for new shares.

On the same logic, an expiring warrant, especially company-issued warrants which must be converted to shares instead of cash-settled, would suffer the same fate. It can get so bad that these warrants would trade at a significant discount.

The last 1 month we have been seeing INARI-WB trading at a discount of less than 1%. This warrant has the following terms:
1. Exercise price: RM0.5333
2. Expiry date: Feb 17, 2020

For example, at the time of writing this post, INARI was trading at RM1.72 and INARI-WB was trading at RM1.17. If you were to buy the warrant and pay the exercise price of RM0.533 to own the share, you would save 1.67 sen or about 0.97%. No matter how difficult it is to make money in the stock market, a saving of less than 1% won't get many retail players excited. 

So, who is buying INARI-WB, and patiently & laboriously converting them to shares? The smart money, of course. In the stock market, if you choose to be on the side of the smart money, you will win more often than not. 

That's why INARI the share is worth watching. If it were to drift down to the line connecting its recent trough (or, low), it is worth owning some. Good luck!

Chart 1: INARI's daily chart as at Jan 16, 2020_3.30pm (Source: Malaysiastock.biz)


Chart 2: INARI-WB's daily chart as at Jan 16, 2020_3.30pm (Source: Malaysiastock.biz)

Wednesday, October 30, 2019

Gtronic: Earnings Dropped

Result Update

For QE30/9/2019, Gtronic's net profit rose 133% q-o-q but dropped 20% y-o-y to RM18.9 million while revenue rose 41% q-o-q but dropped 24% y-o-y to RM66 million. Net profit rose q-o-q due to higher revenue as a result of higher volume loadings and better economies of scale achieved from certain of the Group’s customers as well as better utilization of operational resources and facilities.


Table: Gtronic's last 8 quarterly results


Graph: Gtronic's last 51 quarterly results

Financial Position

Gtronic's financial position is still very healthy with current ratio at 4.4 times and gearing ratio at 0.16 time.

Valuation 

Gtronic (closed at RM2.20 yesterday) is now trading at a PE of 28 times (based on last 4 quarters' EPS of 7.80 sen). At this elevated PER, Gtronic is deemed overvalued.

Technical Outlook

Gtronic broke above its downtrend line at RM1.75 in September. The share price should find support at the 10-week moving average line at around RM2.00.


Chart 1: Gtronic's weekly chart as at Oct 29, 2019 (Source: Malaysiastock.biz)

Gtronic monthly MACD is poised to cross above its signal line. When that happens, the uptrend will pick up pace.


Chart 2: Gtronic's monthly chart as at Oct 29, 2019 (Source: Malaysiastock.biz)

Conclusion

Despite weaker financial performance and demanding valuation, I am keeping my rating for Gtronic to a HOLD. 

Note:

I hereby confirm that I do not have any direct interest in the security or securities mentioned in this post. However, I could have an indirect interest in the security or securities mentioned as some of my clients may have an interest in the acquisition or disposal of the aforementioned security or securities. As investor, you should fully research any security before making an investment decision.

Monday, October 28, 2019

UNISEM: Earnings Plummeted Again

Results Update

For QE30/9/2019, Unisem's pre-tax profit dropped 50% q-o-q or 75% y-o-y to RM10 million  while revenue was mix- rose 1.4% q-o-q but dropped 10.8% y-o-y to RM316 million. The lower pre-tax profit was primarily attributable to net expenses incurred on severance against reversal of retirement benefits in PT Unisem.

Unisem reported a loss after tax due to higher effective tax rate arising from the reversal of retirement benefits in PT Unisem amounting to RM6.53 million as well as the losses of a subsidiary company which cannot be used to offset against profits of other companies in the Group.


Table: Unisem's last 8 quarterly results


Graph: Unisem's last 60 quarterly results

Financial Position

As at 30/9/2019, Unisem's financial position is deemed satisfactory with current ratio at 2.6 times while gearing ratio at 0.3 time.

Valuation

Unisem (closed at RM2.56 yesterday) is now trading at a PE of 45 times (based on last 4 quarters' EPS of 5.61 sen). At this PER, Unisem is deemed overvalued.

Technical Outlook

Recently, Unisem rebounded to test its downtrend line at RM2.60. While it went above the downtrend line, the breakout could have sustained.


Chart: Unisem's monthly chart as at Oct 25, 2019 (Source: Malaysiastock.biz)

Conclusion

Based on weaker financial performance and bearish technical outlook, I rate Unisem as a SELL.

Note:

I hereby confirm that I do not have any direct interest in the security or securities mentioned in this post. However, I could have an indirect interest in the security or securities mentioned as some of my clients may have an interest in the acquisition or disposal of the aforementioned security or securities. As investor, you should fully research any security before making an investment decision.

Friday, October 25, 2019

Vitrox: Earnings Continued to Slide

 Result Update

For QE30/9/2019, Vitrox's net profit dropped by 43% q-o-q or 51% y-o-y to RM14 million while revenue dropped by 25% q-o-q or 35% y-o-y to RM67 million. Revenue dropped y-o-y mainly because of decline in customer demand by 39% and 24% from Automated Board Inspection (ABI) and Machine Vision System (MVS) respectively. The profit before tax declined by 52% due to decline in sales volume coupled with product mix apart from continuous investment in R&D activities.


Table: Vitrox's last 8 quarterly results


Graph: Vitrox's last 42 quarterly results

Valuation

Vitrox (closed at RM8.07 yesterday) is now trading at a PE of 42 times (based on last 4 quarters' EPS of 19.40 sen). At this PER, Vitrox is deemed fully valued.

Technical Outlook

Vitrox is still in an uptrend line with support at RM7.00-7.10. Its immediate support is at the horizontal line at RM7.30.

 
Chart: Vitrox's weekly chart as at Oct 24, 2019 (Source: Malaysiastock.biz)

Conclusion

Based on weaker financial performance and demanding valuation, I think it is advisable to take profit on Vitrox after a strong run-up since August 2017 (here).

Note:

I hereby confirm that I do not have any direct interest in the security or securities mentioned in this post. However, I could have an indirect interest in the security or securities mentioned as some of my clients may have an interest in the acquisition or disposal of the aforementioned security or securities. As investor, you should fully research any security before making an investment decision.


Sunday, May 26, 2019

MPI: Earnings plummeted

Result Update

For QE31/3/2019, MPI's net profit dropped 57% q-o-q or 35% y-o-y to RM17 million while revenue dropped 17% q-o-q or 10% y-o-y to RM330 million. PBT dropped 58% q-o-q due to lower overall revenue which dropped across the board as follows: 11% in Europe segment, 19% in Asia segment and 22% in the America segment.


Table: MPI's last 8 quarterly results


Graph: MPI's last 44 quarterly results 

Financial Position

As at 31/3/2019, MPI's financial position is deemed healthy with current ratio at 4.2 times and gearing ratio at only 0.2 time.

Valuation

MPI (closed at RM8.80 last Friday) is now trading at a trailing PER of 12 times (based on last 4 quarters' EPS of 72 sen). At this PER, MPI is deemed fairly valued.

Technical Outlook

MPI is in a long-term uptrend line, SS at RM8.80. If this uptrend line is broken, MPI's next support will be at the horizontal line at RM8.30.


Chart: MPI's weekly chart as at May 24, 2019 (Source: Malaysiastock.biz)  

Conclusion

Despite the weaker financial performance, I would rate MPI as a HOLD based on healthy financial position, fairly attractive valuation & still positive technical outlook. However, if the share price were to breach the uptrend line, my rating will be revised from HOLD to REDUCE.

Note:

I hereby confirm that I do not have any direct interest in the security or securities mentioned in this post. However, I could have an indirect interest in the security or securities mentioned as some of my clients may have an interest in the acquisition or disposal of the aforementioned security or securities. As investor, you should fully research any security before making an investment decision.

Sunday, May 19, 2019

N2N: Earnings Rebounded on Lower Provision for Trade Debts

Result Update

In QE313/2019, N2N's net profit rose 99% q-o-q but dropped 16% y-o-y to RM5.6 million while its revenue dropped 2% q-o-q but rose 6% y-o-y to RM27 million. The Group’s revenue dropped marginally q-o-q due to a one-time implementation fees recorded in the previous quarter. Compared to the immediate preceding quarter, the Group’s core profits improved by 53.72% to RM4.45 million (Q4 2018: RM2.89 million) mainly due to lower provisions for trade receivables and other non-recurring administration costs.


Table: N2N's last 8 quarters' P&L


Graph: N2N's last 22 quarters' P&L

Latest Financial Position

As at 31/3/20198, N2N's financial position is very healthy, with current ratio of 6.4x and gearing ratio of 0.19x.

Valuation

N2N (closed at RM0.745 last Friday) is now trading at a PER of 34x (based on annualized core EPS 2.18 sen). At this PER, N2N is deemed fully valued.

Technical Outlook

N2N is in a long-term uptrend line (SS) with support of RM0.73 (previously stated at RM0.80).


Chart: N2N's weekly chart as at May 17, 2019 (Source: Malaysiastock.biz)

Conclusion

Based on satisfactory, albeit weaker, financial performance, healthy financial position and positive technical outlook, N2N could be a good stock for long-term investment. It may benefit from a pick-up in equities trading in the region this year.

Note:
I hereby confirm that I do not have any direct interest in the security or securities mentioned in this post. However, I could have an indirect interest in the security or securities mentioned as some of my clients may have an interest in the acquisition or disposal of the aforementioned security or securities. As investor, you should fully research any security before making an investment decision.

Thursday, May 16, 2019

Penta: Earnings Continued to Grow

Results Update

For QE31/3/2019, Penta's PBT increased by 4% q-o-q or 171% y-o-y to RM19.6 million while revenue rose 6% q-o-q or 20% y-o-y to RM119 million. Group revenue rose q-o-q due to increase in sales from automated equipment operating segment. Group profit before taxation rose by 9% q-o-q which was in tandem with the increase in revenue.


Table: Penta's last 8 quarterly results

 
Graph: Penta's last 25 quarterly results 

Financial Position

Penta's financial position is satisfactory, with current ratio at 3.6 times and gearing ratio at 0.3 time. In addition, it is noted that Penta has a net cash balance of RM373 million or RM1.18 per share!!

Valuation

Penta (closed at RM4.20 yesterday) is now trading at a PER of 19 times (based on last 4 quarters' EPS of 21.9 sen). Based on an earning CAGR of 42% over the past 3 years, PENTA's PEG ratio is at 0.5 time. At this PEG ratio, Penta is deemed a very attractive growth stock.

Technical Outlook

Penta is rising in a long term uptrend (in blue). However the current rally may be hitting the resistance from the line connecting its recent peaks (in red). Unless there is a breakout above the red line (at RM4.50), Penta's upside will be limited.


Chart: Penta's weekly chart as at May 15, 2019 (Source: Malaysiastock.biz)

Conclusion

Based on good financial performance & financial position and attractive valuation, Penta is a good stock for long term investment.

Note: 

I hereby confirm that I do not have any direct interest in the security or securities mentioned in this post. However, I could have an indirect interest in the security or securities mentioned as some of my clients may have an interest in the acquisition or disposal of the aforementioned security or securities. As investor, you should fully research any security before making an investment decision.

Wednesday, May 01, 2019

Gtronic: Top-line and bottom-line plummeted

Result Update

For QE31/3/2019, Gtronic's net profit plummeted 86% q-o-q or 80% y-o-y to RM3.1 million due to sharp drop in revenue of 46% q-o-q or 49% y-o-y to RM44 million. The big drop in revenue and profits was due to the continuing global slowdown affecting the industry which caused volume loadings to drop drastically. In addition, there were unexpected measures taken by certain customers to stop shipments towards the end of March 2019 due to their desire to deplete their inventories in the supply chain.


Table: Gtronic's last 8 quarterly results


Graph: Gtronic's last 53 quarterly results

Financial Position

Despite the weaker performance, Gtronic's financial position is still very healthy with current ratio at 3.8 times and gearing ratio at 0.17 time.

Valuation 

Gtronic (closed at RM1.90 yesterday) is now trading at a PE of 22 times (based on last 4 quarters' EPS of 8.69 sen). At this elevated PER, Gtronic is deemed overvalued.

Technical Outlook

Gtronic has risen off its low at RM1.39 recorded in January this year. The share price rallied twice but failed to test the 200-day SMA line. With the poor result, Gtronic is likely to fall back to test its medium-term uptrend line with support at RM1.77.


Chart 1: Gtronic's daily chart as at Apr 30, 2019 (Source: Malaysiastock.biz)


Chart 2: Gtronic's weekly chart as at Apr 30, 2019 (Source: Malaysiastock.biz)

Conclusion

Based on poor financial performance and demanding valuation, I revise my rating for Gtronic to a HOLD. 

Note:

I hereby confirm that I do not have any direct interest in the security or securities mentioned in this post. However, I could have an indirect interest in the security or securities mentioned as some of my clients may have an interest in the acquisition or disposal of the aforementioned security or securities. As investor, you should fully research any security before making an investment decision.

Monday, April 08, 2019

N2N: A Potential Fintech Play

Result Update

In QE31/12/2018, N2N's net profit rose 27% q-o-q but dropped 47% y-o-y to RM2.8 million while its revenue rose 10% q-o-q or 0.5% y-o-y to RM27.8 million. N2N's net profit y-o-y dropped mainly due to lower unrealised forex gain in the current quarter. However, the core profit of the Group increased by 46.6% from RM1.99 million to RM2.91 million mainly due to the combination of lower operating cost and improved margins.

N2N's profit after tax rose q-o-q but the core profit of the Group declined 4.8% from RM2.91 million to RM3.06 million mainly due to provisions for trade receivables. The q-o-q increase in profits was mainly attributed to the higher revenue and better margins for the current quarter in comparison to the preceding quarter. Revenue increased by 10.2% from RM25.24 million in the preceding quarter to RM27.80 million in the current quarter. [Note: The result for QE31/12/2018 was announced on 25 February.]


Table: N2N's last 8 quarters' P&L


Graph: N2N's last 49 quarters' P&L

Latest Financial Position

As at 31/12/2018, N2N's financial position is satisfactory, with current ratio of 5.2x and gearing ratio of 0.23x.

Corporate Development

In December last year, Japanese online broker SBI Japannext Co Ltd has acquired a strategic investment stake in N2N from its founder and managing director Andrew Tiang Boon Hwa in a deal worth RM91.4 million. SBI Japannext Co. Ltd purchased 65.276 million N2N shares at RM1.40 each from N2N's MD. This strategic investment is expected to lead to collaboration between Japannext and N2N, which will open up new opportunities for both entities through the promotion of more trading activities in the region, while encouraging greater uptake of cross border trading. For more, go here.

Valuation

N2N (closed at RM0.815 last Friday) is now trading at a PER of 32x (based on last 4 quarterly EPS of 2.53 sen). At this PER, N2N is deemed fully valued.

Technical Outlook

N2N is in a long-term uptrend line (SS) with support of RM0.80.


Chart: N2N's weekly chart as at Apr 5, 2019 (Source: Malaysiastock.biz)

Conclusion

Based on satisfactory, albeit weaker, financial performance, healthy financial position and positive technical outlook, N2N could be a good stock for long-term investment. It may benefit from a pick-up in equities trading in the region this year.

Note:
I hereby confirm that I do not have any direct interest in the security or securities mentioned in this post. However, I could have an indirect interest in the security or securities mentioned as some of my clients may have an interest in the acquisition or disposal of the aforementioned security or securities. As investor, you should fully research any security before making an investment decision.

Monday, January 07, 2019

Inari: Knocked Down by News of Lower iPhone Sales in China

Background

Inari Amerton Bhd ("Inari") is involved in the outsourced semiconductor assembly and test services and electronics manufacturing services. It is well-known as one of the suppliers to Apple for the manufacture of its iPhones. 

Recent Business News

Apple recently revealed that it anticipates revenue to come in below expectations. Apple expects revenue of $84 billion in the first quarter - a 5%-decline from the low-end of its previously stated range of $89 billion to $93 billion (here). This will impact Inari as Apple is its major customer.

Recent Financial Performance

Its latest result was for QE30/9/2018, which was released in November 26, 2018. For that quarter, Inari's net profit rose 5.3% q-o-q but dropped 12.0% y-o-y to RM60.2 million while revenue was mixed- up 8.2% q-o-q but down 12.7% y-o-y to RM326 million. Its revenue dropped y-o-y due to lower volume loading. PBT dropped 11.9% y-o-y mainly due to the foreign  exchange fluctuation during the current quarter.


Table: Inari's last 8 quarterly results


Graph: Inari's last 32 quarterly results

Financial Position

As at 30/9/2018, Inari's financial position is deemed very healthy with good current ratio at 3.4x while gearing ratio improved to 0.3x.

Valuation

Inari (closed at RM1.23 last Friday) is now trading at a PER of 16 times (based on last 4 quarters' EPS of 7.7 sen). At this PER, Inari is deemed fairly attractive.

Technical Outlook

Inari has broken below its long-term uptrend line, SS at RM1.50 last week. Its immediate support will be at horizontal line at RM1.10 and then the psychological level of RM1.00.


Chart: Inari's weekly chart as at Jan 4, 2019 (Source: Malaysiastock.biz)

Conclusion

Based on good, albeit weaker financial performance, good financial position and fairly attractive valuation, Inari is a good stock to consider for long-term investment. However its current bearish technical outlook may lead to further price weakness until its near-term financial performance shows clarity after the reported lower sales by Apple.

Note:

I hereby confirm that I do not have any direct interest in the security or securities mentioned in this post. However, I could have an indirect interest in the security or securities mentioned as some of my clients may have an interest in the acquisition or disposal of the aforementioned security or securities. As investor, you should fully research any security before making an investment decision.

Monday, November 19, 2018

Elsoft: Earnings Continued to Grow

Background

Elsoft Research Berhad ('Elsoft') is involved in the research, design and development of test and burn-in systems and application-specific embedded systems. It provides products for semiconductor, opto-electronic (such as image sensors) and automation industries (such as lighting).

Historical Financial Performance

Elsoft's top-line and bottom-line grew at a rapid pace in the past 6 years.


Graph 1: Elsoft's last 14 years' P&L

Recent Financial Performance

In QE30/9/2018, Elsoft's net profit rose by 13.6% q-o-q or 61.7% y-o-y to RM13.6 million while revenue rose 1.3% q-o-q or 47.1% y-o-y to RM24.5 million. Revenue rose q-o-q mainly due to greater demand from smart devices industry and continuous demand from automotive and general lighting industry. The increase in revenue led to increase in profits.


Table: Elsoft's last 8 quarters' P&L


Graph 2: Elsoft's last 24 quarters' P&L

Financial Position

Elsoft's financial position as at 30/9/2018 is deemed very healthy with current ratio at 4.6 times and gearing ratio at 0.2 time.

Valuation

Elsoft (closed at RM1.42 last Friday) is now trading at a PER of 17 times (based on last 4 quarters' EPS of 8.25 sen). Based on last 5 years' earnings CAGR of 30%, Elsoft's PEG ratio stood at only 0.6 time. At this PEG ratio, Elsoft is deemed fairly attractive for a growth stock.

Technical Outlook

Elsoft is in a gradual uptrend in the past 5 years- reflective of its steady earning growth.


Chart: Elsoft's weekly chart as at Nov 16, 2018 (Source: Malaysiastock.biz)

Conclusion

Based on good financial performance and position, attractive valuation and bullish technical outlook, Elsift is a god stock for long-term investment.

Note: 

I hereby confirm that I do not have any direct interest in the security or securities mentioned in this post. However, I could have an indirect interest in the security or securities mentioned as some of my clients may have an interest in the acquisition or disposal of the aforementioned security or securities. As investor, you should fully research any security before making an investment decision.

Friday, November 02, 2018

Penta: Earnings Remained Strong

Results Update

For QE30/9/2018, Penta's PBT increased by 23% q-o-q or 120% y-o-y to RM17 million while revenue rose 6% q-o-q or 30% y-o-y to RM108 million. Revenue rose q-o-q  due to increase in sales from automated manufacturing solution operating segment. The Group recorded a higher profit before taxation of RM29 million in the current quarter as compared to the profit before taxation of RM24 million in the preceding quarter, representing an increase of 18.4% which was in tandem with the increase in revenue.


Table: Penta's last 8 quarterly results

 
Graph: Penta's last 23 quarterly results 

Financial Position

Penta's financial position is satisfactory, with current ratio at 2.9 times and gearing ratio at 0.4 time.

Valuation

Penta (closed at RM3.25 yesterday) is now trading at a PER of 21 times (based on last 4 quarters' EPS of 15.35 sen). Based on an earning CAGR of 60% over the past 3 years, PENTA's PEG ratio is at 0.4 time. At this PEG ratio, Penta is deemed an attractive growth stock.

Technical Outlook

Last 4 weeks, Penta dropped below its uptrend line, SS at RM2.95 momentarily before recovering back up above RM3.00. Due to the sharp decline over the past 4 weeks, the stock's MACD has gone below the zero line, indicating possible downtrend. Since it has reclaimed its uptrend line, a bearish call is delayed.

Chart 1: Penta's daily chart as at Nov 1, 2018 (Source: Malaysiastock.biz)


Chart 2: Penta's weekly chart as at Nov 1, 2018 (Source: Malaysiastock.biz)

Conclusion

Based on good financial performance & financial position and attractive valuation, Penta is a good stock for long term investment. The mild weakness in its technical outlook will likely be worked out in the next few weeks, and thereafter the stock may continue with its prior uptrend.

Note: 

I hereby confirm that I do not have any direct interest in the security or securities mentioned in this post. However, I could have an indirect interest in the security or securities mentioned as some of my clients may have an interest in the acquisition or disposal of the aforementioned security or securities. As investor, you should fully research any security before making an investment decision.