Tuesday, October 31, 2006

Suiwah has a very poor QE31/8/06

Latest Financial Results

Suiwah has reported its results for QE31/8/06 yesterday. Its net profit plummeted by 94.6% y-o-y or 92.5% q-o-q to RM281k. Turnover of RM85.0 mil represents a 14.3%-decline when compared to the previous corresponding quarter’s turnover but 2.9% higher than the turnover of the preceding quarter. Suiwah attributed its poor result to intense competition in the Flexible Printed Circuit ("FPC") boards sector, one of the group’s two main core business. The other core business is retailing. See the table below.


Technical Outlook

Suiwah is barely holding onto its long-term uptrend line at RM1.90 (see the monthly chart, Chart 1 below). From the weekly chart (Chart 2), we can see that Suiwah has momentarily made a low of RM1.83 in w/e Oct 13, which is lower than the low of RM1.88 made in December last year.


Chart 1: Suiwah's monthly chart as at Oct 30


Chart 2: Suiwah's weekly chart as at Oct 30

Conclusion

With the sharp deterioration in the financial performance, Suiwah may not be able to hold onto its current support of RM1.90 (or, marginally below that). A convincing break would see a sharp selloff in Suiwah. It maybe prudent to dispose of Suiwah at this stage & wait for the dust to settle.

Monday, October 30, 2006

Covered Warrant Update as at October 27

I have posted here an updated Table of Covered Warrants for your reference. After careful study, I've noticed that I've made 2 errors with regards to the computation of the gearing multiple & intrinsic value of the warrants.

For gearing multiple, I have previously used a formula of share price divided by warrant price. It has been revised to share price divided by the product of the multiplication of warrant price & warrant's conversion ratio. Intrinsic value, which was previously calculated based on the formula of share price less warrant's exercise price, has been revised to share price less the product of the multiplication of warrant price & warrant's conversion ratio. In addition, the premium of the warrant has now been presented in a slightly different format.

Those warrants with low premium has been highlighted in yellow and, amongst them, those with high gearing, their gearing multiples are highlighted in green. Two warrants i.e. Astro-CA & Scomi-CA have less than 3 months to expiry. Their expiry dates are highlighted in pink.


For those who are interested to learn more about covered warrants (or, call warrants), you may check out this link (here).

Friday, October 27, 2006

Market Outlook for W/E October 27, 2006

The CI has gained 7.27 points to close at 989.90 today (October 27). The volume traded is very big at 906.5 million units, with gainers out-numbering losers by 579 to 229. See Chart 1 below.


Chart 1: CI's daily chart as at Oct 26

With this strong move, the scenario as described in my earlier post may still happen.

In addition, I wish to point out that the Second Board has also broken above its medium-term downtrend line at the 83.8 level. Its upside move in the coming days will see it testing the immediate horizontal resistance at 87.7 level. On weakness, the Second Board may drift back to find support at its short-term tentative uptrend line at 83.4 level. See Chart 2 below.


Chart 2: Second Board's daily chart as at Oct 26

It must be pointed out that the Second Board's upside move may be checked in the weeks ahead by its long-term downtrend line (as well as strong horizontal resistance) at 91-94 level. It must surpass this level in order to have a sustained rally ahead. See Chart 3 below.


Chart 3: Second Board's weekly chart as at Oct 26

In conclusion, I expect a very exciting trading time ahead as the CI, Second Board & Mesdaq Board (see earlier post on the latter) are likely to maintain their respective upside momentum.

Choo Bee is an attractive long-term investment

Background

Choo Bee is principally involved in the manufacturing of flat based steel products and trading in a comprehensive range of flat and long based steel products such as structural steel and building materials. Examples of products manufactured by the Group include a wide range of steel pipes, flat bars, sheets and plates, purlins, lipped channel, hollow sections, decorative and string pipes. In addition, the Group also manufactures flat based stainless steel products and provides steel servicing, a pre-production service to customers with products that have steel as a component such as shearing of sheets and slitting of coils.

Recent Financial Performance

After a short period of poor performance in second half of 2005 (i.e. QE30/9/05 & QE31/12/05), Choo Bee’s financial performance rebounded in the last 2 quarters. The latest quarterly result for QE30/6/06 shows a substantially higher net profit of RM8.7 mil, which represents an increase of 34.1% q-o-q or 37.5% y-o-y. Turnover of RM88.3 mil has only increased marginally over the preceding quarter’s turnover of RM87.5 mil but representing a 16.3% growth over the previous corresponding quarter’s turnover.


Valuation

Based on the last 2 quarterly EPS totaling 14.52 sen, we can compute the full-year EPS to be about 29.04 sen. At a closing price of RM1.70 as at Oct 26, Choo Bee is trading at a PE of 5.9 times only.

Technical Outlook

From the chart below, we can see that Choo Bee has broken above its downtrend line in March. It is consolidating in an ascending triangle with the resistance at RM1.74 level. A break above that level could be the beginning of a bullish upside move for Choo Bee. If on weakness, the stock were to drift down, we can expect support at RM1.50 level. The latter could be a good level to gain entry into Choo Bee.


Chart: Choo Bee's weekly chart as at Oct 26

Conclusion

Based on attractive valuation & fairly interesting technical set-up, Choo Bee is a good investment for both medium- & long-term.

Covered Warrant Update as at October 27

I have posted here an updated Table of Covered Warrants for your reference. After careful study, I've noticed that I've made 2 errors with regards to the computation of the gearing multiple & intrinsic value of the warrants.

For gearing multiple, I have previously used a formula of share price divided by warrant price. It has been revised to share price divided by the product of the multiplication of warrant price & warrant's conversion ratio. Intrinsic value, which was previuosly calculated based on the formula of share price less warrant's exercise price, has been revised to share price less the product of the multiplication of warrant price & warrant's conversion ratio. In addition, the premium of the warrant has now been presented in a slightly different format.

Those warrants with low premium has been highlighted in yellow and amongst them that have high gearing, their gearing multiples are highlighted in green. Two warrants i.e. Astro-CA & Scomi-CA have less than 3 months to expiry. Their expiry dates are highlighted in pink.


For those who are interested to learn more about covered warrants (or, call warrants), you may check out this link (here).

Nextnation may benefit from interactive mobile games

Background

Nextnation Communication Bhd (“Nextnat”) is principally involved in the development & provision of engine/solution for mobile gaming as well as the provision of Internet and wireless technologies & related value-added services. The group has developed a full service mobile game engine for interactive mobile game development, hosting & worldwide deployment, which enables it to strengthen its foothold in this fast-growing field.

Business Expansion

To leverage on its successful development of its full service mobile game engine, the group has entered into a few ventures overseas, such as India (via a distribution agreement with Mobile2win), Indonesia (via acquisition of PT Flower and PT Semesta) and China (via investment in Often Reach Investments Limited).

Nextnation’s wholly-owned subsidiary, Ozura Sdn. Bhd. ("Ozura”) has recently been chosen as Excite Japan Co. Ltd's ("Excite Japan") first international mobile game distribution partner. Excite Japan, one of Japan's largest web portals and mobile game providers, is granting Ozura the distribution rights for its premium mobile game titles. Ozura plans to make these games available through its extensive network of distribution channels consisting of major mobile operators and distribution partners in Malaysia, Thailand, Singapore, Indonesia, Philippines, Australia, China, India and the United Kingdom.

Recent Corporate Exercise

Nextnat has just completed a private placement of 25.2 million shares at RM0.56 each. It has also proposed to carry out a Bonus Issue of 1:2 after the completion of the private placement.

Recent Financial Results

Nextnat’s latest result fro QE31/7/06 shows good improvement in its topline & bottomline. Net profit increased by 7.8% q-o-q or 27.2% y-o-y to RM4.8 mil while turnover increased by 31.9% q-o-q or 53.9% y-o-y to RM23.5 mil. Nextnat attributed its better performance to expanded customer base & hence higher demand for its products & services. See the table below.


Valuation

Based on the last 4 quarterly EPS which amounted to 7.1 sen and the share price of RM0.645 as at October 26, the stock is now trading at a PE of 9.1 times. Given the exciting prospect of the group, I think the stock’s current PE multiple of 9.1 times is not high.

Technical Outlook

The stock is currently in a short-term uptrend line, with support at RM0.60. Overhead resistance is at RM0.65. A break above the RM0.65 level could signal the continuation of the stock’s uptrend, possibly at a faster pace. See the chart below.


Chart: Nextnat's daily chart as at Oct 20

Conclusion

Based on the exciting prospect, undemanding valuation & fairly nice technical set-up, I believe Nextnat is an attractive investment for the medium- to long-term investors.

JTiasa has pulled back to its breakout level

On October 12, I've posted a piece on JTiasa, which has just broken above its strong horizontal resistance of RM2.82/85 level. The rally that accompanied the breakout was very fast & the stock hit a high of RM3.26 on the following day. The share price has since given back some of its gain. It has been trading around the RM2.90 level for the past few days & this maybe a good level to establish a position in one of the big boys in the timber sector, which is enjoying from strong rotational play.


Chart: JTiasa's weekly chart as at Oct 26

Thursday, October 26, 2006

Scientex Inc- an attractive stock awaiting breakout

Background

Scientex Inc Bhd ("Scientex") is involved in the manufacture of pvc & pu leather sheeting; trading in bldg materials & textile products as well as invest holdings. One of its main subsidiaries is Scientex Packaging (a 61.37%-owned subsidiary), which is involved in the manufacture of stretch film; pp & pe woven bags & fabrics bags; flexible intermediate bulk containers as well as corrugated carton boxes.

Recent Financial Results

Scientex’s results for QE31/7/06 shows improvement in both topline & bottomline. Net profit increased 29.2% q-o-q or 20.0% y-o-y to RM8.6 mil on the back of a turnover of RM154.5 mil, which represents an increase of 10.7% q-o-q or 16.3% y-o-y.

Turnover for the latest 4 quarters amount to RM586 mil, an increase of 15.5% over the preceding 4 quarter’s turnover of RM508 mil. At the same time, net profit has increased by 24.0% from RM23.1 mil to RM28.7 mil while EPS increased by 22.7% from 37.3 sen to 45.8 sen. See the table below.


Valuation

Based on the last 4 quarters' EPS of 45.8 sen & the sahre price of RM2.82 as at Oct 20, the share is trading at a PE of 6.2 times.

In addition, Scientex's gross dividend has increased from 17 sen to 31 sen. Based on the a gross dividend of 31 sen, Scientex's dividend yield is about 11.0%.

Technical Outlook

The share price of Scientex has been consolidating for the past 18 or 19 months (since April 2005), with the upside resistance at RM3.00. The last long drawn-out consolidation was also about 18 or 19 months (from July 2003 to February 2005) before the share price broke above its then resistance of RM2.20/21 levels and went to a high of RM3.10. See the chart below.


Chart: Scientex's weekly chart as at Oct 20


Conclusion

Based on attractive valuation, Scientex is a good long-term investment. For short-term traders, you may want to wait until the share has surpassed the RM3.00 level.

Thursday, October 19, 2006

BJToto has broken below its ST uptrend line

On October 6, I've highlighted that BJToto is about to test its short-term uptrend line at RM4.48 level (here). The stock did stage a re-bounce after testing the uptrend line and it went as high as RM4.64 on October 12. Since then, the rally could not sustain & the stock slid & broke through its short-term uptrend line yesterday (to close at RM4.48). Today, the selling continued & the stock lost 2 sen on a volume of 2.44 million units. BJToto needs to stage a recovery to stay above its short-term uptrend line within the next day or two, failing which the short-term uptrend line will be considered as broken. See Chart 1 below.


Chart 1: BJToto's daily chart as at Oct 18


Chart 2: BJToto's weekly chart as at Oct 18

From Chart 2, we can see that BJToto's medium-term uptrend line is still in tact as this uptrend line support is at RM4.18 (& rising).

Notwithstanding the above technical commentary, I would like to highlight my post dated October 17, where I've made my arguments that Magnum may outperform BJToto going forward. You may like to look at that piece & see whether you agree with my suggestion & arguments.

Ekowood may benefit from the current timber play

Background

Ekowood is involved in the supply & installation of engineered solid hardwood flooring and sub-licensing of strip lock system.

Recent Financial Performance

Ekowood reported a net profit of RM3.9 mil for QE30/6/06, which represents an increase of 16.0% from the net profit of the corresponding quarter last year (of RM3.3 mil) but a decline of 15.5% from the immediate preceding quarter’s net profit (of RM4.6 mil). The latter is attributable to lower current tax in the preceding quarter as RM0.41 mil of the current tax was transferred to deferred tax while for the latest quarter, an amount of RM0.23 mil was transferred from deferred tax to current tax (thus reducing the net profit for QE30/6/06).

Stripping off the tax effect, Ekowood’s performance has improved as seen in its higher pre-tax profit, which has increased 11.2% q-o-q or 71.0% y-o-y to RM5.5 mil. This was achieved on a turnover, which has increased by 0.7% q-o-q or 8.0% y-o-y to RM37.7 mil.

If we compared the latest 4 quarters with the preceding 4 quarters, we can see that net profit has dropped by 30.1% from RM19.4 mil to RM13.6 mil, despite a marginal 5.3% increase in turnover to RM139.7 mil from RM132.6 mil. See the table below.


Valuation

Based on the last 4 quarters’ combined EPS of 8.1 sen and yesterday’s closing price of RM0.90, Ekowood is now trading at a PE of 11.1 times.

Technical Outlook

From the weekly chart (Chart 1), we can see that Ekowood has just broken above its downtrend line at RM0.80.


Chart 1: Ekowood's weekly chart as at Oct 18


Chart 2: Ekowood's daily chart as at Oct 16

From the daily chart (Chart 2), it is clear that Ekowood's big move yesterday has broken above the resistance area between RM0.81-0.86. If weakness surfaced in the next few days, the share price may retrace back to this resistance-turned-support area. This then can present a good entry level for the stock.

Risk

This is a fairly quiet stock with low trading volume. A big position in this stock may pose difficulty in the event of an exit.

Conclusion

Fundamentally, Ekowood is a profitable company but the PE is not low at 11.1 times. Its main attraction is that it has just broken above its downtrend line and it has the potential of turning bullish in light of the current timber theme play.

Tuesday, October 17, 2006

Magnum- Would it outperform BJToto?

Background

In the past 3 years, investors have been dazzled by BJToto as much as they have been puzzled by Magnum. In two important areas, BJToto has outperformed its rival, Magnum and they are:

1. Past Financial performance

BJToto's net profit has grown from RM284 mil in FYE30/4/2001 to RM465 mil in FYE30/4/2006, on the back of a turnover that has grown from RM2.333 billion to RM2.938 billion. Magnum has grown at a slower rate from RM261 mil in FYE31/12/2000 to RM336 mil in FYE31/12/2005, on the back of a stagnant turnover of RM2.7 billion. As a result thereof, BJToto's EPS has increased from 21.0 sen to 34.4 sen while Magnum's EPS has increased from 8.7 sen to 13.6 sen. See the 2 tables below.


Table 1: BJToto's past 6 years' financial performance


Table 2: Magnum's past 6 years' financial performance

2. Dividend payout plus capital repayment

From June 2003 until today, BJToto's dividend payout totaled RM1.57 per share as compared to RM0.42 per share for Magnum. That means BJToto's dividend payout is 274% higher than Magnum's dividend payout. In addition, BJToto has also carried out 2 capital repayments of RM0.50 each in Sep 2005 & Jun 2006. See Chart 1 & 2 below.

On the other hand, Magnum has spent RM285 mil to buy back 133,051,800 units of its own share from 24/7/2001 to 2/5/2006. On 19/6/2006, the entire Treasury shares outstanding of 133,051,800, which represented 8.43% of Magnum’s issued shares, were cancelled. This has the impact of boosting Magnum’s EPS by 9.2%. Thereafter, Magnum has continued with its share buyback & as at 16/10/2006, the Treasury shares in hand totaled 17,913,400 units.


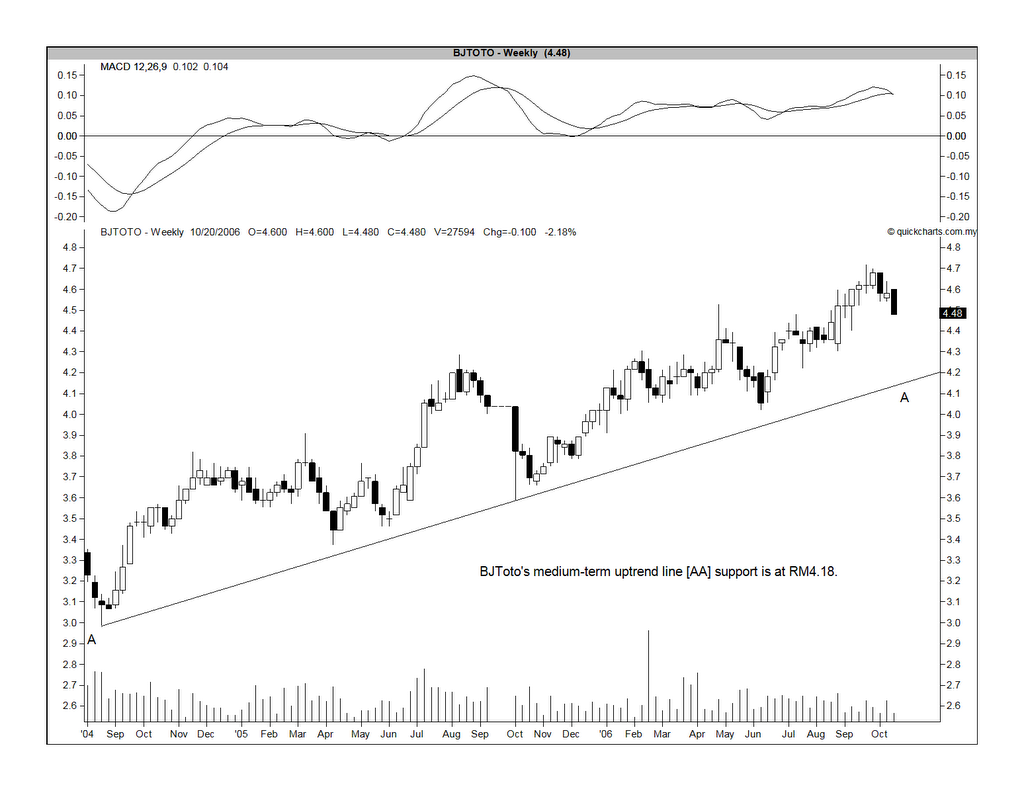
Chart 1: BJToto's weekly chart as at Sep 22, 2006 [with gross dividend (in sen) stated near the bottom of the chart]


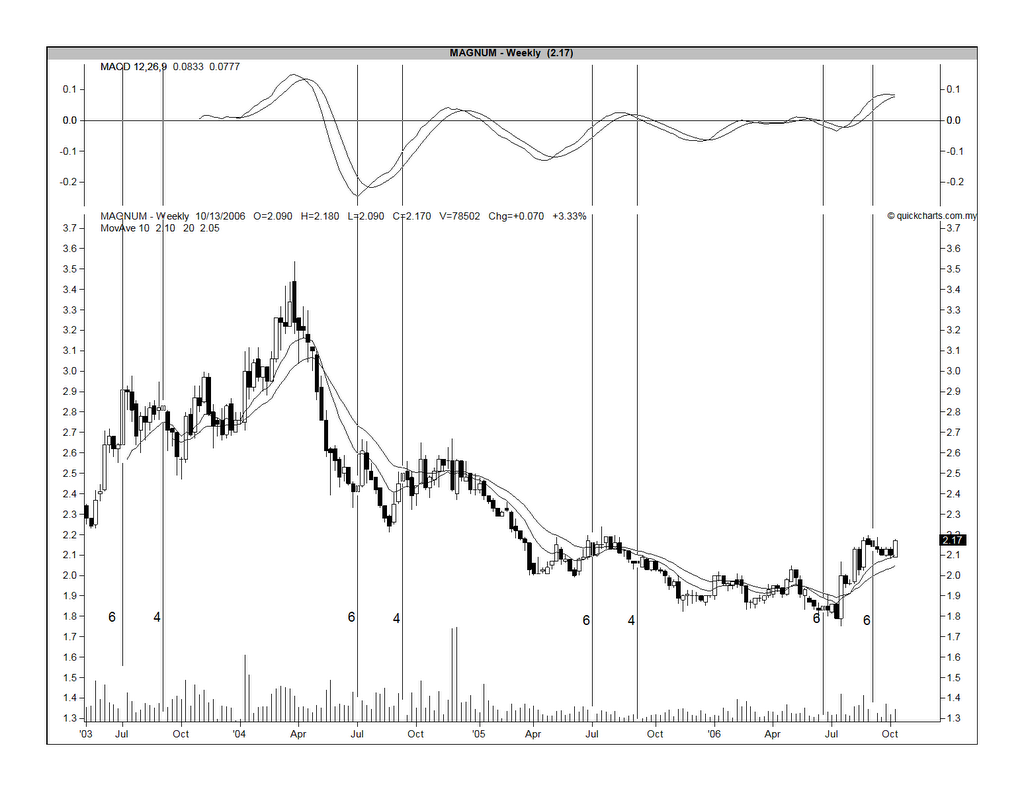
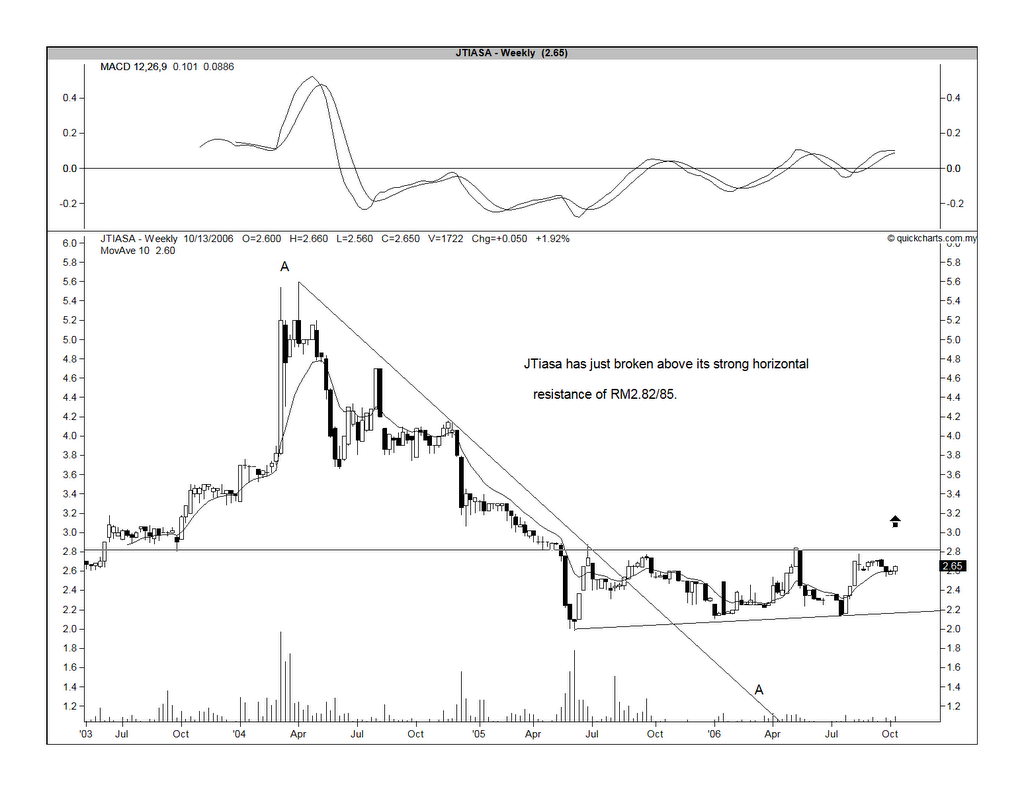
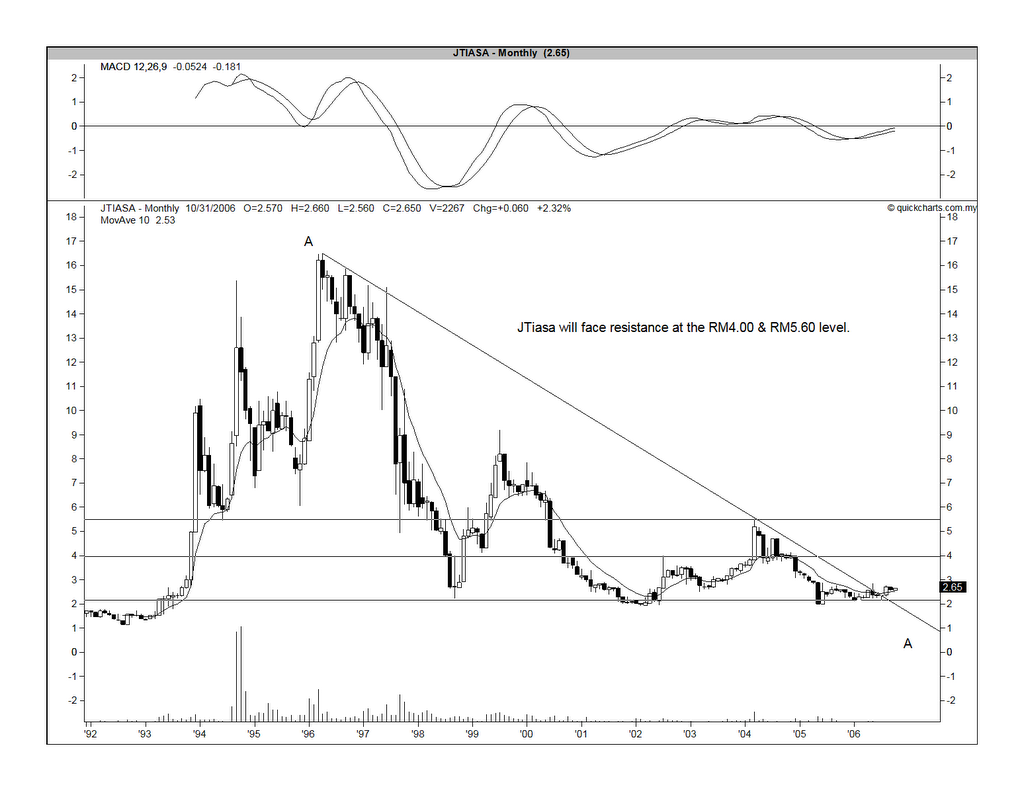
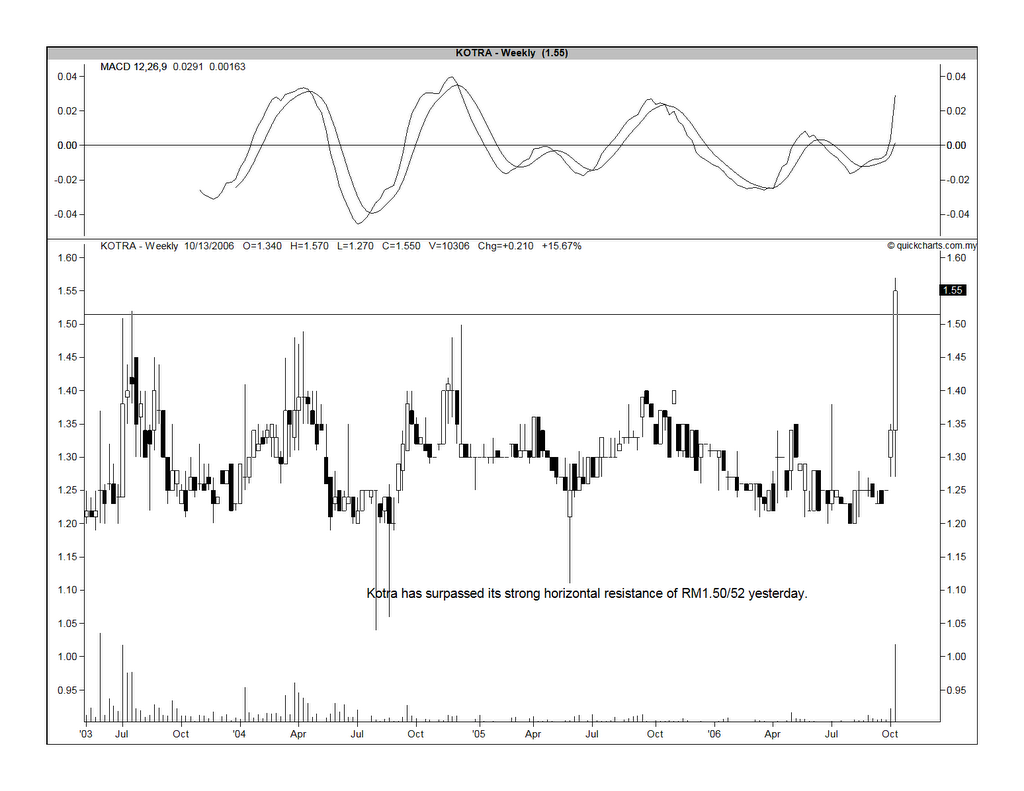
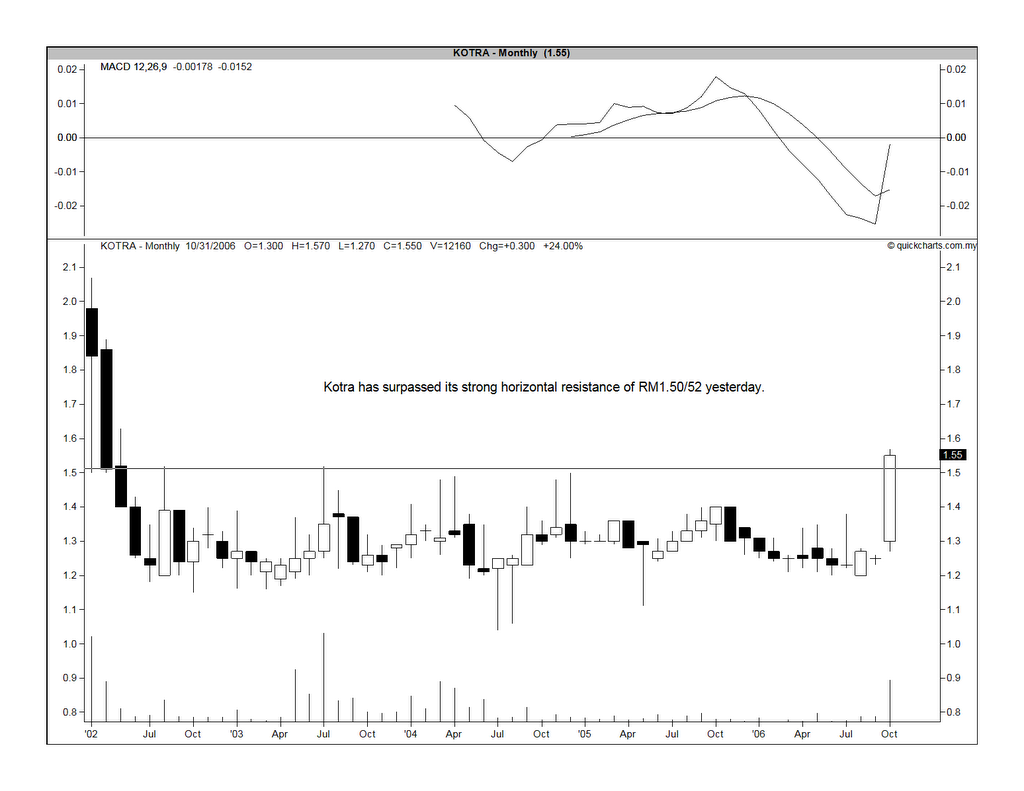
Chart 2: Magnum's weekly chart as at Oct 13, 2006 [with gross dividend (in sen) stated near the bottom of the chart]

Things a-changing

In 2 areas, things are beginning to change. They are:

1. Recent Financial Performance

If we compared the last 8 quarters’ results of BJToto & Magnum, we can see that Magnum’s financial performance has improved substantially. Of course, one can say that the sharp improvement is due to the fact that Magnum is starting from a lower base as compared to BJToto, but a significantly higher improvement is still a better story. Here, we note that Magnum’s latest 4 quarterly’s net profit (from 1/7/05 to 30/6/06) totaled RM 210 mil, representing an increase of 172% over the net profit of the preceding 4 quarters. This is despite a turnover that has increased by only 3.5% to RM2.8 billion during the same periods.

BJToto’s net profit for the latest 4 quarterly (from 1/8/05 to 31/7/06) has increased by 18% to RM425 mil over the net profit of the preceding 4 quarters. Turnover has increased by 7.8% to RM3.0 billion during the same periods. For more detail on BJToto's recent results (which is not very straight-forward), go here. See Table 3 & 4 below for Magnum & BJToto's last 8 quarterly results.


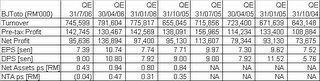
Table 3: BJToto's latest 8 quaterly results


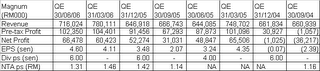
Table 4: Magnum's latest 8 quaterly results

2. Current Financial Position

After a long period of high dividend payout & 2 capital repayments totaling RM1.00 per share, BJToto’s financial position is not as strong as it used to be. Its NTA per share has dropped from a high of RM2.05 as at 30/4/02 to negative 4 sen as at 31/7/06. In addition, it has borrowing totaling RM750 mil as at 31/7/06 as compared to negligible borrowing as recently as 30/4/05. As a result, its gearing position has increased to 1.34 times its shareholders’ funds. If the cash reserves of RM402.9 mil is deducted from its total borrowings of RM750 mil, BJToto’s gearing would improve to 0.62 times as at 31/7/06.

Meanwhile, Magnum has been spending its cash reserve to buy back its shares. The amount spent was smaller & it has not reduced its cash reserve as much as the high dividend payout & capital repayment has impact BJToto’s cash reserve. As at 30/6/06, Magnum’s cash reserve stood at RM835 mil while borrowing was less than RM26 mil. Its NTA per share stood at EM1.31, of which 58 sen is in the form of cash or near-cash. See Table 5 & 6 below.


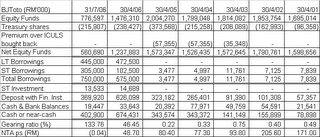
Table 5: BJToto's Financial Position for the past 6 years


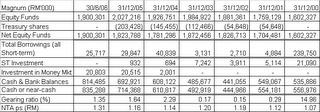
Table 6: Magnum's Financial Position for the past 6 years


What to expect from BJToto & Magnum in the near future?

For BJToto, I expect the dividend payout to normalize. Based on its last 4 quarters’ combined EPS of 34 sen & its current financial position, I do not believe BJToto can continue to pay an annual dividend of 40-50 sen much longer. I wonder how the market would react if and when BJToto shaves its dividend payout.

For Magnum, I believe that its improved financial performance coupled with its stronger financial position may enable the company do one or more of the followings:

a. To continue with its share buyback & possibly, cancellation of such shares;
b. To increase its dividend payout (as done last year, albeit on a small quantum);
c. To privatize its main subsidiary, Magnum4D & improve its result further.

Conclusion

Based on the above, I believe that Magnum is likely to outperform BJToto going forward.

Techfast- Major customer acquiring a substantial stake

Background

Techfast is involved in the manufacturing & sale of self-clinching fasteners (SCFs), that are used in the assembly of LCD and plasma screen TVs as well as PCs.

It commands an estimated 60% market share in Malaysia and exports to over 31 countries (under the trademark "TFM" which is registered in 22 countries). Exports make up 85% of revenue and 80% of profit. Techfast says its world market share for SCFs stands at around 0.4%.

Techfast's Malaysian operations in Shah Alam churn out more than 20 million SCF pieces a month, while its China set-up produces 10 million pieces a month.

Techfast has signed a shareholders agreement with 2 Thai partners to set up a manufacturing plant in Bangkok. It will hold a 55%-stake in the JV Company and production is expected to commence in November.

Since 2001, Techfast has had a strategic partnership with a well-established SCF player, the UK's Trifast plc, manufacturing SCFs for it on an OEM basis. At present, between 15% and 20% of all SCFs made by Techfast are supplied to Trifast.

Recent Development

Today, Techfast has announced that Trifast is acquiring a 25%-stake in Techfast from 4 of its major shareholders i.e. YS Yap (its chairman & MD), TO Lim (its ED), KL Fong (another ED) & CH Chin (a substantial shareholder). The 25%-stake, which represents 38 million shares, will be acquired at a cost of RM19 million cash or RM 0.50 each.

After their disposal, the 4 above shareholders’ collective stake will be reduced from 54.5% to 29.5%.

Recent Financial Results

Techfast’s net profit for QE30/6/06 increased 39.1% q-o-q or 27.3% y-o-y to RM1.46 mil. This was achieved on a turnover that has increased 12.9% q-o-q or 72.1% y-o-y to RM7.59 mil. See the table below.


Valuation

Based on its EPS of 0.96 sen for QE30/6/06, Techfast’s full-year EPS would be about 3.84 sen. At a closing price of RM0.555 yesterday, Techfast is trading at a PE of 14.45 times.

Technical Outlook

From the weekly chart below, we can see that Techfast is in an uptrend. The uptrend line support is at RM0.50. On weakness, it may drop back to the uptrend line & that would present a good entry to this stock.


Chart: Techfast's weekly chart as at Oct 16


Conclusion

Techfast is involved in a fast-growing business with very good prospect. Its major customer, Trifast sees the potential of the company & has decided to acquire a stake in the company. The key personnels remain unchanged & they still have substantial stake in the company. While the current price is not cheap, the future growth could see Techfast's net profit increasing significantly. As such, Techfast is a good long-term investment.

Monday, October 16, 2006

CI- Is it about to rally?

Last week, I've posted that the CI was poised to test the 980 level, which is the upper boundary of the bearish wedge that the CI has been trapped in for the past 3 years.

The CI has not only tested the 980 level, it has in fact broken above that level. With this breakout, the wedge would become a continuation pattern for the CI's prior trend, which is a gradual uptrend that started in March 2001. On the other hand, if the CI had broken below the lower boundary of the wedge, the wedge would become a reversal pattern.

This breakout must hold up for a reasonable duration of 3 to 5 days and it must be accompanied with a large volume (which was present for the past 2 days). See Chart 1 below.


Chart 1: CI's weekly chart as at Oct 13

From the monthly chart [Chart 2], we can see that the MACD has done a positive crossover, albeit a very marginal one, which must be confirmed by month-end closing. This MACD crossover is a fairly infrequent positive event (read: BUY signal). In the past 8 or 9 years, there have been 3 positive crossovers [denoted in Chart 2 as A1, A2 & A3].


Chart 2: CI's monthly chart as at Oct 13

Of the past 3 MACD positive crossovers, A1 can qualify as a super-rally while the other two [A2 & A3] were mild rallies [see Chart 3 below].


Chart 3: CI's monthly chart as at Oct 13 [overlaid with vertical lines]

I have tabulated the gain made in each of the past 3 rallies from the closing index in the month where the MACD confirmation was at hand to the peak index below. We can see that a mild rally can easily lead to a gain of 20-30% while a super rally could lead to a doubling of the index (I have serious doubt about this one).


Assuming that we have a real or genuine breakout (subject to confirmation by end of this month) and the CI is at, say 985; a mild rally lasting 5-7 months could put the CI to 1182 level. I dare not extrapolate where the CI would be if we have a super rally instead.

Important note: This is just a projection, which may or may not happen. There are a number of assumptions made which may not pan out in the manner that I've written here.

Friday, October 13, 2006

Mesdaq- rise again

Mesdaq, which was in a downtrend after it put in a double-top reversal on July 13, has broken out of the downtrend line on October 3 when it surpassed the 108 level. It's currently in a short-term uptrend and it will be coming up against the horizontal resistance of 113 soon. If it can surpass this resistance, its next resistance levels are 120 & 128. On the other hand, it may weaken & fall back to the short-term uptrend for support at 110 (& rising). See Chart 1 below.


Chart 1: Mesdaq's daily chart as at Oct 12


Chart 2: Mesdaq's weekly chart as at Oct 12


From the weekly chart [Chart 2] above, we can see that Mesdaq is still in an uptrend line which commenced in December 2005. This medium-term uptrend line should provide support at 106 (& rising).

The rise in Mesdaq this round is likely to be a more subdue affair because of huge losses incurred by market players in the last round as well as closer scrutiny by market regulators. In fact, I do not see any outstanding stock in this sector right now to lead the "charge" for the rest of the Mesdaq stocks.

Call Warrants as at Oct 12, 2006

Today, two new call warrants have been listed. They are Resorts-CA and Tenaga-CC. The main terms of these call warrants are:


The complete table of all listed call warrants is given below:


I have highlighted all the call warrants that have gross premium of less than 10% (in yellow) as well as the 2 call warrants i.e. Scomi-CA & Astro-CA that will expire in January 2007 (in pink). The price stated for 2 new call warrants are the issue price but at 12.00 noon, Tenaga-CC and Resorts-CA are trading at RM0.45 & RM0.47, respectively.

Note: If you like to have a copy of the Excel spreadsheet for the above Call Warrants listing, please drop me a line.

Tenaga has a very good 4Q2006

Recent Financial Results

Tenaga has announced its results for FYE2006. The net profit for the Group improved from RM1,280.0 million to RM2,126.9 million, an increase of RM846.9 million. This was achieved on a revenue of RM20,384.2 million which was RM1,406.7 million or 7.4% higher than the corresponding period in the last financial year. The better performance was attributable to higher electricity sales and the strengthening of Ringgit.

For 4Q2006, Tenaga recorded a net profit of RM403.6 million on a turnover of RM5,620.3 million. When compared to the corresponding fourth quarter FY2005, net profit shows a gain of RM332.8 million [or 82.5%] while turnover increased by RM664.2 million [or 13.4%]. When compared to the preceding quarter, net profit was higher by RM341.0 million [or 86.2%] while turnover was higher by RM599.2 million [or 11.9%].

The higher electricity sales- the main reason for the outsize improvement in net profit & turnover- is mainly due to tariff review that was approved by the Government with effect from 1 June 2006. See the table below for Tenaga's last 8 quarterly result.


Valuation

Based on the EPS of 18.07 sen for 4Q2006, Tenaga's full-year EPS may amount to 72.28 sen. At yesterday's closing price of RM9.85, Tenaga is now trading at a PE of 13.6 times. At this multiple, Tenaga is very attractive as it is a defensive stock & one of the prime blue chip in Malaysia. In better time, I believe that Tenaga can command a PE of 18 times.

Technical Outlook

From the weekly chart, we can see that Tenaga is in an upward channel. The lower & upper channels are RM9.50 & RM10.40, respectively. A break above the upper channel would signal the beginning of an accelerated move for Tenaga. See Chart 1 below.


Chart 1: Tenaga's weekly chart as at Oct 12


Chart 2: Tenaga's monthly chart as at Oct 12

From the monthly chart above, we can see that Tenaga needs to break above its immediate horizontal resistance of RM10 in order to go higher. The next resistance is at RM12.

Conclusion

From this, you may agree that Tenaga is an attractive long-term investment.

Note: You may opt to trade on Tenaga instead of investing long-term. In which case, you can consider any one of the existing 2 call warrants [i.e. Tenaga-CA or Tenaga-CB]. The new call warrant [Tenaga-CC], which has started trading today, has a much higher premium than the existing 2 call warrants. Nonetheless, I believe that Tenaga is a stock that is more suitable for long-term investment rather than short-term trading.

Thursday, October 12, 2006

Kian Joo has broken above its downtrend line

Background

Kian Joo is involved in the manufacture of can (both, general & aluminium can) as well as PET bottles & related plastic packaging products.

Proposed Corporate Exercise

On Sep 8, Kian Joo has announced a Bonus Issue of 1-for-5 plus a share split of 1 unit of 50-sen share into 2 units of 25-sen share. On completion of this exercise, a shareholder with 1,000 units of Kian Joo 50-sen share will end up with 2,400 units of Kian Joo 25-sen shares.

Recent Financial Results

Kian Joo reported a sharply lower net profit of RM2.8 mil for QE30/6/06. This represents a 79% drop when compared to both the net profit of the preceding quarter as well as the corresponding quarter last year. Turnover at RM154 mil is 4% higher than the preceding quarter's turnover but 6% lower than the turnover for the corresponding quarter last year.

Kian Joo attributed the poorer result to the following:

1. higher material & operating cost in the general can division, which resulted in loss of RM0.91 mil as compared to a profit of RM6.8 mil in the last quarter;
2. lower revenue & higher opearting cost in the aluminium can division, which resulted in a drop in profit from RM11.7 mil to RM9.4 mil; and
3. higher resin cost, one-off re-location expenses & VSS expenses, which has led to increased losses in the PET & plastics division from RM0.7 mil to RM2.5 mil.


Valuation

Based on the last 4 quarterly results, Kian Joo's EPS is about 20.15 sen. At the closing price of RM2.63 for today (Oct 12), Kian Joo is now trading at a PE of 13.2 times. This is quite near the fair value for a stock of comparable size & quality for the Malaysian stock market.

Technical Outlook

The main attraction of this stock is that it has just turned technically bullish. The share price has just broken above its medium-term downtrend line at the RM2.55 level. We can see that it has also surpassed the immediate horizontal resistance (now, turned into support) at RM2.60 level. The next resistance is at RM3.00.


Chart: Kian Joo's daily chart as at Oct 11

Conclusion

Based on the bullish technical outlook, I believe that Kian Joo is an interesting trading buy. The recent financial results is a disappointment but with the drop in the price of crude oil and most basic metals, I believe that Kian Joo's profit margin will rebound as would its bottomline.

JTiasa has a bullish breakout at RM2.82/85.

Background

JTiasa is involved in the extraction of timber logs & further downstream processing of timber logs.

Recent Financial Results

JTiasa has just announced its result for QE31/7/06, which shows a sharply higher net profit of RN22.5 mil. This net profit is 157% higher than the preceding quarter's net profit eventhough the turnover has declined by 8.0% to RM192 mil during the periods under consideration.

When comparison is made with the results for the corresponding quarter last year, we noticed that the net profit has increased by 59% while turnover has grown by 24.4%.


Valuation

Based on the latest EPS of 8.84 sen for QE31/7/06, we can arrive at an annualized EPS of 35.36 sen. At the closing price of RM2.65 yesterday, JTiasa is trading at a PE of 7.5 times. This is not expensive and given the on-going timber play, I see JTiasa may go up higher.

Technical Outlook

JTiasa has just broken above its strong horizontal resistance of RM2.82/85. See the weekly & monthly charts below.


Chart 1: JTiasa's weekly chart as at Oct 11


Chart 2: JTiasa's monthly chart as at Oct 11

Conclusion

JTiasa is a laggard in the on-going timber play. It is fundamentally inexpensive and it has just turned technically bullish. At the time of making post, JTiasa has gone up 25 sen to RM2.90.

CI may test the 980 resistance this week

At 10.30 a.m. this morning, the Ci is again at the 973 level, matching the high achieved on Oct 9. Gainers out-number losers 272 to 159. Volume traded is 238 million units.

The market looks like it can go higher still. The next resistance is at 980, given by the consolidation pattern in which the CI is trapped for the past 3 years. As such, the 980 resistance is a very strong resistance, which may not be overcome on first attempt. A break of this resistance will however see the market scaling heights that many market players have long given up on.


Chart: CI's weekly chart as at Oct 11

Wednesday, October 11, 2006

Kotra has a bullish breakout at RM1.50

Background

Kotra is involved in the development, manufacturing and marketing of a range of pharmaceutical products. Its products can be divided into 2 categories, which are sterile and non-sterile products. Sterile products consist of injectables in the form of liquid & powder, which provide a direct and immediate action on the end users. Non-sterile products comprise of capsules, tablets, syrup, suspension and cream, which are specifically formulated for oral and external use.

Recent Development

On Oct 9, Kotra has proposed the following:

1. A bonus issue of 6-for-5; and
2. A transfer of its listing from Mesdaq to the Main Board.

Recent Financial Results


From the above, we can see that Kotra's net profit has increased by 58.5% q-o-q or 70.5% y-o-y to RM3.4 mil. This is on the back of a turnover of RM20.3 mil, which represents an increase of 14.1% over the preceding quarter's turnover or 30.5% over the turnover of the corresponding quarter last year. EPS for the last 4 quarters totaled 17.8 sen.

Past 5 years performance


Kotra's turnover has been rising steadily from RM31.9 mil in 2002 to RM68.9 mil in 2006. During the same periods, its net profit has also increased from RM6.3 mil to RM10.0 mil. EPS has increased from 11.3 sen to 17.8 sen.

Technical Outlook

Kotra has broken above its strong horizontal resistance of RM1.50 yesterday. See the weekly chart below.


Chart 1: Kotra's weekly chart as at Oct 11

You can see that this horizontal resistance stretched back for earlier 2002. As such, this break can lead to a powerful move. See the monthly chart below.


Chart 2: Kotra's monthly chart as at Oct 11

Conclusion

Kotra could be a good trading buy. Unfortunately, this post is a tad late because the share price of Kotra is now at RM1.62.