Showing posts with label personal goods. Show all posts

Tuesday, February 08, 2022

BAT: Green Shots of Recovery

Result Update

For QE31/12/2021, BAT's net profit dropped 9.4% q-o-q or 2.0% y-o-y to RM71.5 million while revenue rose by 40.6% q-o-q or 30.5% y-o-y to RM862 million.

As explained in its press release, BAT "performed remarkably in 2021 with the volume growing for the first time since 2002, profit growing for the first time since 2015 and strong quarter on quarter improvement in our financial performance. The growth momentum comes from an increase in volume and share of market which, in turn, improved revenue and profit from operations. The volume increase was mainly due to the reduction in the tobacco black market by 6.1% compared to FY2020. This growth in volume led to a revenue of RM2.6 billion for FY2021 compared to RM2.3 billion in FY2020 (growth of 14%) and a profit from operations of RM411 million compared to RM346 million in FY2020 (increase of 19%)."
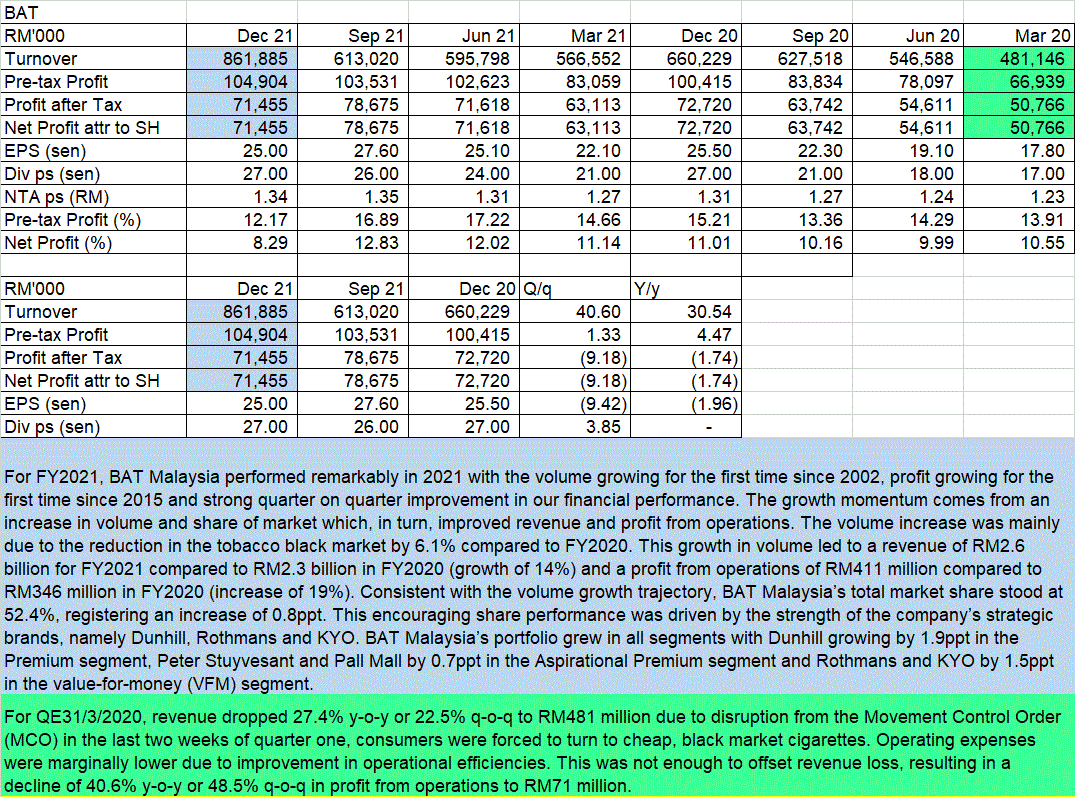

Table 1: BAT's last 8 quarterly results

In fact, the improved performance was seen mainly in the last quarter, ie. QE31/12/2021. See the sharp spike in the revenue in the graph below.


Graph: BAT's last 53 quarterly results

However, BAT's bottomline did not increase because the company made additional charge-off in the form of inventories write-down and restructuring expenses. See the table below.

Table 2: Changes in P&L items in QE31/12/2021, QE30/9/2021 & QE31/12/2020

Valuation

BAT (closed at RM12.40 today) is now trading at a PER of 12.4 times (based on the last 4 quarters' EPS of 99.8 sen). BAT has paid out quarterly dividend payment totaling of 98 sen over the past 4 quarters; thus giving a Dividend Yield of 7.9%. Based on the above, BAT is considered fairly attractive for a recovery play.

Technical Outlook

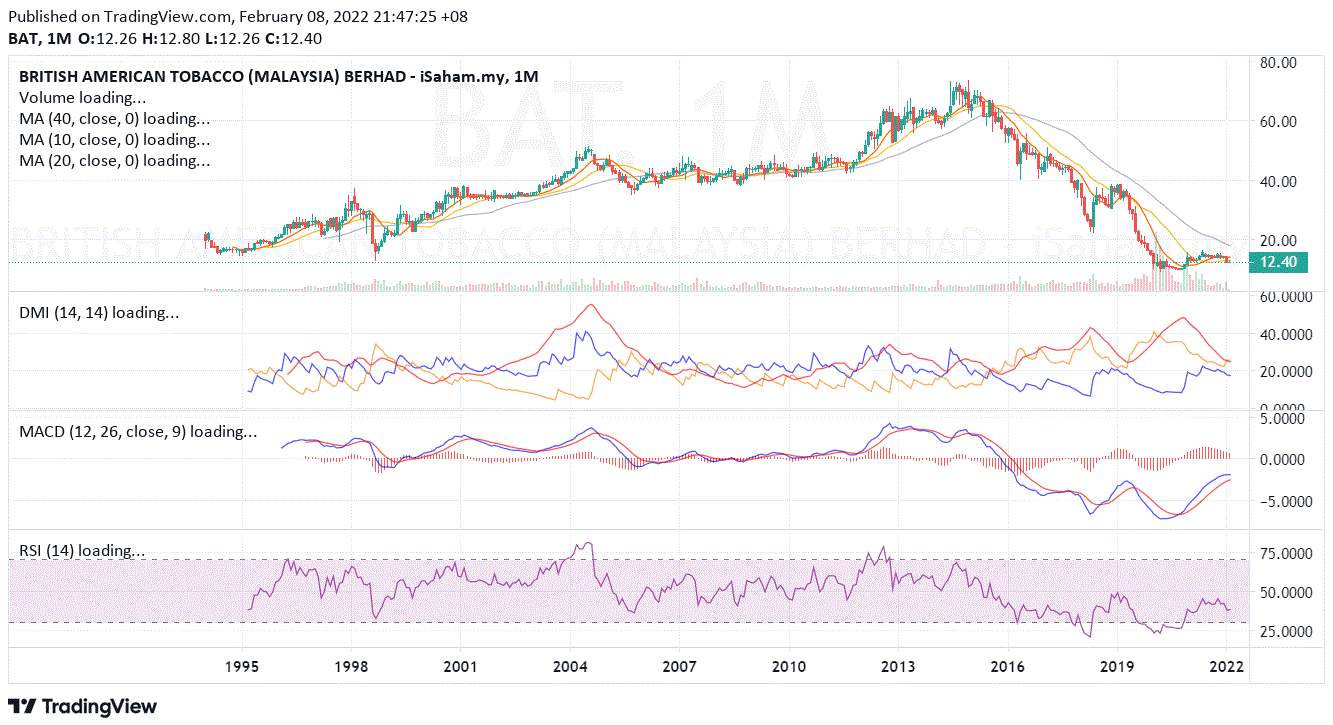
BAT dropped from its high of about RM74.00 in Dec 2014 to a low of RM9.20 in Mar 2020. In the last 12-13 months, the share prices were well-supported at the horizontal line at RM12.20-12.30. 


Chart 1: BAT's monthly chart as at Feb 8, 2022 (Source: isaham.my)

Chart 2: BAT's daily chart as at Feb 8, 2022 (Source: isaham.my)

Conclusion

Based on an improved financial performance, BAT is a good stock for a recovery play. This is notwithstanding its technical outlook remains bearish as the downtrend has yet to be reversed.

Note:
I hereby confirm that I do not have any direct interest in the security or securities mentioned in this post. However, I could have an indirect interest in the security or securities mentioned as some of my clients may have an interest in the acquisition or disposal of the aforementioned security or securities. As investor, you should fully research any security before making an investment decision.

Wednesday, November 25, 2020

KAREX: Time for a Party?

Result Update

For QE30/9/2020, Karex's net profit rose 213% q-o-q to RM4.5 million on the back of a 12%-increase in revenue to RM101.7 million. Compared to the same quarter last year, bottom line has turnaround from a loss of RM167k and revenue was higher by 6%.

Higher revenue was driven by condom sales from the Sexual Wellness segment and record-high contribution from the Medical segment during the quarter. In particular, condom sales to the Americas region in particular continued to expand and contributed positively to the profitability during the current quarter. A favourable sales mix during the quarter coupled with improved cost control initiatives such as incorporation of automation led to better operating efficiency resulting in a profit before tax of RM 7.0 million for the quarter. 


Table: Karex' last 8 quarters' P&L


Graph: Karex' last 28 quarters' P&L

Financial Position

Karex's financial position as at 30/9/2020 is deemed very healthy. Its current ratio stood at 2.3 X while total liabilities to equity stood at only 0.3 X.

Valuation

Karex (closed at RM0.845 yesterday) is now trading at a PER of 176x (based on last 4 quarters' EPS of 0.48 sen). Based on the high PER, Karex is deemed unattractive. However, if the earnings recovery continues, the valuation will be less demanding in the future.

Technical Outlook

Karex appears to have broken above the 2-year base of RM0.30-0.60.


Chart: Karex's weekly chart as at November 24, 2020 (Source: Malaysiastock.biz)

Conclusion

Based on improved financial performance, healthy financial position, and mildly positive technical outlook, Karex may be a good stock for a recovery play. However, the valuation is very demanding and a big rally will only spring up if earnings improved substantially.

Note: 

I hereby confirm that I do not have any direct interest in the security or securities mentioned in this post. However, I could have an indirect interest in the security or securities mentioned as some of my clients may have an interest in the acquisition or disposal of the aforementioned security or securities. As investor, you should fully research any security before making an investment decision.

Tuesday, May 26, 2020

BAT: Sales Dropped Sharply due to MCO Disruption

Result Update

For QE31/3/2020, BAT's net profit dropped 46% q-o-q or 43% y-o-y to RM51 million while revenue dropped by 27% q-o-q or 23% y-o-y to RM481 million.

The sharp drop in revenue was attributed to disruption from the Movement Control Order (MCO) in the last two weeks of quarter one, which caused consumers to turn to cheap, black market cigarettes. Operating expenses were marginally lower due to improvement in operational efficiencies but this was not enough to offset revenue loss, resulting in a decline of 48% q-o-q or 41% y-o-y  in profit from operations to RM71 million. 


Table: BAT's last 8 quarterly results


Graph: BAT's last 53 quarterly results

Valuation

BAT (closed at RM11.72 last Friday) is now trading at a PER of 10.9 times (based on the last 4 quarters' EPS of 107.8 sen). BAT has paid out quarterly dividend payment totaling of 105 sen over the past 4 quarters; thus giving a Dividend Yield of 9.0%. Though its valuation looks attractive, the concern for many investors is whether BAT can stop the continuous decline in both revenue and profits, since the MCO period covers the whole of the next quarter. Only time will tell.

Technical Outlook

BAT broke below its medium-term uptrend line, SS at RM12.60. It may slide to the horizontal line at RM11.00.


Chart: BAT's daily chart as at May 22, 2020 (Source: Malaysiastock.biz)

Conclusion

Based on a weak financial performance and a bearish technical outlook, BAT may be a contrarian stock for long-term investment. All the negative factors could be substantially factored in the share price which is trading at a PER of 10.9 times and a dividend yield of 9.0%.

Note:
I hereby confirm that I do not have any direct interest in the security or securities mentioned in this post. However, I could have an indirect interest in the security or securities mentioned as some of my clients may have an interest in the acquisition or disposal of the aforementioned security or securities. As investor, you should fully research any security before making an investment decision.

Tuesday, May 05, 2020

BAT: Rising from the Ashes

BAT share price has been dropping for so long that many investors have learned to avoid the stock. See the monthly chart below.

Chart 1: BAT's monthly chart as at May 4, 2020 (Source: Malaysiastock.biz)

The share price decline is brought on by the decline in revenue and profits. I have constructed a graph of BAT's rolling 4 quarters' revenue and profits, excluding lumpy restructuring expenses, from Dec 2007 up to Dec 2019.

Graph: BAT's rolling 4-quarter revenue and profit from Dec 2007 to Dec 2019

The latest quarterly results will be announced in 3 weeks' time. It will probably show further decline in revenue and profits. If that panned out, we can expect share prices, which have rallied from RM10 to RM13, may renew their decline. Why are investors buying into BAT shares now or in the near future?

The Investment Case for Buying BAT 

1) The share price has broken above the medium-term downtrend line, RR at RM12.00.


Chart 2: BAT's daily chart as at May 4, 2020 (Source: Malaysiastock.biz)

2) It is a well-managed multinational company. The downside is its products pose health risks which led to legal restrictions being imposed which curtailed its consumption.

3) BAT is trading at a fairly attractive valuation with PER at 10.9 times an dividend yield at 8.9%.

4) Due to poor enforcement, illegal cigarettes are widely available in Malaysia, and these compete very successfully against BAT's products as their selling prices are substantially lower. The result of this illegal trades is lower sales for cigarettes manufacturers, leading to plant shutdown and loss of employment. An example is BAT shutting down its main factory in Petaling Jaya, and moving its production to Indonesia. In addition, Malaysian government loses more than RM5 billion annually in term of duties/taxes collection due to the illegal trades (here).

In the Covid-19 environment where government income is sharply lower and employment opportunity is scare, a case can be made that the government will finally crack down on the illegal trades in cigarettes. This will lead to higher income flowing to the government coffers and greater employment opportunities for Malaysians. Consequently, we can expect increased sales and profits for the legal cigarette manufacturers such as BAT further down the road.

Conclusion

Based on technical and fundamental consideration, I believe BAT is a good stock for medium to long-term investment.

Note:

I hereby confirm that I do not have any direct interest in the security or securities mentioned in this post. However, I could have an indirect interest in the security or securities mentioned as some of my clients may have an interest in the acquisition or disposal of the aforementioned security or securities. As investor, you should fully research any security before making an investment decision.

Friday, February 21, 2020

BAT: What Are They Smoking?

As at 9:15 a.m., BAT made a high of RM14.10. This strong rally could be due to its results announcement for QE31/12/2019, which is the 4Q2019. 

From the table below, we can see that the quarterly revenue, profits and dividend dropped when compared to those of 4Q2018 (see point 1). In addition, its full-year revenue, profits and dividend also dropped when compared to FY2018 (see point 2).

Table: BAT's last 8 quarterly results

Technically speaking, BAT has surpassed its downtrend line at RM13.00. This may signal the end of its downtrend but it may not neccesarily lead to an uptrend rally anytime soon.

Chart: BAT's daily chart as at Feb 20, 2020 (Source: Malaysiastock.biz)

Based on the above, I think the current sharp rally may not sustain.

Tuesday, October 01, 2019

PRLEXUS: Earnings Rebounded Strongly

Results Update

Prlexus returned to the black in the QE31/7/2019. It reported a net profit pf RM7 million as compared to a net loss of RM2.9 million in QE30/4/2019 on the back of a 72%-jump in revenue to RM112 million. As compared to the same quarter last year, net profit rose 5-fold while revenue was up 36%.

Improved revenue was due to higher sales orders received from the apparels division. This led to higher capacity utilization from the apparels division, which in turn led to a profit of RM 9,218,000 in the current quarter mainly as compared to a loss of RM 2,714,000 in the preceding quarter. Despite the jump in bottom-line, the company did not appear to be overly optimistic about its next quarter performance. Instead it merely stated that the performance is likely to be stable.


Table: Prlexus's last 8 quarterly results


Graph: Prlexus's last 44 quarterly results

Financial Position

As at 31/7/2019, Prlexus's financial position is deemed satisfactory with current ratio at 2.2 times and gearing ratio at 0.6 time.

Valuation

Prlexus (closed at RM0.69 yesterday) is now trading at a PE of 20 times (based on last 4 quarters' EPS of 3.46 sen). At this PER, Prlexus is deemed fully valued.

Technical Outlook

After it peaked at RM2.12 in November 2015, Prlexus dropped continuously to a low of RM0.41 in July this year. Since September 10, Prlexus has risen about 30 sen to RM0.70 now. Its immediate resistance is at the horizontal line at RM0.77.


Chart: Prlexus's weekly chart as at Sep 30, 2019 (Source: Malaysiastock.biz)

Conclusion

Based on the improved financial performance and satisfactory financial position, I revised Prlexus' rating from a SELL to a HOLD. If the next quarter result shows further improvement, then its rating can be upgraded to a BUY.

Note:

I hereby confirm that I do not have any direct interest in the security or securities mentioned in this post. However, I could have an indirect interest in the security or securities mentioned as some of my clients may have an interest in the acquisition or disposal of the aforementioned security or securities. As investor, you should fully research any security before making an investment decision.

Wednesday, September 11, 2019

Magni: Earnings Continued to Rise

Results Update

In QE31/7/2019, Magni's net profit rose 40% q-o-q or 39% y-o-y to RM30.5 million while revenue rose 40% q-o-q or 20% y-o-y to RM327 million.

Revenue rose 40% q-o-q due to 45%-increase in Garment revenue mainly due to higher sale orders received while packaging revenue slipped by 5.9% amid lower sale orders received.

PBT increased by 50% q-o-q due to 59%-increase in Garment PBT mainly due to higher revenue, better gross profit margin mainly driven by the improvement in operational efficiency, and the lower foreign exchange loss of RM0.011 million versus foreign exchange loss of RM1.126 million in QE30/4/2019. Packaging PBT was 37.9% lower mainly due to weaker revenue, gross profit margin and dividend income.


Table: Magni's last 8 quarterly results


Graph: Magni's last 50 quarterly results

Financial Position

As at 31/7/2019, Magni's financial position was very healthy with current ratio at 5.3 times and gearing ratio at only 0.21 time.

Valuation

Magni (closed at RM5.40 yesterday) has a trailing PE of 7.9 times (based on last 4 quarters' EPS of 68.3 sen). At the same time, Magni  paid quarterly dividend which totaled 23 sen; giving the stock a DY of 4.26%. Overall, Magni is still fairly attractive.

Technical Outlook

Magni has been gradually rising in the past 9 months. It has now surpassed the resistance from the horizontal line at RM5.25 as well its July high at RM5.38. It may continue to climb higher and test the resistance at the horizontal line at RM5.65


Chart: Magni's weekly chart as at Sep 10, 2019 (Source: Malaysiastock.biz)

Conclusion

Based on good financial performance and position, attractive valuation and mildly bullish technical outlook, Magni is a good stock to consider for long-term investment.

Note:

I hereby confirm that I do not have any direct interest in the security or securities mentioned in this post. However, I could have an indirect interest in the security or securities mentioned as some of my clients may have an interest in the acquisition or disposal of the aforementioned security or securities. As investor, you should fully research any security before making an investment decision.

Tuesday, March 19, 2019

Magni: Profits Rose Despite Lower Revenue

Results Update

In QE31/1/2019, Magni's net profit rose 54% q-o-q or 14% y-o-y to RM36 million while revenue was mixed- up 21% q-o-q but down 1.4% y-o-y to RM309 million.

Revenue receded slightly by 1.4% y-o-y due to lower revenue from the garment segment (dropped by 1.1% mainly due to lower sale orders received) and lower revenue for the packaging revenue (dropped by 4.2% mainly due to lower sale orders received). Profit before tax improved by 7.7% y-o-y due to 6.4%-increase in PBT from the Garment segment (mainly due to higher foreign exchange gain by RM2.992 million and lower operating expenses incurred) and 46.4%-increase in PBT from the packaging segment (mainly due to lower operating expenses incurred).


Table: Magni's last 8 quarterly results


Graph: Magni's last 48 quarterly results

Financial Position

As at 31/1/2019, Magni's financial position was very healthy with current ratio at 5.4 times and gearing ratio at only 0.14 time.

Valuation

Magni (closed at RM4.66 yesterday) has a trailing PE of 7.5 times (based on last 4 quarters' EPS of 62.15 sen). At the same time, Magni  paid quarterly dividend which totaled 23 sen; giving the stock a DY of 4.9%. Overall, Magni is still fairly attractive.

Technical Outlook

Magni has been trading sideways for the past 1 years, mostly in a range between RM4.00 and RM5.00. Until a breakout of this range has happened, Magni would remain range bound.


Chart: Magni's weekly chart as at Mar 18, 2019 (Source: Malaysiastock.biz)

Conclusion

Based on good financial performance and position plus attractive valuation, Magni is a good stock to consider for long-term investment.

Note:

I hereby confirm that I do not have any direct interest in the security or securities mentioned in this post. However, I could have an indirect interest in the security or securities mentioned as some of my clients may have an interest in the acquisition or disposal of the aforementioned security or securities. As investor, you should fully research any security before making an investment decision.

Thursday, July 19, 2018

BAT: Green Shoots of Recovery Sighted

Result Update

For QE30/6/2018, BAT's net profit rose 23% q-o-q but dropped 16% y-o-y to RM96 million while revenue dropped by 9% q-o-q or 17% y-o-y to RM638 million.

Revenue rose 6.5% q-o-q due to volume growth of 4.8% versus the first quarter of 2018. The Group registered a market share of 57.2% (new reporting vs. 53.5% at old reporting) in the second quarter of 2018 (based on restated legal market share), despite a 1.0ppt-decrease in market share registered by Dunhill to 39.7% from 40.7% in the first quarter 2018 (Note: The correction of 1.0ppt versus preceding quarter was partially due to the growth of Value for Money (VFM) segment and the continuous pressure of high levels of illegal and quasi legal (illegal tax stamps) trade.

Value for money brands increased its market share by 0.2ppt and Aspirational Premium brands increased their market share marginally by 0.2ppt.  This improving volume performance was the main driver for the second quarter revenue and gross profit growth of 6.5% (RM41 million) and 8.7% (RM 17 million) respectively, when compared to the preceding quarter.

Operating expenses were 9.7% (or, RM6 million) lower than preceding quarter. Operating expenses dropped due to lower overhead costs driven by cost base transformation initiatives the Group has undertaken and timing of other operating expenditure. As a result, Profit from Operations in the second quarter of 2018 grew 17.1% (RM22 million) when compared to the preceding quarter.


Table: BAT's last 8 quarterly results

BAT's revenue grew for the first time after declining for the past 3 years. Profits have been declining in a zig-zag fashion - with the magnitude determined by provisioning exercise or timing of expenses.


Graph: BAT's last 45 quarterly results

Valuation

BAT (closed at RM33.68 yesterday) is now trading at a PER of 22 times (based on the last 4 quarters' EPS of 151.7 sen). BAT has paid out quarterly dividend payment totaling of 154 sen over the past 4 quarters; thus giving a Dividend Yield of 4.6%. It is encouraging to note that dividend increased to 35 sen from 33 sen in QE31/3/2018.

Technical Outlook

BAT is still in a long-term downtrend line, with resistance at RM37.80-38.00.


Chart 1: BAT's weekly chart as at July 19, 2018 (Source: Malaysiastock.biz)


Chart 2: BAT's monthly chart as at July 19, 2018 (Source: Shareinvestor.com)

Conclusion

Based on possible turnaround in financial performance and increased dividend payment, BAT is now worth considering for long-term investment. However its next upleg will only begin once BAT managed to break above its downtrend line at RM37.80-38.00.

Note:
I hereby confirm that I do not have any direct interest in the security or securities mentioned in this post. However, I could have an indirect interest in the security or securities mentioned as some of my clients may have an interest in the acquisition or disposal of the aforementioned security or securities. As investor, you should fully research any security before making an investment decision.

Sunday, June 24, 2018

Magni: Earnings Stayed Weak

Results Update

In QE30/4/2018, Magni's net profit dropped 35% q-o-q or 48% y-o-y to RM20 million while revenue dropped 30% q-o-q or 26% y-o-y to RM221 million.

Group revenue decreased by 26% q-o-q due to 28%-decline in garment revenue mainly due to lower sale orders received and unfavorable foreign exchange movements; 12%-drop in packaging revenue mainly due to the cessation of offset printing packaging (OPP) business in Q4-FYR 2017; and 3%-dip in revenue of the continuing packaging operations (comprising flexible plastic and corrugated packaging) due to lower sale orders received.

PBT decreased by 50.3% q-o-q due to 51%-drop in garment PBT mainly due to lower revenue, higher foreign exchange loss (by RM3.082 million) and higher operating expenses to revenue ratio; 42%-drop in Packaging PBT mainly due to lower revenue in Q4-FYR 2018; and reversal of provision for OPP business closure costs (RM0.307 million) in Q4-FYR 2017.


Table: Magni's last 8 quarterly results


Graph: Magni's last 45 quarterly results

Valuation

Magni (closed at RM5.10 last Friday) has a trailing PE of 9 times (based on last 4 quarters' EPS of 56.15 sen). Albeit the dividend cut, Magni still pays quarterly dividend which totaled 20 sen in the past 4 quarters; giving the stock a DY of 3.9%. Overall, Magni is still fairly valued.

Technical Outlook

Magni could have broken its long-term uptrend.


Chart 1: Magni's monthly chart as at June 22, 2018 (Source: ShareInvestor.com)

However, Magni has recently broken above its intermediate downtrend line, RR. Magni's immediate support will be at RM4.60-4.70.


Chart 2: Magni's weekly chart as at June 22, 2018 (Source: ShareInvestor.com)

Conclusion

Despite the weaker earnings and bearish technical outlook, I would rate Magni a HOLD to reflect a temporary pause in performance of an outstanding stock.

Note:

I hereby confirm that I do not have any direct interest in the security or securities mentioned in this post. However, I could have an indirect interest in the security or securities mentioned as some of my clients may have an interest in the acquisition or disposal of the aforementioned security or securities. As investor, you should fully research any security before making an investment decision.

Tuesday, May 22, 2018

BAT: Profits Improved Slightly On Lower Revenue

Result Update

For QE31/3/2018, BAT's net profit rose 23% q-o-q but dropped 16% y-o-y to RM96 million while revenue dropped by 9% q-o-q or 17% y-o-y to RM638 million.

Revenue dropped by 9% q-o-q due to decline in sales volume of 3.0% compared to immediate preceding quarter. The Group registered market share growth from 53.9% in the fourth quarter of 2017 to 54.7% in the first quarter of 2018, as Dunhill registered a 0.5ppt-increase in market share to 38.2% while Value for Money brands increased its market share by 1.2ppt to 30% and Aspirational Premium brands increased their market share marginally from 42 to 44% (despite a drop in volume). As a result of the lower volume performance, BAT's gross profit dropped 5.3% q-o-q. Operating expenses were 39.4% (RM40.6 million) lower than preceding quarter- due to the absence of provision of impairment for prepaid excise duties (compared to RM21 million provided in the preceding quarter), lower distribution & marketing cost and timing of other expenses. Lower operating expenses had more than offset the drop in gross profit- leading to a 23.2%-increase in operating profit. Higher operating profit flowed thru to higher PBT, PAT & NP.


Table: BAT's last 8 quarterly results

BAT's revenue has been on a decline for the past 3 years, with no sign of bottoming out. Profits have been declining in a zig-zag fashion - with the magnitude determined by provisioning exercise or timing of expenses.


Graph: BAT's last 45 quarterly results

Valuation

BAT (closed at RM33.40 yesterday) is now trading at a PER of 20 times (based on the last 4 quarters' EPS of 164.70 sen). BAT has paid out quarterly dividend payment totaling of 162 sen over the past 4 quarters; thus giving a Dividend Yield of 4.85%. If BAT's revenue & profits were to stabilize, the stock will be an attractive stock as these multiples are fairly attractive for a well-managed MNC.

Technical Outlook

BAT is likely to be still in a long-term downtrend. It is now pressing against the 40-week EMA line at RM33.20.


Chart 1: BAT's weekly chart as at May 21, 2018 (Source: Shareinvestor.com)

The immediate support & resistance are at RM32 & RM36.


Chart 2: BAT's daily chart as at May 21, 2018 (Source: Shareinvestor.com)

Conclusion

Based on a still weak financial performance and a still bearish technical outlook, BAT is a stock to be purchased with caution. However once the company's revenue and profits have made a bottom, it could be a good stock to invest in as it is a well-managed company.

Note:
I hereby confirm that I do not have any direct interest in the security or securities mentioned in this post. However, I could have an indirect interest in the security or securities mentioned as some of my clients may have an interest in the acquisition or disposal of the aforementioned security or securities. As investor, you should fully research any security before making an investment decision.

Thursday, April 19, 2018

BAT: The Bottom could be in.


Today we are again seeing huge volume for British American Tobacco Bhd (BAT). As at 2:45pm, the volume traded for BAT was 1.67 million. BAT (at RM23.90 then) was up RM1.14 from yesterday close. I denoted this as “C”.

This huge volume and the price rally is the opposite of 2 previous days of huge volume in mid-Feb (denoted as “A”) and on April 17 (denoted as “B”). In the sell-off in mid-February, the share price dropped from RM33.00 to RM29.50. The sell-off on April 17 did not cause a noticeable drop in the share price.

These 3 days of huge volume suggests the presence of selling pressure in the market. The change in the price movement – from price decline to relative price stability and finally to price rally - suggest that BAT may finally have dropped to a price level that is cheap enough that we are witnessing a competition among the interested buyers. We can see it very clearly that these buyers are competing and it caused the share price to rally.

Chart 1: BAT's daily chart as at April 19, 2018_2.45pm (Source: Shareinvestor.com)

BAT is a well-managed MNC with a history of profit that stretches back as far as Bursa’s record is available. The last 2 years of lower profit was due mainly to the cost of restructuring as BAT closed its manufacturing plant and shifted its supply chain to a neighbouring country. This is a good opportunity to get into a well-managed company trading at very undemanding multiple.

Chart 2: BAT's monthly chart as at April 19, 2018_2.45pm (Source: Shareinvestor.com)

Graph: BAT's last 18 years revenue, profits and EPS/DPS

I think BAT is now attractive enough to buy since its peak at RM73 in late 2014. BAT’s PER is 13.8 times while its dividend yield is at a eye-popping 7.1%. I recommend this as a long-term BUY.

Note: For more on BAT, go to my earlier post.

Thursday, February 15, 2018

BAT: Earnings Plummeted


Result Update

For QE31/12/2017, BAT's net profit dropped 45% q-o-q or 74% y-o-y to RM78 million while revenue dropped by 8% q-o-q or 17% y-o-y to RM700 million.

Revenue decreased by 7.5% due to decline in sales volume of 3.0% compared to immediate preceding quarter as well as decline in higher price segment. The Group registered market share growth from 53.6% in the third quarter to 53.9% in the fourth quarter of 2017 with Dunhill registering a 0.7%-decrease in market share to 37.7% while Aspirational Premium brands, Peter Stuyvesant and Pall Mall, increased their market share to 10.9%. The group entered the Value For Money (VFM) segment in October 2017 through the introduction of Rothmans. In the fourth quarter of 2017, Rothmans stood at 1.8% market share and was becoming the fastest growing brand within the VFM segment, exiting 2017 at 2.8% market share.

Operating expenses were 39.1% (RM33 million) higher than preceding quarter. Operating expenses, excluding the provision of impairment for prepaid excise duties of RM21 million, increased 14.9% (RM13 million) versus immediate preceding quarter.

After deducting restructuring expenses of RM1.4 million which consisted of on-going cost of the project and outplacement programs, operating profit declined 44.4% (RM84.1 million) when compared to the immediate preceding quarter.


Table 1: BAT's last 8 quarterly results

BAT's revenue and profits have been on a decline for the past 3 years. There is no sign that these have hit hot the bottom.


Graph: BAT's last 44 quarterly results

Valuation

BAT (closed at RM29.06 yesterday) is now trading at an adjusted PER of 16.9 times (based on the last 4 quarters' EPS of 172.6 sen). BAT has paid out quarterly dividend payment totaling of169 sen; thus giving a Dividend Yield of 5.8%. If BAT's revenue & profits were to stabilize, the stock will be an attractive stock as these multiples are fairly attractive for a well-managed MNC.

Technical Outlook

BAT broke its long-term uptrend line, SS at RM52 in April 2016. In the last 2 months, it broke the psychological support at RM40 as well as the horizontal line at RM38. Today it broke another psychological support of RM30.00. Its next support is at the horizontal line at RM27.


Chart: BAT's monthly chart as at Feb 14, 2018 (Source: Shareinvestor.com)

Conclusion

Based on dateriorating financial performance and bearish technical outlook, BAT is a stock to be avoided. However once the company's revenue and profits have made a bottom, it could be a good stock to invest in as it is a well-managed company.

Note:
I hereby confirm that I do not have any direct interest in the security or securities mentioned in this post. However, I could have an indirect interest in the security or securities mentioned as some of my clients may have an interest in the acquisition or disposal of the aforementioned security or securities. As investor, you should fully research any security before making an investment decision.

Wednesday, December 13, 2017

Magni: Profits Stabilize While Revenue Still Sliding

Results Update

In QE31/10/2017, Magni's net profit dropped 28% y-o-y to RM20.5 million while revenue dropped 10% y-o-y to RM252 million. However, net profit rose 5% q-o-q though revenue still dropped 14% q-o-q.

Group revenue dropped y-o-y due to 8.7%-decline in Garment revenue due to lower sale orders received and 18.9%-drop in Packaging revenue due to the cessation of offset printing packaging business in Q4-FYR 2017.

Group PBT dropped 28.0% y-o-y due to 26.3%-drop in Garment PBT which mainly due to lower revenue, higher operating expenses and foreign exchange loss. Packaging PBT decreased by 59.1% y-o-y mainly due to higher raw material costs and operating expenses, and lower revenue

As a result of lower profits, Magni cut its dividend to 4.5 sen from 5 sen paid out in the same quarter last year.


Table: Magni's last 8 quarterly results


Graph: Magni's last 43 quarterly results

Valuation

Magni (closed at RM6.01 yesterday) has a trailing PE of 9 times (based on last 4 quarters' EPS of 66.46 sen). Albeit the dividend cut, Magni still pays quarterly dividend which totaled 21 sen in the past 4 quarters; giving the stock a DY of 3.5%. Overall, Magni is still fairly valued.

Technical Outlook

Magni is still in a long-term uptrend. That uptrend has accelerated twice fom SS to S1-S1 to S2-S2. The support of S2-S2 is at RM6.00. The next support will be at the uptrend line, S1-S1 at RM5.00. The indicator readings are not encouraging; the MACD line is poised to cross below the MACD signal line, the +DMI is dropping against a rising -DMI, and, lastly, Slow Stochastic has broken its uptrend line. All these indicator readings are warning signs that the RM6.00 support may not hold out for long.


Chart: Magni's monthly chart as at Dec 12, 2017 (Source: ShareInvestor.com)

Conclusion

Despite the poorer earnings and dividend cut, Magni is still a good stock for long-term investment. The good entry level may be between RM5.00 and RM5.50.

Note:

I hereby confirm that I do not have any direct interest in the security or securities mentioned in this post. However, I could have an indirect interest in the security or securities mentioned as some of my clients may have an interest in the acquisition or disposal of the aforementioned security or securities. As investor, you should fully research any security before making an investment decision.

Monday, September 18, 2017

MAGNI: Earnings Plunged

Results Update

Last Thursday (Sep 14), Magni announced its result for QE31/7/2017. Its net profit dropped 49% q-o-q or 17% y-o-y to RM20 million while revenue dropped 2% q-o-q but rose 8% y-o-y to RM294 million.

Revenue dropped y-o-y due to lower Garment revenue which decreased by 0.8% due to unfavorable foreign exchange differences and lower Packaging revenue which dropped 12.7% due to the closure of offset printing packaging business. These were partially offset the higher revenue from the continuing packaging operations which increased by 1.8%.

PBT dropped y-o-y due to lower Garment PBT which decreased by 43.2% mainly due to lower gross profit margin, higher operating expenses and softer revenue; lower Packaging PBT which dipped by 47.9% mainly due to higher raw material costs for corrugated packaging business. In addition, the comparative PBT for the immediate preceding quarter i.e. QE30/4/2017 was inflated by insurance claims (RM0.216 million) and reversal of over provision of business closure costs (RM0.356 million) in QE30/4/2017 by the discontinued packaging operation.

As a result of the sharp drop in profits, Magni cut its dividend to 3.5 sen from 6 or 7 sen in the immediate past 2 quarters. While the dividend cut may conserve its reserve for contingency or for new investment.


Table: Magni's last 8 quarterly results


Graph: Magni's last 42 quarterly results

Valuation

Magni (closed at RM6.16 on Friday) has a trailing PE of 8.6 times (based on last 4 quarters' EPS of 71.39 sen). Albeit the dividend cut, Magni still pays quarterly dividend which totaled 21.5 sen in the past 4 quarters; giving the stock a DY of 3.5%. Overall, Magni is still quite attractively valued.

Technical Outlook

Magni is still in a long-term uptrend, supported by its 10-month EMA line at RM6.00. Below this, Magni may have support from the 20-month EMA line at RM5.00 and then the horizontal line at RM4.50.


Chart 1: Magni's monthly chart as at Sep 15, 2017 (Source: ShareInvestor.com)


Chart 2: Magni's weekly chart as at Sep 15, 2017 (Source: ShareInvestor.com)

Conclusion

Despite the sharp drop in earning and dividend cut, Magni is still a good stock for long-term investment based on attractive valuation. After the sufficient price drop, the stock will be more appealing. The good entry level may be between RM5.00 and RM6.00.

Note:

I hereby confirm that I do not have any direct interest in the security or securities mentioned in this post. However, I could have an indirect interest in the security or securities mentioned as some of my clients may have an interest in the acquisition or disposal of the aforementioned security or securities. As investor, you should fully research any security before making an investment decision.