Sunday, January 27, 2019

Takaful: Quarterly PBT Exceeded RM100 Million!

Results Update

For QE31/12/2018, Takaful's net profit rose 8% q-o-q or 61% y-o-y to RM91 million while revenue rose 8% q-o-q or 35% y-o-y to RM702 million. Revenue rose q-o-q due to higher sales generated from Family Takaful business. Profit before zakat and taxation rose q-o-q mainly attributable to higher net wakalah fee income. Family Takaful business generated higher gross earned contributions of RM497.6 million, increased by 14%, as compared to RM436.7 million in the immediate preceding quarter. The increase was mainly attributable to higher sales from credit related products.General Takaful business generated gross earned contributions of RM166.0 million, decreased by 6%, as compared to RM177.1 million in the immediate preceding quarter. Thedrop was mainly due to lower revenue from motor classes.


Table: Takaful's last 8 quarters' results

You should note that Takaful's quarterly PBT broke above the RM100 million level for the first time.


Graph: Takaful's last 51 quarters' results

Valuation

Takaful (at RM4.10 last Friday) is now trading at a PE of 11.5times (based on the last 4 quarters' EPS of 35.8 sen). For a growth stock with 3-year CAGR of 23%, Takaful's PEG ratio is about 0.5 time. As such, Takaful is deemed attractive.

Technical Outlook

Takaful has been range-bound for the past 3 years, with support at RM3.25 and resistance at RM4.00. Last friday, Takaful finally broke out of the trading range.


Chart: Takaful's weekly chart as at Jan 25, 2019 (Source: Malaysiastock.biz)

Conclusion

Based on satisfactory financial performance, attractive valuation and bullish technical outlook, Takaful is a very good stock for long-term investment.

Note:

I hereby confirm that I do not have any direct interest in the security or securities mentioned in this post. However, I could have an indirect interest in the security or securities mentioned as some of my clients may have an interest in the acquisition or disposal of the aforementioned security or securities. As investor, you should fully research any security before making an investment decision.

Tuesday, January 22, 2019

MSNIAGA: Fakers and Fake News


Today MSNIAGA share price rose 34 sen to RM1.50 (or, what's commonly known in the market as a price limit-up). The reason was the company securing a contract worth RM1.9 billion for the Enhanced Malaysia International Internet Gateway ("EM-IIG") High-Speed Broadband project, developed by Xiddig Cellular Communications Sdn Bhd.

The acronym EM-IIG used to refer to East Malaysia International Internet Gateway, which was intended to reduce the digital gap between the rural and urban population via the provision of high speed broadband Internet. The earlier version was announced by then DPM Zahid Hamadi in July 2016 (here).

The current version of EM-IIG is supposed to be part of the 5G platform for Southeast Asia, and was supposedly announced by current DPM Wan Azizah on January 18, 2019. Unfortunately, she was not present at the ceremony and her speech was apparently read by the former Chief Minister of Penang, Rashid Hasnon. Now, DPM Wan Azizah claimed that she did not approve the project (here), and Rashid has just come forward and claimed that he was asked to deliver DPM Wan Azizah's speech at the ceremony as the last minute replacement for DPM Wan Azizah (here). What can I say; stranger things had happened before in Boleh-land!

As for MSNIAGA, it is now a forgone conclusion that the RM1.9 billion contract was not worth the paper it was printed on. We can expect the share price to make a quick retreat tomorrow.


Chart 1: MSNIAGA's monthly chart as at Jan 22, 2019 (Source: Malaysiastock.biz)

After the selldown, investors will still be pondering the big question: Why wasn't MSNIAGA suspended on January 18 when the project was supposedly announced by DPM Wan Azizah? Surely it would have known that it has secured a lucrative project. The trading of the share on January 18 seems to suggest that no one was aware of the project. The announcement was made only after the market closed (here). There are 2 possible explanation for this: (1) MSNIAGA was very effective in containing price-sensitive information or (2) none of the insiders was convinced that the project was real.


Chart 2: MSNIAGA's 15-min intra-day chart as at Jan 22, 2019 (Source: Malaysiastock.biz)

This episode will leave many questions looking for answers. One of them would certainly be this; why would anyone dare to pull a stunt like this over DPM Wan Azizah?

Tuesday, January 15, 2019

Market Outlook as at January 15, 2019

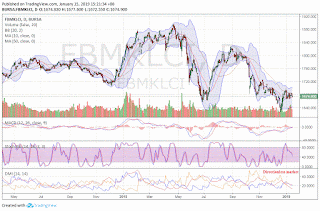
The market has been very dull in the past few days. The Direction Movement Index indicator are showing both +DMI & -DMI going lower with ADX also going lower. We will likely see listless sideways trading for next few days. 

Chart 1: FBMKLCI's daily chart as at Jan 15, 2019_3.00pm (Source: Malaysiastock.biz)

The same listless trading may likely be seen in US markets too. For DJIA, the rebound may have run its course and the market is ripe for another 200 or 300-point dip.

Chart 2: DJIA's daily chart as at Jan 14, 2019 (Source: Stockcharts.com)

Based on the above, I believe that the opportunity for trading is fairly limited. If you choose to trade, you have to settle for quick/small profit. If you are buying for longer term, you can wait for further weakness. Good luck!

IJM & GAMUDA: Looking like 2009

When you compare the charts of IJM and GAMUDA last 12 months with the charts for 2008-2009, the similarity is pretty uncanny. It looks like both stocks are tracing out their bottoms. Take a look at the MACD and ADX indicators.

1. IJM


Chart 1: IJM's monthly charts for 2007-2009 & 2017-2019

2. GAMUDA


Chart 2: Gamuda's monthly charts for 2008-2009 & 2018-2019

I think that it may be a good time to nibble into these 2 construction stocks.

Monday, January 07, 2019

Market Outlook as at January 7, 2019


FBMKLCI rebounded today with a gain of 9.4 points to close at 1679. From the weekly chart below, it looks like MACD is poised to cross above the MACD signal line to give the bullish MACD crossover. In addition, the elevated -DMI is beginning toturn downward while the depressed +DMI is beginning to turn upward. The elevated ADX, which confirms the strength of the preceding downtrend, is also beginning to turn downward. The last 2 times the index rebounded off the "uptrend line" with the similar MACD and ADX set-ups were in September 2011 and August 2015. We may see a mild rally like August 2015 or a strong rally like September 2011.


Chart 1: FBMKLCI's weekly chart as at Jan 7, 2019 (Source: Malaysiastock.biz)

Another condition that will be supportive of a rally is the strengthening of MYR vis-a-vis USD. The last time we saw the MYR strengthened against USD was in 2017. That coincided with a 6-month rally in FBMKLCI.


Chart 2: USD-MYR's weekly chart as at Jan 7, 2019 (Source: Investing.com)

The strengthening of MYR is in turn supported by the recovery in crude oil prices and CPO prices. From the charts below, we can see that Brent has broken above the downtrend line while CPO looks poised to challenge its downtrend line.


Chart 3: Brent's daily chart as at Jan 4, 2019 (Source: Stockcharts.com)


Chart 4: CPO's weekly chart as at Jan 7, 2019 (Source: Investing.com)

After the sharp rally in US markets last Friday, many investors are asking whether the worst is over for the US markets. Looking at the 3 charts below, we can see that it will be a while before the US markets can recommence on their uptrend again. At best, the US markets will consolidate for the next few months- probably trading in a sideways manner. JPMorgan believes the US market is poised for a blistering rally due to the increased pension funds buying (the smart money) coupled with the contrarian signal of large mutual fund outflow (the dumb money). If US markets stabilized, investors in Malaysia will be able to invest with greater confidence.


Chart 5: DJIA's daily chart as at Jan 4, 2019 (Source: Stockcharts.com)


Chart 6: Nasdaq's daily chart as at Jan 4, 2019 (Source: Stockcharts.com)


Chart 7: S&P500's daily chart as at Jan 4, 2019 (Source: Stockcharts.com)

Based on the above and my earlier piece on the likelihood of a return of the CNY rally, I think this is a good time to accumulate some stocks in the market.

Inari: Knocked Down by News of Lower iPhone Sales in China

Background

Inari Amerton Bhd ("Inari") is involved in the outsourced semiconductor assembly and test services and electronics manufacturing services. It is well-known as one of the suppliers to Apple for the manufacture of its iPhones. 

Recent Business News

Apple recently revealed that it anticipates revenue to come in below expectations. Apple expects revenue of $84 billion in the first quarter - a 5%-decline from the low-end of its previously stated range of $89 billion to $93 billion (here). This will impact Inari as Apple is its major customer.

Recent Financial Performance

Its latest result was for QE30/9/2018, which was released in November 26, 2018. For that quarter, Inari's net profit rose 5.3% q-o-q but dropped 12.0% y-o-y to RM60.2 million while revenue was mixed- up 8.2% q-o-q but down 12.7% y-o-y to RM326 million. Its revenue dropped y-o-y due to lower volume loading. PBT dropped 11.9% y-o-y mainly due to the foreign  exchange fluctuation during the current quarter.


Table: Inari's last 8 quarterly results


Graph: Inari's last 32 quarterly results

Financial Position

As at 30/9/2018, Inari's financial position is deemed very healthy with good current ratio at 3.4x while gearing ratio improved to 0.3x.

Valuation

Inari (closed at RM1.23 last Friday) is now trading at a PER of 16 times (based on last 4 quarters' EPS of 7.7 sen). At this PER, Inari is deemed fairly attractive.

Technical Outlook

Inari has broken below its long-term uptrend line, SS at RM1.50 last week. Its immediate support will be at horizontal line at RM1.10 and then the psychological level of RM1.00.


Chart: Inari's weekly chart as at Jan 4, 2019 (Source: Malaysiastock.biz)

Conclusion

Based on good, albeit weaker financial performance, good financial position and fairly attractive valuation, Inari is a good stock to consider for long-term investment. However its current bearish technical outlook may lead to further price weakness until its near-term financial performance shows clarity after the reported lower sales by Apple.

Note:

I hereby confirm that I do not have any direct interest in the security or securities mentioned in this post. However, I could have an indirect interest in the security or securities mentioned as some of my clients may have an interest in the acquisition or disposal of the aforementioned security or securities. As investor, you should fully research any security before making an investment decision.

Sunday, January 06, 2019

Apollo: Earnings Continued to Rise

Result Update

For QE31/710/2018, Apollo's pre-tax profit rose 20% or 32% y-o-y to RM5.0 million while revenue was mixed- up 8.3% q-o-q but down 10.3% y-o-y to RM47 million. Revenue dropped y-o-y mainly due to decrease in sales orders from local markets. PBT rose y-o-y due to lower operating expenses and higher forex gain in the quarter. (Note: Apollo's latest result was announced on December 27, 2018.)


Table: Apollo's last 8 quarterly results

Apollo's revenue, profits and profit margins have been on a steady decline for the past 3 years. The improvement in the profits and profit margins last 2 quarters may be a sign that improved operational efficiency may be starting to bear result.


Graph: Apollo's last 45 quarterly results

Financial Position

As at 31/10/2018, Apollo's financial position is very healthy with current ratio of 14 times and gearing ratio of 0.09 times. Its cash balance stood at RM113 million or RM1.41 per share.

Valuation

Apollo (closed at RM3.68 last Friday) is now trading at a PE of 23 times (based on last 4 quarters' EPS of 15.88 sen). Excluding the cash balance of RM1.41 per share, Apollo would improve to 14 times. This, plus a dividend yield of 5.4%, make Apolloa a fairly attractive stock.

Technical Outlook

Apollo is now resting n the accelerated uptrend line, S1-S1 at RM3.60.


Chart: Apollo's monthly chart as at Jan 4, 2019 (Source: Malaysiastock.biz) 

Conclusion

Based on improved financial performance, strong financial position, attractive valuation & mildly bullish technical outlook, Apollo is a very good stock to consider for long-term investment.

Note:

I hereby confirm that I do not have any direct interest in the security or securities mentioned in this post. However, I could have an indirect interest in the security or securities mentioned as some of my clients may have an interest in the acquisition or disposal of the aforementioned security or securities. As investor, you should fully research any security before making an investment decision.
SKPRES: A Good Value Buy

Result Update

In QE30/9/2018, SKPRES's net profit rose by 9.2% q-o-q but declined by 19.9% y-o-y to RM28.1 million. Its revenue rose by 10.9% q-o-q but declined by 19.7% y-o-y to RM477 million. Its profit before taxation also increased by 9.4% from RM33.5 million to RM36.6 million as a result of higher sales during this quarter. (Note: The result for QE30/9/2018 was released on November 29, 2018.)


Table: SKPRES's last 8 quarterly results


Graph: SKPRES's last 42 quarterly results

Financial Position

As at 30/9/2018, SKPRES's financial position is deemed very healthy with good current ratio at 2.3x while gearing ratio improved to 0.5x.

Valuation

SKPRES (closed at RM1.03 last Friday) is now trading at a PER of 11.3 times (based on last 4 quarters' EPS of 9.1 sen). At this PER, SKPRES is deemed very attractive after a decline of 55% from its peak of RM2.30 in February 2018.

Technical Outlook

SKPRES has broken below its long-term uptrend line, SS at RM1.40 in June 2018. Despite a strong rebounce that sent the share price above the uptrend line again in July 2018, the stock failed to stay above the uptrend line. It is now resting on the strong support from the horizontal line at RM1.00.


Chart: SKPRES's weekly chart as at Jan 4, 2019 (Source: Malaysiastock.biz)

Conclusion

Based on good, albeit weaker financial performance, good financial position and attractive valuation, SKPRES could be a good stock to consider for long-term investment. while bearish technical outlook may lead to further price weakness, ant but any recovery in earnings can also lead to a quick recovery for a deeply beaten down stock.

Note:

I hereby confirm that I do not have any direct interest in the security or securities mentioned in this post. However, I could have an indirect interest in the security or securities mentioned as some of my clients may have an interest in the acquisition or disposal of the aforementioned security or securities. As investor, you should fully research any security before making an investment decision.