Showing posts with label telecommunication service provider. Show all posts

Tuesday, September 10, 2019

Axiata & Telenor: Merger Deal off


Axiata and Telenor (DIGI's parent company) have just called off their merger deal (here and here). This should bring down the share prices of Axiata & DIGI to the levels just preceding the announcement on 6 May (here and here). If we were to factor in the unwinding of any position built-up after the merger announcement, then the price levels may go down a bit more (say, another 10 sen lower). Thus, if you want to buy into the selldown of Axiata and DIGI, the good price to aim for would be RM3.85-4.00 for Axiata and RM4.30-4.40 for DIGI.


Chart 1: Axiata's daily chart as at Sep 10, 2019_9.15am (Source: Malaysiastock.biz)


Chart 2: DIGI's daily chart as at Sep 10, 2019_9.15am (Source: Malaysiastock.biz)

Wednesday, June 26, 2019

Redtone: Revenue and PBT Continued to Rise

Result Update

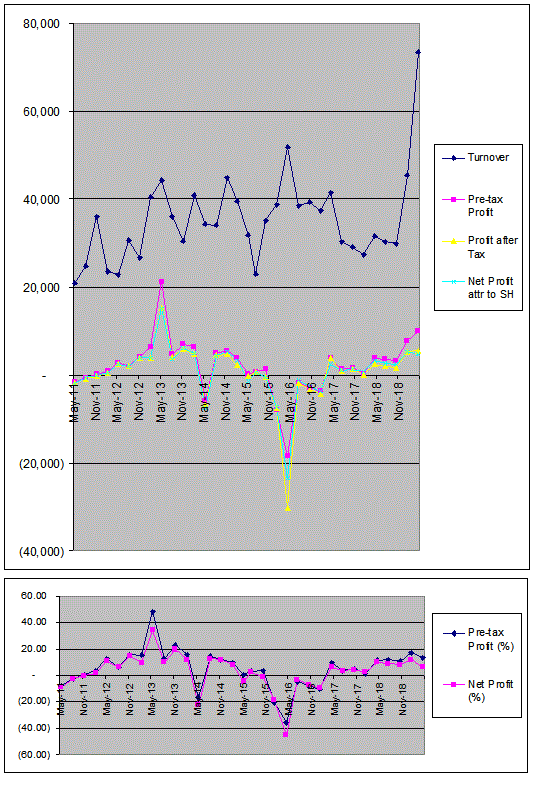
For QE310/4/2019, Redtone's net profit dropped 11% q-o-q but rose 53% y-o-y to RM4.8 million while revenue rose 62% q-o-q or 132% y-o-y to RM73 million. Revenue rose q-o-q mainly due to higher revenue from Managed Telecommunication Network Services ("MTNS") segment.


Table: Redtone's last 8 quarterly results


Graph: Redtone's last 33 quarterly results

Financial Position

As at 30/4/2019, Redtone's financial position is healthy with current ratio at 2.5 times and gearing ratio at 0.5 time.

Valuation

Redtone (closed at RM0.305 yesterday) is now trading at a trailing PE of 15 times (based on last 4 quarters' EPS of 2.01 sen).  At this PE, Redtone is still deemed attractive for a turnaround stock with room for further growth.

Technical Outlook

Redtone is trying to stay above its long-term downtrend line, RR as well as its intermediate uptrend line, RR- both at RM0.29.


Chart 1: Redtone's weekly chart as at Jun 25, 2019 (Source: Malaysiastock.biz)


Chart 2: Redtone's daily chart as at Jun 25, 2019 (Source: Malaysiastock.biz)

Conclusion

Based on improved financial performance, healthy financial position and mildly bullish technical outlook, Redtone could be a good stock for long-term investment.

Note:

I hereby confirm that I do not have any direct interest in the security or securities mentioned in this post. However, I could have an indirect interest in the security or securities mentioned as some of my clients may have an interest in the acquisition or disposal of the aforementioned security or securities. As investor, you should fully research any security before making an investment decision.

Wednesday, March 20, 2019

Redtone: Higher Earning Due to Higher MTNS Revenue

Result Update

For QE31/1/2019, Redtone's net profit increased by 116% q-o-q or 7-fold to RM5.4 million while revenue rose 52% q-o-q or 66% y-o-y to RM45.4 million. Revenue rose q-o-q due to higher revenue from Managed Telecommunication Network Services ("MTNS") segment. The Group's profit before tax rose q-o-q due to higher revenue in the MTNS segment (see Table 2 below).


Table 1: Redtone's last 8 quarterly results

Table 2: Redtone's segmental results for QE31/1/2019 

From Table 3 below, we can see that MTNS segment is now catching up with the Telecommunication Services segment. If MNTS segment can match the performance of the Telecommunication Services segment, Redtone's bottom-line will be much better than what's it like today.


Table 2: Redtone's 9-mth segmental results 


Graph: Redtone's last 32 quarterly results

Financial Position

As at 31/1/2019, Redtone's financial position is healthy with current ratio at 2.5 times and gearing ratio at 0.4 time.

Valuation

Redtone (closed at RM0.26 yesterday) is now trading at a trailing PE of 14 times (based on last 4 quarters' EPS of 1.79 sen).  At this PE, Redtone is still deemed attractive for a turnaround stock with room for further growth.

Technical Outlook

Redtone has broken above its downtrend line at RM0.24 on March 13. If it can also take out the immediate downtrend line, RR with resistance is at RM0.32-0.33, Redtone's uptrend may begin.


Chart: Redtone's weekly chart as at Mar 19, 2019 (Source: Malaysiastock.biz)

Conclusion

Based on the turnaround story, exciting future prospects, healthy financial position and mildly bullish technical outlook, Redtone could be a good stock for long-term investment.

Note:

I hereby confirm that I do not have any direct interest in the security or securities mentioned in this post. However, I could have an indirect interest in the security or securities mentioned as some of my clients may have an interest in the acquisition or disposal of the aforementioned security or securities. As investor, you should fully research any security before making an investment decision.

Thursday, March 14, 2019

Timecom: Uptrend Resumed

Timecom has been valued at around RM10.00 by BIMB Securities and Hong Leong Investment Bank (here and here). When it was trading at around RM7.50-8.00 in the second half of 2018, I have been keeping an eye on the stock. 

Chart 1: Timecom's weekly chart as at Mar 13, 2019 (Source: Malaysiastock.biz)

On March 4, it broke above the horizontal line at RM8.50, and consolidated around that price level for the next 3-4 days. On March 8, it began rising cautiously. Today it surpassed the intraday high of RM8.66 recorded on Mar 4, and closed at RM8.70.

Chart 2: Timecom's daily chart as at Mar 13, 2019 (Source: Malaysiastock.biz)

Based on the technical analysis, Timecom is poised to continue with its prior uptrend.

Wednesday, December 05, 2018

TM: A Bullish Breakout

TM broke above its downtrend line, RR at RM2.35 on November 29. After that breakout, TM remained at that price level for 2 days. Yesterday, TM broke above the horizontal line at RM2.47 as well as the psychological RM2.50 mark.

With these breakouts, TM is likely to begin its recovery provided it does not drop back below RM2.47-2.50. Based on technical consideration, TM could be a good stock for a recovery play. If you choose to get into the stock now, please exercise careful discretion in view of current market weakness.
.

Chart: TM's daily chart as at Dec 4, 2018 (Source: Malaysiastock.biz)

Note:

I hereby confirm that I do not have any direct interest in the security or securities mentioned in this post. However, I could have an indirect interest in the security or securities mentioned as some of my clients may have an interest in the acquisition or disposal of the aforementioned security or securities. As investor, you should fully research any security before making an investment decision.

Tuesday, September 05, 2017

Axiata: Earning Rebounded

Background

Axiata Group Berhad (“Axiata”) provides various telecommunications products and services in Asia. It has controlling interests in six mobile operators under the brand names of ‘Celcom’ in Malaysia, ‘XL’ in Indonesia, ‘Dialog’ in Sri Lanka, ‘Robi’ in Bangladesh, ‘Smart’ in Cambodia and ‘Ncell’ in Nepal, with strategic interests in ‘Idea’ in India and ‘M1’ in Singapore. The Group has an infrastructure company, ‘edotco’, which operates in five countries to deliver telecommunications infrastructure services, and operates and manages a regional portfolio of over 25,000 towers. For more information on the group, go here.  

Historical Financial Performance

Axiata’s top-line has been on a steady uptrend over the past 10 years. However its bottom-line suffered a decline in the past 5 quarters, with net profit below RM400 million from QE31/3/2016 to QE31/3/2017. It even incurred a net loss of RM309 million in QE31/12/2016. The reasons for the decline in profit (and loss) for these 5 quarters are:
  • amortisation of intangibles assets arising from acquisition of Nepal operation
  • accelerated depreciation in Indonesia & Bangadesh
  • foreign exchange losses
  • higher net finance costs
In QE30/6/2017, Axiata net profit climbed back above the RM400 million. This may mark the beginning of its earning recovery.

Graph: Axiata’s last 42 quarters revenue & profits

Recent Financial Result

Axiata announced its latest quarterly result for QE30/6/2017 last week. Its net profit rose 70% q-o-q or 116% y-o-y to RM407 million while revenue rose 3% q-o-q or 14% y-o-y to RM6.06 billion. The q-o-q improvement in profit was due to improved performance in all major operating companies with the exception of the Cambodian operation. Improved revenue and effective cost management resulted in EBITDA growth by 5.6%. For the quarter, share of results from associates and joint ventures declined by more than 100% mainly as a result of the investment in India. India continues to face intense market aggression arising from the new entrant in the Indian market. PAT improved by 82.8% and PATAMI increased by 70.4% to RM407.2 million contributed mainly by the improved quarter performance by all major operations.

Table: Axiata’s last 8 quarters’ P&L

Latest Financial Position

Axiata’s financial position is relatively weak as at 30/6/2017, with current ratio at 0.66x and total liabilities to total equity at 1.25x. The weak financial position - due to over-expansion - need to be rectified by either capital-raising or partial disposal of its stakes in some of the operating units (such as its tower asset company).

Valuation

Axiata (closed at RM4.93 on August 30, 2017) is now trading at a trailing PER of 75x (based on last 4 quarters’ EPS of 6.6 sen). At this PER, the stock is over-valued. However Axiata may be on the path of recovery. If its net profit can climb back to RM600 million a quarter, its full-year EPS would be about 28 sen - bringing down its PER to 18x. At a PER of less than 20x, Axiata will again be an attractive telco stock.

Technical Outlook

Axiata broke its long-term uptrend in 2015 when its share price went below its 30-month EMA line. Since then, Axiata has been on a downtrend.  

Chart 1: Axiata’s monthly chart as at August 30, 2017 (Source: Shareinvestor.com)

If Axiata can surpass the intermediate downtrend line, RR at RM5.30, the share price recovery may begin.

Chart 2: Axiata’s weekly chart as at August 30, 2017 (Source: Malaysiastock.biz)

Conclusion

Axiata could be a good stock for a recovery play based on tentative sign of earning recovery. It is a home-grown multi-national company with good management, steady revenue growth and, until recently, long track record for profitable operation. However the stock is not cheap as its earning had declined sharply over the past 5 quarters. With earning recovery beckons, Axiata could be a good stock to consider for long-term investment. 

Note:
I hereby confirm that I do not have any direct interest in the security or securities mentioned in this post. However, I could have an indirect interest in the security or securities mentioned as some of my clients may have an interest in the acquisition or disposal of the aforementioned security or securities. As investor, you should fully research any security before making an investment decision.

Thursday, February 23, 2017

Axiata: In The Red Thanks To Forex Losses

Result Update

For QE31/12/2016, Axiata reported a net loss of RM309 million while revenue rose 6% q-o-q or 8% y-o-y to RM5.79 billion. Revenue increased q-o-q with all the segments registered positive growth. For the period, operating costs increased by 13.2% q-o-q to RM3,809.9 million mainly arising from higher operation cost in Indonesia, Bangladesh and Sri Lanka. As a result, EBITDA margin decreased by 4.1 percentage points to 34.0%. The Group reported an after tax loss of RM272.1 million arising from higher depreciation and amortization due to network modernization in Indonesia and Bangladesh, net finance cost, foreign translation losses and share of losses from associates and joint ventures.  The foreign exchange (forex) losses amounted to RM685 million at PAT level, was mainly due to the USD exposed debt incurred from the acquisition of Ncell.


Table; Axiata's last 8 quarters' P&L

From the 10-year P&L record, Axiata had reported losses in 2 other quarters: December 2008 & December 2010. In December 2008, Axiata (then TMI) incurred a loss after tax of RM613.5 million “mainly driven by exchange loss in the quarter of RM472.3 million which was mainly derived from XL” which resulted from “the strengthening of USD against IDR, RM and other local currencies”. It was also compounded by “negative contribution from Dialog and share of loss from jointly controlled entities”. 

In December 2010, Axiata recorded loss after tax of RM260.8 million mainly due to the impairment on the investment in an associate. The total impairment was RM1,085.0 million and it as for its investment in Idea Cellular Limited (“Idea”) in conjunction with the impairment assessment requirement under FRS 136 “Impairment Of Assets”. The impairment test was undertaken following an impairment indicator arising from the shortfall between the carrying value and market value of the Group’s investment in India as well as intense competition following the entry of a number of new operators into the Indian market.
From these earlier loss events, we can take it that Axiata is likely to bound back. This is part and parcel of operating in an international environment.


Graph: Axiata's last 40 quarters' P&L

Valuation

Axiata (closed at RM4.53 today) is now trading at a PER of 79x (based on last 4 quarters' adjusted EPS of 5.7 sen). This is not a meaningful guide. A better matrix to look at is the Price to Book ratio of the stock today as compared to the last 2 occasions when it made a loss. This is given below:

I think Axiata is fairly priced compared to its book value or NTA p.s.
  
Technical Outlook

Axiata is in a downtrend line, RR. Its immediate support will come from the horizontal line at RM4.45 & then the recent low at RM4.10.


Chart 1: Axiata's weekly chart as at Feb 23, 2017_15.00  (Source: MalaysiaStock.Biz)
 

Chart 2: Axiata's monthly chart as at Feb 23, 2017_15.00  (Source: MalaysiaStock.Biz)
 
Conclusion

As I believe Axiata can recover in the next 1-2 quarter(s), I rate it as a HOLD or a contrarian BUY if it drops to RM4.00-4.20.

Note:
I hereby confirm that I do not have any direct interest in the security or securities mentioned in this post. However, I could have an indirect interest in the security or securities mentioned as some of my clients may have an interest in the acquisition or disposal of the aforementioned security or securities. As investor, you should fully research any security before making an investment decision.

Monday, February 06, 2017

DIGI: Uptrend Poised To Continue (UPDATE)

Last Thursday, DIGI’s broke above its intermediate downtrend line (rr) at RM4.95. The following day, it broke above the psychological RM5.00 mark. This morning, it tested its Sep 13, 2016 high of RM5.11. I rate the RM5.11 as a resistance event where the stock may correct and pullback toward the support from its psychological RM5.00 mark.  

(Note: The chart below is adjusted for dividend payment. As a result, the September 2016 high is not reflected as RM5.11 but as RM5.06. I believe the RM5.11 will still pose some resistance for the current breakout.) 

Chart 1: DIGI's daikly chart as at Feb 6, 2017_11.30 (Source: MalaysiaStock.Biz)

Quick Update

On Jan 23, DIGI announced its result for QE31/12/2016 where its net profit dropped 2% y-o-y to RM375 million while revenue dropped 3% y-o-y to RM1.67 billion. Compared to the results with the immediate preceding quarter (QE30/9/2016), its revenue increased marginally q-o-q due to solid postpaid growth momentum and stronger internet adoption which offset weaker prepaid business. However EBITDA & PBT dropped q-o-q after accounting for associated cost for the higher device sales; increased marketing cost in supporting subscriber acquisition; and progressive network expansion cost. Nevertheless EBITDA margin remained robust at 44% following strong operational efficiency discipline and well-managed cost structure. For more, check out my recent post.

Despite the relatively high valuation, I have kept DIGI’s rating as a HOLD based on improved performance over the past few quarters (albeit weaker one in QE31/12/2016), decent dividend yield and mildly positive technical outlook.


Chart 2: DIGI's weekly chart as at Feb 6, 2017_11.30 (Source: MalaysiaStock.Biz)


The last time, DIGI broke above its intermediate downtrend and followed up with an upside breakout of the ensuing sideways trading range was in early 2014. In that rally, DIGI rose from the breakout point of RM4.20 to a high of RM6.00- giving investors a return of 42% over a 1-year period. If the current breakout leads to a similar rally, we might see DIGI making a high of RM7.00.

Conclusion

Based on the current technical breakout, I believe that DIGI could be a good trading BUY.

Note:
I hereby confirm that I do not have any direct interest in the security or securities mentioned in this post. However, I could have an indirect interest in the security or securities mentioned as some of my clients may have an interest in the acquisition or disposal of the aforementioned security or securities. As investor, you should fully research any security before making an investment decision.

Tuesday, January 24, 2017

DIGI: Lower Profits On Better Revenue

Result Update

For QE31/12/2016, DIGI's net profit dropped 14.5% q-o-q or 2% y-o-y to RM375 million while revenue was mixed - up 3% q-o-q but down 3% y-o-y to RM1.67 billion. Revenue rose marginally q-o-q due to solid postpaid growth momentum and stronger internet adoption which offset weaker prepaid business. While EBITDA & PBT dropped q-o-q after accounting for associated cost for the higher device sales, increased marketing cost in supporting subscriber acquisition and progressive network expansion cost. Nevertheless EBITDA margin remained robust at 44% following strong operational efficiency discipline and well-managed cost structure.


Table: DIGI's last 8 quarterly results

Despite the decline in profits and profit margins last quarter - the fourth quarter is normally a weaker quarter - we can see the net profit number was not too far from the RM400 million mark.


Graph: DIGI's last 39 quarterly results

Valuation

DIGI (closed at RM4.92 yesterday) is now trading at a trailing PER of 23 times (based on last 4 quarters' EPS of 21.0 sen). DIGI's high PER is somewhat mitigated by decent dividend yield of 4.2%.

Technical Outlook

DIGI broke above its intermediate downtrend line at RM4.90 in August last year. Since then, it had traded sideways between RM4.80 & RM5.00. The last time it traded sideways after a breakout of a downtrend line was from September 2013 to February 2014 - between RM4.00 & RM4.30. After it broke to the upside of that range, it rallied all the way to RM6.00-6.20. (Note: DIGI actually broke down in January 2014 before it broke up!) 

 
Chart 1: Digi's weekly chart as at Jan 23, 2017 (Source: MalaysiaStock.Biz)


Chart 2: Digi's monthly chart as at Jan 23, 2017 (Source: MalaysiaStock.Biz)

Conclusion

Despite the relatively high PER, Digi is rated a HOLD based on improved performance over the past few quarters (albeit weaker one in QE31/12/2016), decent dividend yield and mildly positive technical outlook. 

Note:
I hereby confirm that I do not have any direct interest in the security or securities mentioned in this post. However, I could have an indirect interest in the security or securities mentioned as some of my clients may have an interest in the acquisition or disposal of the aforementioned security or securities. As investor, you should fully research any security before making an investment decision.
Wednesday, December 07, 2016

Axiata: Coping With Labour Pain?

Result Update

For QE30/9/2016, Axiata's net profit rose 36% q-o-q but dropped 71% y-o-y to RM257 million while revenue rose 3% q-o-q or 8% y-o-y to RM5.46 billion.


Table 1: Axiata's last 8 quarters' P&L

If you looked at the profits of Axiata, you will see 2 trends; firstly, Axiata has taken quite a beating over the past 3 quarters, only to stabilize in QE30/9/2016. The improved q-o-q result was attributed to "steady operational performance, particularly from the Group’s South Asia Operating Companies (OpCos) namely Ncell1, Dialog and Robi" plus "lower Depreciation and Amortisation (D&A) and net finance cost, as well as lower forex losses".


Graph 1: Axiata's last 39 quarters' P&L

The second trend is that its profits have been flattish for a long period (FY2011-2014) despite rising Operating Revenue. This is due to 3 rising expense items, namely Depreciation, Impairment & Staff Costs; and Other Costs. These 3 rising items have more than offset the decline in Domestic Inconnect & International Overpayment- leading to a stagnant bottom-line. (See the table & graph below, which show 5 years' of the first 9 months results.) In my opinion, the reason for these rising expenses is due to the expansion in some of the developing markets that Axiata group is operating in. When these operations reached their critical mass, the profit should begin to roll in. This is a case of labour pain- pain today and joy tomorrow!
 

Table 2: Axiata's last 5 years' first 9 months' P&L
 

Graph 2: Axiata's last 5 years' first 9 quarters' P&L

Valuation

Axiata (closed at RM4.30 yesterday) is now trading at a PER of 30x (based on last 4 quarters' adjusted EPS of 14.50 sen). This makes Axiata less attractive compared to MAxis or Digi which have a PER of about 22-23x. But things may change...
   
Technical Outlook

Axiata is deeply oversold, with potential relief rally insight. In fact, its MACD has crossed above its MACD signal line- thus predicting a possible rebound. This rebound will face immediate resistance at the horizontal line at RM4.50 and beyond that at the next horizontal line at RM5.00. If the relief rally fizzled out, it may retest its recent low. If the test of the low is successful, we may then see a recovery for this stock.


Chart 1 Axiata's daily chart as at Dec 7, 2016_10.45 (Source: ShareInvestor)


Chart 2: Axiata's weekly chart as at Dec 7, 2016_10.45 (Source: ShareInvestor)
 

Chart 3 Axiata's monthly chart as at Dec 7, 2016_10.45 (Source: ShareInvestor)
 
Conclusion

Based on technical consideration, Axiata could be a good stock to consider for a recovery play. However, it should be noted that its valuation is not attractive as its earning has buffeted by rising costs in growing its many operating units. There is only tentative signs of a bottom - no sign of recovery yet - thus warranting only a very small exposure at best to this stock. Good luck!

Note:
I hereby confirm that I do not have any direct interest in the security or securities mentioned in this post. However, I could have an indirect interest in the security or securities mentioned as some of my clients may have an interest in the acquisition or disposal of the aforementioned security or securities. As investor, you should fully research any security before making an investment decision.

Tuesday, July 12, 2016

DIGI: Earnings Recovering

Result Update

For QE30/6/2016, Digi's net profit rose 5% q-o-q but dropped 9% y-o-y to RM421 million while revenue was unchanged q-o-q but down 4% y-o-y to RM1.655 billion. Revenue dropped marginally y-o-y due to intense competition. PBT improved q-o-q due to lower depreciation in current quarter as compared to accelerated depreciation booked in the last 2 quarters.


Table: Digi's last 8 quarterly results

We can see that profits and profit margins are starting to recover!


Chart 1: Digi's last 35 quarterly results

Valuation

Digi (closed at RM4.75 yesterday) is now trading at a trailing PE of 23 times (based on last 4 quarters' EPS of 20.56 sen). In the absence of earnings growth, DIGI's high PER is hard to justify. The only consolation is its decent dividend yield of 4.3%.

Technical Outlook

DIGI is in an intermediate downtrend line, RR since it peaked at RM6.50 in February 2015. The resistance from the downtrend line is at RM4.80. Until it can break above this mark, DIGI is likely to remain in downtrend. However, this downtrend is not likely to exceed the April low as the earnings of the company is recovering.

 
Chart 2: Digi's weekly chart as at Jul 11, 2016 (Source: Shareinvestor.com Tradesignum)

Nevertheless, Digi is in a long-term uptrend line with support at  RM4.30 In April.


Chart 3: Digi's monthly chart as at Jul 11, 2016 Feb 6, 2014 (Source: Shareinvestor.com Tradesignum)

Conclusion

Based on unattractive valuation & mildly negative short-term technical outlook, Digi is rated a HOLD.

Note: 
In addition to the disclaimer in the preamble to my blog, I hereby confirm that I do not have any relevant interest in, or any interest in the acquisition or disposal of, Digi.

Monday, April 04, 2016

OCK: A Regional Telecommunication Play

Background

OCK Group Bhd (OCK) is principally involved in the provision of telecommunications network services and generation & sales of renewable energy. For more on the group's business activities, go here.

Recent Business Development

OCK, together with its Myanmar partner, King Royal Technologies Co Ltd has entered into a master services agreement (MSA) with Telenor Myanmar Ltd to build 920 telecommunications towers for Telenor in Myanmar in a long-term “build and lease” model. OCK will invest US$75 million (RM324.4 million) on this project which will be delivered in 2016.

Historical Financial Performance

OCK's top-line and bottom-line, which have been on a gradual rise, jumped in QE31/12/2015. In that quarter, revenue increased to RM108.4 million from RM83.7 million recorded in QE30/9/2015 mainly due to continual growth in revenue from telecommunication network services in the quarter of under review. This consists of contribution from the fibre works, distribution of telecommunication equipment and completion of more projects in Malaysia. In addition to that, there were higher contribution from its regional business in Indonesia, Cambodia, Myanmar and China. Collectively, these offset the drop in delivery of power solution equipment in the current quarter due to the uncertainty of the currency costs.

As a result of the higher Group revenue, Group PBT rose to RM17.4 from RM8.8 million in the preceding quarter. In addition to that, the Group also recognised an unrealised gain on revaluation of certain of its investment properties amounted to RM4.69 million.


Table: OCK's last 15 quarterly results


Chart 1: OCK's last 15 quarterly results

Financial Position

As at 31/12/2015, ICK's financial position is deemed satisfactory. Current ratio stood at 3.4X while total liabilities to equity stood at 0.6X. Cash & bank balances amounted to RM163 million, thanks to a Rights Issue of 1-for-2 completed in November.

Valuation

OCK (closed at RM0.77 last Friday) is now trading at a PER of 18X (based on last 4 quarters' EPS of 4.24 sen). This is considered fair for a high growth company. Ignoring the fair value adjustment in QE31/12/2015, OCK's EPS CAGR for past 2 years average about 24%. This gives the stock a PEG ratio of 0.75X.

Changes in Shareholdings

Despite attractive valuation, we note that the main shareholder. Sam Ooi sold some shares in OCK in March at RM0.825 (here). He may feel that this is a fair value for the stock for the near term.

Technical Outlook

OCK is in a long-term uptrend line (in blue). This uptrend is capped by an intermediate downtrend line (in red). OCK broke above the intermediate downtrend line 3 weeks ago. The stock is pulling back to the breakout level at RM0.75-0.77. If the share price does not go below this level, it may continue its prior uptrend.


Chart 2: OCK's weekly chart as at Apr 1, 2016 (Source: ShareInvestor.com)

Conclusion

Based on good financial performance, reasonable valuation and bullish t3echncial outlook, OCK is a good stock for a trading BUY or even a long-term investment.

Note:
In addition to the disclaimer in the preamble to my blog, I hereby confirm that I do not have any relevant interest in, or any interest in the acquisition or disposal of, OCK.

Friday, January 29, 2016

Telcos hit by hefty bill to retain their spectrum

As reported in the Star newspaper, the government has announced that it will optimise the revenue from telecommunication spectrum through a redistribution and bidding process that will be implemented soon. This was announced under the revised Budget 2016.

According to a CIMB report, if "the MCMC uses the same reserve price benchmark (as per the recent Thai auctions), the minimum Maxis, Celcom and DiGi would have to pay to retain their 900MHz and 1800MHz spectrum are RM2.37bn, RM2.43bn and RM1.46bn, respectively. This would shave off 4.7% of our target price for Maxis, 4.2% for Axiata and 3.8% for DiGi."

The reaction from the market was swift. All three stocks dropped substantially this morning. Both Maxis and Axiata broke their strong horizontal support at RM6.20 & RM5.60 respectively. Digi dropped less and may find support at its horizontal line at RM4.60. As the current prices are still above the revised fair prices for all three counters (as per CIMB's report), it is best to avoid these stocks for now.

Chart 1; Axiata's monthly chart as at Jan 29, 2016_10.45am (Source: ShareInvestor)


Chart 2: Maxis's monthly chart as at Jan 29, 2016_10.45am (Source: ShareInvestor)


Chart 3: Digi's monthly chart as at Jan 29, 2016_10.45am (Source: ShareInvestor)

Note:
In addition to the disclaimer in the preamble to my blog, I hereby confirm that I do not have any relevant interest in, or any interest in the acquisition or disposal of, Axiata, Digi & Axiata.