Thursday, August 20, 2020

MFCB: Earnings Continued to Rise

Result Update

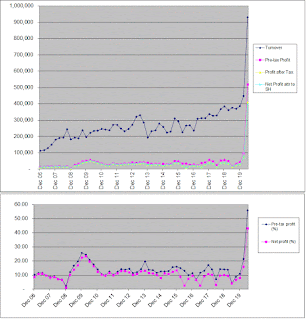
For QE30/6/2020 (2Q2020). MFCB's net profit rose 41.7% q-o-q or 266.1% y-o-y to RM81.3 million while revenue rose 12.8% q-o-q or 14.0% y-o-y to RM181.3 million. Revenue rose 14.0% y-o-y mainly due to RM130.4 million energy sales revenue (2Q2019: Nil) and higher contribution from Packaging & Labels Division (up 31.0% to RM21.6 million), partially offset by the absence of construction revenue (2Q2019: RM100.2 million) and lower sales reported by the Resources Division on Covid-19 impact (down 30.4% to RM26.6 million). 

Pre-tax profit jumped 224% y-o-y underpinned by a RM93.7 million pre-tax profit from energy sales (2Q2019: RM0.6 million loss) and RM1.7 million contribution from the Packaging & Labels Division (2Q2019: RM0.3 million loss), which more than offset the absence of construction profit in the current quarter (2Q2019: RM26.9 million) and lower profit contribution from the Resources Division.

Profit after tax surged 289% to RM95.3 million (2Q2019: RM24.0 million) on 224% increase in pre-tax profit and lower effective income tax rate. Income from energy sale in Laos is exempted from income tax in its first five years of commercial operations, whereas in 2Q2019, a 20% deferred tax was provided for construction profit during the construction period of the Don Sahong.

  
Table: MFCB's last 8 quarterly results

 
Graph: MFCB's last 28 quarters' P&L  

Financial Position

As at 30 June 2020, MFCB's financial position is weak with current ratio at 0.40 time and total liabilities to total equity at 0.54 time. The extremely low current ratio is a serious concern as the group used short-term borrowings to finance its non-current assets- the bulk of which is likely to be the cost of constructing the 260 MW Don Sahong hydropower project in Laos. 

Valuation

MFCB (closed at RM7.04 yesterday) is now trading at a trailing PER of 12.4x (based on last 4 quarters' EPS of 56.75 sen). At this PER, the stock is deemed fairly valued.

Technical Outlook

MFCB has fully recovered from its sharp selldown in March, which saw the share price plunged to RM3.10. It made an all-time high of RM7.18 in early May and another all-time high of RM7.35 in early August.

 
 Chart: MFCB's weekly chart as at August 19, 2020 (Source: Malaysiastock.biz) 

Conclusion

Albeit its weak financial position, MFCB is a good stock for long-term investment based on good financial performance, fair valuation and positive technical outlook.

Note:

I hereby confirm that I do not have any direct interest in the security or securities mentioned in this post. However, I could have an indirect interest in the security or securities mentioned as some of my clients may have an interest in the acquisition or disposal of the aforementioned security or securities. As investor, you should fully research any security before making an investment decision.

Wednesday, August 19, 2020

PMETAL: BENEFITING FROM ALUMINUM PRICE RECOVERY

Results Update

For QE30/6/2020, PMetal's net profit declined by 12% q-o-q or 12% y-o-y to RM90 million while revenue declined by 5% q-o-q or 19% y-o-y to RM1.73 billion.  Profits dropped y-o-y mainly due to the weakening of aluminium price during the current year quarter under review as Covid-19 became a pandemic. In addition, operations at our extrusion and wire rods plants were halted from 18 March 2020 following the nationwide Movement Control Order (MCO). Both plants have since resumed operations by stages from mid-May 2020.


Table: PMetal's last 8 quarterly results


Graph: PMetal's 51 quarterly results

Financial Position

As at 30/6/2020, PMetal's financial position is deemed manageable with current ratio at 1.45 times and total liabilities to total equity at 1.53 times.

Business Expansion

PMetal's new Samalaju Phase 3 is expected to begin operation in early 2021. This will increase PMetals' installed capacity by 42% to 1.08 million MT. 

Aluminum Outlook

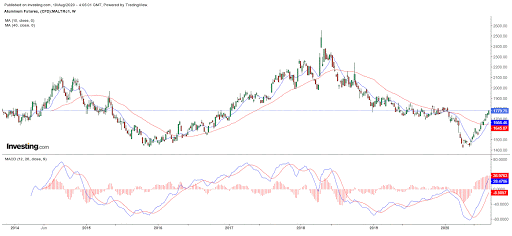
Aluminum prices have recovered substantially from its low of USD1450 in May to the current price of USD1780. Aluminum prices have shown a tendency to move in steady trend more than 1 year, and the trend has in the past begun with 10-week SMA line cut above/below the 40-week SMA line as well as the MACD going above/below the zero line. In the last 1-2 weeks, we saw aluminum price exhibiting positive signals, which could be the start of a bullish price trend. 


Chart 1: Aluminium's weekly chart from 2014 to 18 Aug 2020 (Source: Investing.com)

Valuation

PMetal (closed at RM5.04 at end of morning session today) is now trading at a PER of 46 times (based on last 4 quarters' EPS of 11.04 sen). Based on this PER, PMetal is deemed fully valued.

Technical Outlook

PMetal has been drifting lower for the past 2.5 years. A downtrend line, SS can be drawn which has capped the upward movement of the share price. If PMetal can break above the downtrend line at RM5.05-5.10, the share price may go into an uptrend. 


Chart 2: PMetal's weekly chart as at Aug 19, 2020 (Source: Malaysiastock.biz)

I've appended below PMetal share price chart above the aluminum price chart to show the close correlation below the 2 price charts.


Chart 3: PMetal and aluminum's weekly chart from 2014 to August 2020 

Conclusion

Despite the weaker financial performance, full valuation and mildly bearish technical outlook, PMetal is a stock worth considering for long-term investment if aluminum prices were to continue to go higher.  

Note:

I hereby confirm that I do not have any direct interest in the security or securities mentioned in this post. However, I could have an indirect interest in the security or securities mentioned as some of my clients may have an interest in the acquisition or disposal of the aforementioned security or securities. As investor, you should fully research any security before making an investment decision.

Monday, August 17, 2020

Market Outlook as at 17 August 2020

FBMKLCI has been consolidating since the beginning of August. If we drew a line connecting the low from end March (not mid-March) to date, we can see that this line, SS should provide support to the index at 1545. With both MACD and Directional Movement indicators showing negative reading, the index is not expected to stage a strong rebound from the "uptrend" line, SS in the near term. 

Chart 1: FBMKLCI's daily chart as at 14 Aug 2020 (Source: Malaysiastock.biz)

As noted in the recent market outlook post, our market is driven by 3 big theme plays. The first one is the play or rally on health care stocks (or, more specifically, glove stocks). From Chart 2 below, we can see that this index is likely to correct for a while since its MACD has hooked down.

Chart 2: Health Care Index's daily chart as at 14 Aug 2020 (Source: Malaysiastock.biz)

The second driver is technology stocks. This sector has also hooked down- even attempted to test its "uptrend line" on 12 August. Like health care index, the technology index is expected to remain weak after its MACD has hooked down.

Chart 3: Technology Index's daily chart as at 14 Aug 2020 (Source: Malaysiastock.biz)

The third driver is the droves of retail players getting into the market, probably driven by FOMO or fear of missing out. Many of the latecomers tend to zero in on the cheap stocks, and if we were to extract the total volume from the Top 35 Volume Stocks from 6 August to date, we would get an indication of how much of an impact this buying had on the market. I have tabulated and also plotted a graph of this below. 

Table: Volume of Top 35 Volume Stocks compared to Overall Market Volume from Aug 6 to 14

Graph: Volume of Top 35 Volume Stocks compared to Overall Market Volume from Aug 6 to 14

Since the high volume stocks are generally 3rd liner and fledgling stocks (trading at less than 10 sen each), we can assume that the volume traded represents retail participation. They accounted for a whopping 60-64% of overall market volume on the 2 biggest volume dates in our market to date, i.e. 7 & 11 August. Since then, the volume of the top 35 highest volume stocks had receded. If retail participation stays low, then the market will likely to remain weak for a while.

Based on the above, we should remain cautious and wait out the market correction before taking more aggressive action. Good luck.

Tuesday, August 11, 2020

Supermx: Soaring like an Eagle


Result Update

For QE30/6/2020, Supermx's net profit rose more than 3-fold q-o-q or more than 24 times y-o-y to RM400 million while revenue rose 108% q-o-q or 147% y-o-y to RM929 million. In the notes to the Financial Statement, the company explained its spectacular y-o-y performance in these words:

Supermax achieved its best ever quarterly financial performance in its history. Revenue soared to RM929.1 million, which was 147.1% or RM553.2 million higher compared to the corresponding Quarter a year ago. Profitability rose sharply with EBITDA, PBT and PAT margins at its highest ever and industry leading levels of 60.4%, 55.9% and 43.9% respectively. The Group‟s performance was mainly due to: 
a) An exponential rise in demand for Medical Gloves & other PPEs on the back of the Covid19 pandemic. 
b) Increase in additional production capacity from the newly commissioned lines at plant # 12 block A lines. 
c) Increase in average selling prices (ASPs) each month started in March, 2020 for both its Manufacturing and Distribution divisions. 
d) Increase in percentage of the Group‟s capacity & Global Sales to end-users; including sales to governments and government agencies of various countries where Supermax Group operates and in over 165 countries.
e) Proven business model through Own Brand Manufacturing (OBM) with 2-streams of income via Manufacturing & Distribution.

Amen!

Table : Supermx's last 8 quarters' P&L

Graph: Supermx's last 55 quarters' P&L

Financial Position

Supermx's financial position as at 30/6/2020 is very healthy with current ratio at 1.3 times while gearing ratio was at 1.0 time. The company commented generously about its improved financial position as follows:

Supermax‟s already sound financial position has strengthened dramatically, most notably to a net cash position with cash & bank balances amounting to RM1.18 billion as of 30 June 2020 compared to RM173.8 million a year before. The increase is mainly due to customers paying 30%, 40% and 50% deposits in advance to secure supply.

Thanks to the deposits collected to the tune of RM892 million, Supermx was sitting on a huge cashpile of more than a billion ringgit! But bearing in mind, this is customers' money paid upfront.

Outstanding Corporate Exercise

Supermx has declared a 1-for-1 bonus which is pending shareholders' approval at its upcoming EGM on 18 August 2020 (here). Meanwhile the company has proposed a dividend-in-specie of 1 Treasury share for every 45 shares owned after the implementation of the said bonus issue (here).

Valuation

Supermx (closed at RM21.20 yesterday) is now trading at a PER of 53x (based on last 4 quarters' adjusted EPS of 40.20 sen). If we annualized the latest quarterly EPS of 30.58 sen to arrive at a full-year EPS of 122.32 sen, then its PER will be lowered to 17 times. However, I believe to compute PER based on the annualized EPS of 122.32 sen may be too generous if we looked ahead to the normalization of profit due to increased supply of gloves (as a result of increased capacity) as well as lower demand if Covid-19 pandemic were to subside. This will be a tough judgement call for analysts and investors.

Technical Outlook

Supermx share price had rallied sharply from RM2.00 in April to a high of RM23.00 just 3 days ago. Technical speaking, the share price may still go higher in the near term.

Chart: Supermx's daily chart as at Aug 10, 2020 (Source: Malaysiastock.biz)

Conclusion

Based on excellent financial performance & satisfactory financial position, fairly attractive valuation, generous bonus issue ahead and still positive technical outlook, I think Supermx deserved to be rated as a HOLD.

Note:

I hereby confirm that I do not have any direct interest in the security or securities mentioned in this post. However, I could have an indirect interest in the security or securities mentioned as some of my clients may have an interest in the acquisition or disposal of the aforementioned security or securities. As investor, you should fully research any security before making an investment decision.

BPPLAS: Earnings Rose Sharply

Result Update

For QE30/6/2020, BPPLAS's net profit rose 36% q-o-q or 87% y-o-y to RM8.5 million while revenue was mixed- up 3.5% q-o-q but down 7.4% y-o-y to RM80.3 million. 

Operating revenue rose q-o-q due to improved sales demand in 2Q20. A subsidiary of the Group received approval since the beginning of Movement Control Order (MCO), thus able to operate to deliver stronger sales performance because food packaging film, stretch film and customised film products produced by the Group are part of the critically required packaging for Food and other Essential Goods.

The Group recorded a historical high for the unaudited PBT and PAT for the quarter under review of RM11.3 million and RM8.5 million respectively, representing an increase of 36% and 36% compared to unaudited PBT and PAT of RM8.3 million and RM6.2 million respectively in 1Q20. The increase in the unaudited PBT and PAT for the quarter under review were mainly due to better product mix and production efficiencies.

Table: BPPLAS's last 8 quarterly P&L

Graph: BPPLAS's last 26 quarters' P&L

Financial Position

As at 30/6/2020, BPPLAS's financial position is deemed healthy with current ratio and gearing ratio at 4.6 times and 0.2 times. Cash in hand amounted to RM78.8 million or RM0.42 per share.

Valuation

BPPLAS (closed at RM1.40 yesterday) is now trading at a PER of 10 times (based on last 4 quarters' EPS of 14.36 sen). If the cash in hand is deducted from the share price, then BPPLAS's PER will be lowered to 7 times. BPPAS also paid a decent dividend totaling 8 sen last 4 quarters- giving it a dividend yield of 5.7%. Overall, BPPLAS is deemed fairly attractive.

Technical Analysis

BPPLAS has broken above the Downtrend line, RR at RM1.00 in early May. Its immediate support is at the horizontal line at RM1.35 while immediate resistance is at the horizontal line at RM1.60.

Chart: BPPLAS's mweekly chart as at Aug 11, 2020 (Source: Malaysiastock.biz)  

Conclusion

Based on good financial performance & position, attractive valuation and bullish technical outlook, BPPLAS could be a good stock for long-term investment. 

Note:

I hereby confirm that I do not have any direct interest in the security or securities mentioned in this post. However, I could have an indirect interest in the security or securities mentioned as some of my clients may have an interest in the acquisition or disposal of the aforementioned security or securities. As investor, you should fully research any security before making an investment decision.

Monday, August 10, 2020

Market Outlook as at 10 August 2020

Last week we witnessed spectacular volume in the market that's reminiscent of the Super Bull Run of 1993. This is especially true on Friday when volume touched an all-time record of 26.65 billion units- a staggering volume which caused the trading to stall on Bursa Malaysia in the last hour of trading (see Chart 1). It will be interesting to see how the market will absorb the volume over the next 2 days.

Chart 1: FBMKLCI's daily chart as at August 7, 2020 (Source: Malaysiastock.biz)

At the same time, the market saw fearless buying which led to multibagger stocks born in a matters of 2-3 months- truly a sight to behold. Few will surpass the spectacular rallies achieved by Topglov and Supermx (see Chart 2). 

Chart 2: Topglov and Supermx's daily chart as at August 7, 2020 (Source: Malaysiastock.biz)

Many may recall the bull market that followed the aftermath of a crisis - AFC 1998 and GFC 2008 (see Chart 3). We are again at the cusp of a bull market as the crisis from Covid-19 pandemic subsides.

Chart 3: FBMKLCI's monthly chart as at August 7, 2020 (Source: Yahoo Finance)

Those who had experienced the Super Bull Run 1993 will remember what it's like to be in the vortex of a market mania. Last few weeks of market activities has all the hallmarks of a Super Bull Run. Away from the charts and the trading volume, you will find punters placing huge buy orders on contra basis which breached trading limits again and again. These players would easily humble the fearless men from the British SAS unit whose motto is: Who Dares Wins!

A quick glance at the major indices revealed that the bull market is still very selective. Blue chip stocks are hardly charging (see Chart 4) while small-cap stocks are only getting into the act of going up. (See Chart 5). The medium-cap stocks and fledgling stocks have extended their gain last week (see Chart 6 & 7) but the real action can be seen among tech-laden ACE Market stocks (see Chart 8). As mentioned in previous posts, the rallies in our market started with tech stocks in early April and blown apart by the pandemic stocks in early May. Now it is spreading out to the low priced fledgling stocks. 

Chart 5: FBMKLCI's weekly chart as at August 10, 2020 (Source: Malaysiastock.biz)

Chart 5: FBMSCAP's weekly chart as at August 10, 2020 (Source: Malaysiastock.biz)

Chart 6: FBM70's weekly chart as at August 10, 2020 (Source: Malaysiastock.biz)

Chart 7: FBMFLEDGLING's weekly chart as at August 10, 2020 (Source: Malaysiastock.biz)

Chart 8: FBMACE's weekly chart as at August 10, 2020 (Source: Malaysiastock.biz)

In this extremely bullish environment, a remisier can only say so much. To preach about investing in stocks with good fundamentals and reasonable valuation will be like casting pearls before swine. So the only thing to do is to stand back and let the party continues....

Monday, August 03, 2020

HLT-WA: Trading at a Big Discount

Another warrant is going down the road less traveled. In this case, it is HLT-WA- another warrant that's trading at a huge discount to the share price. As at last Thursday (July 30, 2020), HLT closed at RM1.46 while the warrant closed at RM1.03.  

Since HLT-WA has an exercise price of RM0.20 and still a long way to expiry (876 days to 27 December 2022) [here], it is hard to justify the discount of RM0.23 or 16%. As I had mentioned before (here), a warrant trading at a discount is a warning sign that the rally for both the share price and the warrant price are not sustainable.

Be careful!


Chart 1: HLT's daily chart as at July 30, 2020 (Source: Malaysiastock.biz)


Chart 2: HLT-WA's daily chart as at July 30, 2020 (Source: Malaysiastock.biz)