Friday, April 30, 2010

Maybank's uptrend may continue

Maybank has just broken above its short-term downtrend line at RM7.50. As at 10.00am, the stock was up 12 sen to RM7.60.


Chart: Maybank's daily chart as at April 30, 2010_10.00am (Source: Quickcharts)

A cheaper option is to try Maybank-CL, which expired in August 2010. Its main terms are exercise ratio of 8-to-1 and exercise price of RM6.84. At the present price of RM0.115, Maybank-CL is trading at a discount of 2%.

Based on the above technical breakout, Maybank could be a trading BUY.

BJToto- poised for a bullish breakout?

BJToto has just broken above its horizontal resistance at RM4.50 as well as the downtrend line (which stretches back to May 2007) to record an intraday high of RM4.67. As at 9.45am, BJtoto eased back to the breakout level of the downtrend line at RM4.60. If BJToto can break above the downtrend line, we may see further upside to BJToto.


Chart: BJToto's weekly chart as at April 26, 2010 (Source: Tradesignum)

If BJToto can break above the downtrend line at RM4.60, BJToto could be a trading BUY.

Note: A cheaper option is to try BJToto-CF, which expired in Feb 2011. Its main terms are exercise ratio of 3-to-1 and exercise price of RM4.00. At the present price of RM0.20, BJToto-CF is trading at no premium.

Axiata may have a bullish breakout

Axiata has just broken above its short-term downtrend line at RM3.80. As at 9.15am, the stock was up 17 sen to RM3.97.


Chart: Axiata's daily chart as at April 30, 2010_9.05am (Source: Quickcharts)

A cheaper option is to try Axiata-CC, which expired in 5/8/2010. Its main terms are exercise ratio of 5-to-1 and exercise price of RM2.75. At the present price of RM0.22, Axiata-CC is trading at a discount of 3%.

Based on the above technical breakout, Axiata could be a trading BUY.

Thursday, April 29, 2010

Atlan riding on the duty-free trade boom

Background

Atlan Holdings Bhd ('Atlan')is an investment holding company whose subsidiary companies are involved in wide arrays of business. The company has three core business activities:

* Property Investment and Development
* Hospitality and Lifestyle
* Travel Retailing (via, duty free shops)
* Manufacturing

Recent Financial Results

Atlan has just announced its results for QE28/2/2010. Its net profit increased by 111% q-o-q to RM26.1 million on the back of a 12%-increase in turnover to RM204 million. The continued growth in both top-line & bottom-line was attributable to better performance for the Duty Free & Manufacturing Segments. As compared to the previous corresponding quarter (QE28/2/2009), the net profit soared almost 19 folds from a low base of RM140k. The low net profit was attributable to forex losses suffered in that quarter.


Table: Atlan's last 8 quarterly results


Chart 1: Atlan's last 8 quarterly results

Valuation

Atlan (closed at RM3.38 yesterday) is now trading at a PER of 8.7 times (based on FYE28/2/2010 EPS of 39 sen). If Atlan can maintain its healthy growth in the past 2 quarters, we may see higher EPS for FY2011. Based on a PER of 10 times, Atlan's fair value is about RM3.90, giving a potential upside of 15%.

Technical Outlook

The long-term chart for Atlan shows a stock that is trapped within a symmetrical triangle, comprising an uptrend line that stretches back to 1998 & a downtrend line that stretches back to 1996-97. The uptrend line support is at RM2.50, while the 2 possible downtrend lines' resistance is at RM3.70 or RM4.05. Its immediate horizontal resistance at RM3.40 & RM3.20.


Chart 2: Atlan's monthly chart as at April 1, 2010 (Source: Tradesignum)

Others Comment

In an earlier post, I pointed out Atlan's overly aggressive share buyback program undertaken as well as its rather fanciful chart. The earlier comments would be my main reservation about this stock. However, its strong point would be its healthy growth & fairly reasonable valuation, which could lead to a steady rise in its share price.

Conclusion

Based on improving financial performance and reasonable valuation, Atlan could be a good stock for long term investment. Technical outlook is however neutral as the stock is likely to trade between RM2.50 & RM3.70 until a breakout has been achieved.

Wednesday, April 28, 2010

Shang may have a bullish breakout

Background

Shangri-La Hotels (M) Bhd ['Shang'] is involved in the hotel operation & property investment. It owns 3 resorts, i.e. the Rasa Sayang Resort & Golden Sands Resort in Penang and the Rasa Ria resort in Kota Kinabalu, Sabah as well as 2 hotels, i.e. Shangri-La Hotel Kuala Lumpur and Traders Hotel Penang. For its property investment, it owns the UBN Tower which is located next to Shangri-La Hotel Kuala Lumpur.

Recent Financial results

For QE31/12/2009, Shang's net profit increased by 69% y-o-y to RM9.4 million on the back of a 6%-increase in turnover to RM105 million. Compared to QE30/9/2009, its net profit was lower by 26% despite a 13%-increase in turnover.


Table: Shang's last 8 quarterly results


Chart 1: Shang's last 15 quarterly results

Valuation

Shang (closed at RM2.16 on April 28) is now trading at a PER of 22 times (based on annualized EPS of 10 sen). Price to Book is about 1.3 times (based on NTA per share of RM1.70 as at 31/12/2009). At these multiples, Shang is deemed fully valued.

Technical Outlook

Shang broke above its downtrend line at RM1.80 in October last year. It broke above the strong horizontal resistance of RM2.10 today, on thin volume. If it can recruit sufficient buying support, it may go higher. Its next resistance is at RM2.40 & then RM2.60.


Chart 2: Shang's weekly chart as at April 28, 2010 (Source: Quickcharts)

Conclusion

Its financial performance in the past two years has been unexciting & the stock is trading at its fair value. However, Shang could be a trading BUY as the stock has just broken above a strong resistance, albeit on thin volume.

US markets due for correction?

The US markets look set for a correction. A look at the main indices- DJIA , S&P500 and Nasdaq Composite- reveal a sharp drop in RSI & a sharp rise in -ve DMI. MACD for all three indices, which have not done a negative crossunder, may do so on further weakness. These 3 indicators gave similar reading just before the correction in June-July 2009 & in January-February 2010 (demoted as 'A' & 'B').


Chart 1: DJIA's daily chart as at Apr 27, 2010 (Source: Stockcharts.com)


Chart 2: S&P500's daily chart as at Apr 27, 2010 (Source: Stockcharts.com)


Chart 3: Nasdaq's daily chart as at Apr 27, 2010 (Source: Stockcharts.com)

We shall note that the SSEC index has failed to recover from the bearish downside breakout of its triangle. A correction in the US markets (if it panned out), coupled with the ongoing turmoil in Europe and the bearish outlook in China, could deal a severe blow to the global equity markets, which look ripe for some correction after a long rally.


Chart 4: SSEC's daily chart as at Apr 27, 2010 (Source: Stockcharts.com)

Nylex, an attractive value stock

Background

Nylex & its subsidiaries are principally involved in the manufacture and marketing of vinyl-coated fabrics, calendered film and sheeting and other plastic products, including geotextiles and prefabricated sub-soil drainage systems; manufacture and marketing of rotomoulded plastic products including bulk chemical containers, road barriers, playground equipment and disposal bins; distribution, manufacture and sale of petrochemical and industrial chemical products and manufacture and trading of polyvinyl chloride (more commonly known as PVC) and polyurethane ("PU") synthetic leather, films and sheets and metal roofing products.

Recent Financial results

Nylex has announced its results for QE28/2/2010, where it reported a net profit of RM8.9 million on a turnover of RM296 million. Its net profit declined marginally by 4% from the immediately preceding quarter (QE30/11/2009) but compared favorably to a net loss of RM2.6 million in the previous corresponding quarter (QE28/2/2009). The turnaround was attributable to improved market condition which allowed the group to raise selling prices & secured better profit margin.


Table: Nylex's last 8 quarterly results


Chart 1: Nylex's last 17 quarterly results

Valuation

Nylex (closed at RM0.80 yesterday) is now trading at a PER of 4 times (based on annualized EPS of 20 sen). At this multiple, Nylex is deemed quite attractive.

Technical Outlook

Nylex has broken above its medium-term downtrend line (SS) at RM0.75-77 in January. The stock seems to be consolidating in a pennant formation, with resistance at RM0.84-85. If it can break to the upside of the pennant, the upleg may begin. Its first resistance would be the horizontal line RM0.87-88 & then RM1.20.


Chart 2: Nylex's weekly chart as at April 27, 2010 (Source: Quickcharts)

Conclusion

Based on attractive valuation, Nylex could be a good stock for a medium-term investment.

Tuesday, April 27, 2010

Notion- testing its acelerated uptrend line

Notion is testing its accelerated uptrend line (S1-S1) again. This is the second time the stock tested this uptrend line. The earlier test was on last Friday, April 23. At the close today, Notion lost 9 sen to end at RM3.26. A quick rebound is crucial over the next few days. Failure to stay above this uptrend line support of RM3.30 could send the stock to its horizontal support at RM3.00 & thereafter RM2.75-77.


Chart: Notion's daily chart as at Apr 26, 2010 (Source: Tradesignum)

Semiconductor stocks- time for profit-taking

The Philadelphia Semiconductor Index (SOX) has been in an uptrend since November last year. I have drawn an uptrend line (SS) which has supported the SOX in previous bouts of correction. I have also drawn a parallel line (PP) which acted as a resistance to its periodic upswings. While SOX moved within this channel, we can see that the index also moved in short-term cycles lasting 3-4 months. I have denoted cyclical highs as H1, H2, H3, H4 and possibly H5. I have also denoted the cyclical lows as L1, L2, L3 and L4. We may be making a cyclical high soon, which I denoted as H5. After the previous cyclical, H4, the SOX corrected back to the uptrend line (and, cyclical low, L4). This also coincided with a sharp correction for Unisem, Gtronic & MPI back to their respective 50-day SMA line. If the SOX made a cyclical high & entered into a correction, we can expect a similar correction among our semiconductor stocks, especially Unisem & Gtronic. It may be a good idea to sell into strength for these 3 stocks.


Chart: SOX, Unisem, Gtronic & MPI's daily chart as at April 26, 2010 (Source: Stockcharts & Tradesignum).

Friday, April 23, 2010

Taliwrk may have a bullish breakout

Taliwrk broke above its downtrend line at RM1.55 on April 9. It continued to rise & it broke above the horizontal resistance at RM1.80. Its next resistance is at RM2.00 (see Chart 1).


Chart 1: Taliwrk's daily chart as at April 23, 2010_11.40am (Source: Quickcharts)

Taliwrk-WA has similarly broken above its downtrend line at RM0.20 on April 9. It broke above its horizontal resistance at RM0.40 this morning. The warrant will expire on 21/9/2010. Its exercise price is at RM1.27, which means that it is trading at a discount to the underlying share. See the chart below.


Chart 2: Taliwrk-WA's daily chart as at April 23, 2010_11.40am (Source: Quickcharts)

Taliwrk is a quiet stock. For FYE31/12/2009, the company reported a net profit of RM39 million on turnover of RM159 million. Its EPS for FY2009 was 10.3 sen- a decline from 12.2 sen achieved in FY2008.

Based on the above technical breakout, Taliwrk may be a good trading BUY. As this is a quiet stock, you may want to scale back your position.

Talam may have a bullish breakout

Talam may have a bullish breakout after surpassing the horizontal resistance at RM0.14 (see Chart 1). The next resistance is around RM0.20 level and then at RM0.24-25 (see Chart 2).


Chart 1: Talam's daily chart as at April 23, 2010_9.05am (Source: Quickcharts)


Chart 2: Talam's weekly chart as at Apr 19, 2010 (Source: Tradesignum)

Based on the technical consideration, Talam could be a trading BUY. I have not looked into the fundamental aspect of this company nor the restructuring of the company.

Tuesday, April 20, 2010

MISC flashed a shooting star!

MISC rose to an intra-day high of RM9.10 at about 11.45am & then entered into a correction. The intra-day correction was very severe & the share price was pushed back to the level where the stock started out in the morning (see the 30-min chart below). This correction will lead to the formation of a candlestick called the shooting star. This candlestick when it appeared after a long rally, could signify a possible bearish reversal, subject to confirmation on the following day. If confirmed, the stock is likely to drift to test horizontal support at RM8.70-75 & the breakout level of RM8.50.


Chart: MISC's 30-min chart as at April 20, 2010_4.24pm (Source: Quickcharts)

The earlier call remained valid provided the stock does not violate the breakout level of RM8.50. The unfortunate timing of the post, clashing into the correction, is much regretted.

MISC may have a bullish breakout

On April 16, MISC announced that it had entered into a Joint Venture Agreement (“JVA”) with Petromin PNG Shipping Limited (“PETROMIN”), a company incorporated in Papua New Guinea (“PNG”) to set up a joint venture company (“JVC”) the purpose of providing shipping solutions to meet the liquefied natural gas projects requirements and to also support other general shipping requirements of PNG. The JVC shall have an authorized share capital of USD10,000,000.00 comprised of 10,000,000 ordinary shares of USD1.00 each and paid-up capital of USD250,000.00 comprised of 250,000 ordinary shares of USD1.00 each. MISC shall hold 60% stake in the JVC, while PETROMIN shall hold the remaining 40%. For more, go here.

Could this be the reason for the present activity in MISC? In early April, I have commented that "MISC seems to be forming a Head-&-Shoulders formation with the neckline support at RM7.30-40. I expect fairly strong resistance from the 30-month SMA line (at RM8.51-52 then). Best to watch this stock from the sideline for now". Go here.

While anticipating a bearish breakdown of the neckline of the Head-&-Shoulder formation (a potential reversal pattern), MISC has instead rebounded off the neckline. A Head-&-Shoulder failure would turn a potential reversal pattern into a continuation pattern. This coupled with the upside breakout above the 30-month SMA line (at RM8.49 now)- which coincided with the resistance posed by the 3 years old downtrend line- means that MISC is likely to go higher.


Chart: MISC's monthly chart as at Apr 1, 2010 (Source: Tradesignum)

Based on technical analysis, I believe MISC could be a good medium-term investment.

SSEC may have a bearish breakout

Shanghai's SSEC index lost 150 points to close at 2980 yesterday. In the process, it broke to the downside of its symmetrical triangle at 3000. So far this morning, there was no sign yet of any recovery in SSEC index. In the early hour this morning, SSEC index dropped further to hit a low of 2940 before rebounding. As at 10.10pm EDT, SSEC rebounded to 2967, still nursing a loss of 13 points. It is important that SSEC index should recover above the 3000 level quickly. Failure to do so would sign a reversal from the prior uptrend. If this scenario panned out, the outlook for SSEC index would then turn bearish.


Chart: SSEC's daily chart as at Apr 19, 2010 (Source: Stockcharts.com)

Friday, April 16, 2010

FBM-KLCI dancing to the tune of the RM?

The Malaysian Ringgit (RM) finally broke its winning streak against the USD on March 13. Is this the beginning of a short-term rebound (or, corrective rally) in the USD-RM? I think this is quite likely. From Chart 1 below, we can see that the USD-RM has been in a downtrend since March last year. This downtrend consists of 3 intermediate downtrends [denoted as A, C & E] and 2 short-term rebound [denoted as B & D]. While intermediate downtrends A & C lasted about 3 months, the current intermediate downtrends E has only clocked in 2 months. However, one can see that the distance traveled by intermediate downtrends E matches that of intermediate downtrends A & C.


Chart 1: USD-RM's daily chart as at April 15, 2010 (Source: Yahoo Finance)

We can also see that a short-term rebound in USD-RM had coincided with a correction in the stock market. From Chart 2, we can see the 2 periods when this happened- in June 2009 & January-February this year.


Chart 2: USD-RM & FBM-KLCI's daily chart as at April 15, 2010(Source: Yahoo Finance & Tradesignum)

Based on the above, we need to be more careful in order to avoid a possible market correction which may be indirectly brought on by a weakening of the RM.

Zhulian, another potential MLM winner

Background

Zhulian Corporation Berhad ("Zhulian') is principally engaged in the manufacture and sale of costume jewelry and consumer products on a direct sales basis. It distributes its products under the brand name of Zhulian within Malaysia and to Thailand and Indonesia.

Recent Financial Results

Zhulian announced its results for 1Q2010 ended 28/2/2010. Net profit increased marginally by 1% q-o-q or 48% y-o-y to RM24.9 million. Its turnover declined marginally by 1% q-o-q but rose 21% y-o-y to RM86 million.


Table: Zhulian's last 8 quarterly results


Chart 1: Zhulian's last 14 quarterly results

Valuation

Zhulian (closed at RM2.45 on April 15) is now trading at a PER of 9.4 times. It has a decent dividend yield of about 5.7%. At these multiples, Zhulian is reasonably priced. Based on PER multiple of 12 times, Zhulian's fair value is estimated to be about RM3.12.

Technical Outlook

Zhulian is in an uptrend, with support at RM1.80. I have also drawn two channel lines- the upper channel line (capping its reaction high) as well as the middle channel line. These channel lines offer support & resistance to the price movement. Since the announcement of the latest results, Zhulian has traded above the previous upper channel line at RM2.35. The present rally could go as high as RM2.65, which is arrived at by adding the distance between the upper channel line & the middle channel line (of RM0.30) to the breakout level (of RM2.35). On weakness, Zhulian may pull back & test the resistance-turned-support at RM2.35.


Chart 2: Zhulian's daily chart as at April 15, 2010 (Source: Quickcharts)

Conclusion

Based on satisfactory results, reasonable valuation (with potential upside) & bullish technical outlook, Zhulian could be a good stock for medium-term investment.

Wednesday, April 14, 2010

Melewar may have a bullish breakout

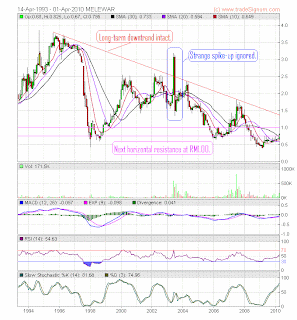
Melewar broke above its strong horizontal resistance at RM0.75 on April 12. It followed up with a rise to a high of RM0.82 on April 13. Today, it came under selling pressure & dropped 2 sen to close at RM0.795. If the stock can remain above its breakout level of RM0.75, its upleg may continue when the market sentiment improves.


Chart 1: Melewar's daily chart as at April 14, 2010 (Source: Tradesignum)


Chart 2: Melewar's weekly chart as at April 14, 2010 (Source: Tradesignum)

Based on technical breakout, Melewar could be a good trading BUY.

WCT may have a bullish breakout

WCT has just broken above its horizontal resistance at RM2.85. Its next resistance levels are RM3.00 & RM3.30.


Chart 1: WCT's daily chart as at April 14, 2010 (Source: Tradesignum)


Chart 2: WCT's weekly chart as at April 14, 2010 (Source: Tradesignum)

Based on the above technical breakout, WCT could be a good trading BUY.

Monday, April 12, 2010

KESM poised for a breakout?

Background

KESM is involved in the provision of semiconductor burn-in services, assembly of electronic components & testing of semiconductor integrated circuits. KESM's financial performance tends to mirror that of the semiconductor sector. In line with the healthy recovery in the performance of semiconductor sector, we can expect the same to happen to KESM.

Recent Financial Results

KESM's financial performance has rebounded in the past 3 quarters. In its latest quarterly results, i.e. QE31/1/2010, KESM's net profit increased by 36% q-o-q or nearly 3-fold to RM2.6 million. Turnover has also increased significantly by 18% q-o-q or 42% y-o-y to RM56 million.


Table: KESM's last 10 quarterly results


Chart 1: KESM's last 20 quarterly results

Valuation

Based on its latest quarterly results, KESM's annualized EPS would be about 24 sen. KESM (closed at RM2.58 today) is now trading at a PER of 11 times. At this multiple, KESM's upside is limited (say, 10-20%).

Technical Outlook

KESM is now testing its long-term downtrend line resistance at RM2.58-60. A bullish breakout above this level could see the stock challenging its 2008 high of RM2.80.


Chart 2: KESM's weekly chart as at Apr 5, 2010 (Source: Tradesignum)

Conclusion

KESM could be a good stock for medium-term investment due to the recovery in the semiconductor sector. It has a reasonable valuation but further upside could only happen if the stock can surpass the long-term downtrend line resistance at RM2.58-60.

Sunway has a bullish breakout

Sunway has broken above its strong horizontal resistance at RM1.55-60. The next resistance is at RM1.80 & thereafter at RM2.00.


Chart 1: Sunway's weekly chart as at April 12, 2010_10.00am (Source: Quickcharts)

For those who like to a speculative play, you can consider Sunway-WC. The main terms are:
Expiry Date: March 4, 2014
Exercise Price: RM1.30

At the current price of RM0.63 (share price of RM1.64), Sunway-WC has a premium of 17.7%. That's a bit on the high side. From the chart below, we can see that the warrant is testing its slopping line resistance at RM0.62-63.


Chart 2: Sunway-WC's daily chart as at April 12, 2010_10.20am (Source: Quickcharts)

Based on the bullish breakout, Sunway could be a good trading BUY.

UMW broke above the horizontal resistance of RM6.50

Technical Outlook

UMW has just broken above its strong horizontal resistance at RM6.50. The next resistance is at RM6.80 & then at RM7.50.


Chart: UMW's weekly chart as at April 12, 2010_11.45am (Source: Quickcharts)

Results Update

For FYE31/12/2009, UMW's net profit dropped by 37% to RM371 million from RM586 million on the back of a 16%-drop in turnover to RM10.698 billion from RM12.770 billion. We can see from Table 1 that all its divisions suffered a drop turnover and neraly all the divisions (except Oil & Gas) suffered a drop in profit contribution.


Table 1: UMW's Segmental Results for FY2009 & FY2008

For details of its last 8 quarterly results, see Table 2.


Table 2: UMW's last 8 quarterly results

From Chart 2 below, we can that UMW's financial performance has recovered in the past 3 quarters. I believe this recovery is likely to continue.


Chart 2: UMW's last 11 quarterly results

Conclusion

Based on the upside breakout above RM6.50, UMW may continue its prior uptrend.

Friday, April 09, 2010

Biosensors- a stock on a hearty rise

Background

Biosensors International Group (SGX: B20) is a medical device company that specializes in developing, manufacturing and licensing technologies for use in interventional cardiology procedures and critical care. It is also the Legal Manufacturer of BioMatrix, a drug-eluting stent that utilizes proprietary technologies of Biosensors:

- a biodegradable Poly-Lactic Acid (PLA) polymer (PLA), which degrades into the naturally occurring lactic acid
- the Biolimus A9 drug, a highly lipophilic derivative of sirolimus
- the S-Stent stent platform
- an automated stent coating technology that directly deposits the coating onto the stent surface.

(Source: Wikipedia)

Recent Financial results

For the 9-month ended 31/12/2009, Biosensors' revenue dropped from S$97 million to S$83 million which was due to a sharp drop in Licensing & Royalties Revenue (that more than offset the increase in Product Revenue). As a result, its gross profit & operating profit dropped from S$74 million to S$59 million and from S$21 million to S$14 million, respectively. However, due to a nearly 3-fold increase in Share of Results from JV companies, the company's profit after tax increased from S$10 million to S$24 million.


Table 1: Biosensors's income statement for 9-month ended 31/12/2009 (Source: Company's website)

Financial Position

Biosensors's financial position as at 31/12/2009 is satisfactory with very little borrowings (only bond payable of S$16 million as compared to shareholders' funds of S$132 million) and high current ratio of 1.7 times.


Table 2: Biosensors's Balance Sheet as at 31/12/2009

Management's earning guidance for FY10 & FY11

As per its latest results, the management expects its revenue for FY10 (FYE31/3/2010) to be about S$95-105 million. For FY11, it expects revenue to increase to S$135-145 million. (for more, go here)

Valuation

Based on the 9 months' results, Biosensors's annualized EPS is about USD0.0284 (or, S$0.0395 based on an exchange rate of USD1=S$1.39). As such, Biosensors (closed at S$0.815 today) is now trading at a present PER of 20.6 times. If we used the management's guidance for revenue increase of about 40% to estimate the EPS for FY11, we may arrive at a conservative figure of at least S$0.0550. Based on the conservative estimate, Biosensors's forward EPS is about 14.8 times. As it is based on a conservative estimate, I believe there is room for a higher PE multiple and a higher fair value for this stock.

Technical Outlook

Based on the chart below, we can see that Biosensors has recently corrected back to its long-term uptrend line support at S$68-69. Since then, the stock has rebounded. Today, it enjoyed a gain of 5.5 cents to close at S$0.815.


Chart: Biosensors's daily chart as at Apr 6, 2010(Source: SGX)

Conclusion

Biosensors is a promising company. The stock could be a good long-term investment.

PMetal poised for a bullish breakout

Results Update

PMetal's net profit increased by 38& q-o-q from RM9.2 million to RM12.6 million. This was achieved on the back of a 9%-increase in turnover from RM306 million to RM335 million. The improved performance was due to the contribution from the operation of its Mukah Smelting Plant in Sarawak.

PMetal is putting behind the 2 loss-making quarters, i.e. QE31/12/2008 when it incurred net loss of RM23.1 million due mainly to forex losses of RM16.4 million and QE31/3/2009 when it made provision for inventory impairment loss as aluminium prices deteriorated as well as additional cost to re-start a smelting plant in China.


Table: PMetal's last 8 quarterly results


Chart 1: PMetal's last 9 quarterly results

Financial Position

PMetal's financial position is less than satisfactory as at 31/12/2009. Its liquidity position is tight as reflected in its current ratio of 1.04 times, while its leverage position is high as reflected by its ratio of bank borrowings to total equity of 1.52 times.

Valuation

Based on the closing price of RM1.41 as at the end of the morning session & its average quarterly EPS of 3 sen (over the past 3 quarters), PMetal is now trading at a PER of 12 times. At this multiple, PMetal's upside is limited.

Technical Outlook


The reason that I am looking at this stock is that it may have achieved a bullish breakout above the horizontal resistance of RM1.38-40. The shortcoming is that the volume is still not convincing at this point. The next resistance is at RM1.70-75.


Chart 2: PMetal's daily chart as at April 9, 2010_11.45am (Source: Quickcharts)


Chart 3: PMetal's weekly chart as at April 9, 2010_11.45am (Source: Quickcharts)

Conclusion

Based on technical consideration, PMetal could be a good trading BUY.