Tuesday, March 31, 2009

Sime- a second take

The readers of this blog may recall a few of my posts on Sime. If you look at my last 2 posts on Sime, you would find that I had been quite critical with this stock. I like to take the opportunity to correct an error that I have made in these posts [hat tip reader palm oil(棕油网), who maintains a blog that specializes in palm oil (here).

In my post in December last year, I had noted that "...(for) 1Q2009, Sime secured a lower average crude palm oil price of RM2,962 per tonne compared to preceding quarter of RM3,285 per tonne. How would Sime perform in the next quarter, given that CPO prices are trading at RM1,600 per tonne presently? The operating margin of Sime's Plantation division is about 28% (i.e. operating profit of RM968.2 million over turnover of RM3.491 billion for 1Q2009). Since the present CPO prices are 54% lower than Sime's CPO average prices for 1Q2009, this means that Sime could make a loss in its Plantation division for 2Q2009." That was a mistake- an over-simplification of Sime's Plantation operation that ignored its many downstream businesses.

I carried on with that mistake to the next post in February this year, where I have noted that "...Sime's Plantation division has managed to stay in the black & to chalk up an operating profit of RM140 million for 2Q2008 due to two reasons, i.e. better average CPO of RM1,770 per tonne and higher volume sold (1,454 tonnes sold for 2Q2009 as compared to 1,179 tonnes sold for 1Q2009)". The unamended table (then, named Table 3) is included for illustration purpose only.


Table 3: Sime's last 4 quarters' Plantation Division's Performance

Certain portion of the above 2 passages (highlighted in bold) are incorrect. In particular, the computation of the volume of CPO produced in the above table by a simple division of the Plantation division's turnover by the average CPO price would result in a higher figure for the volume of CPO produced (as the value added by downstream operating units was ignored). In addition, it is inaccurate to compare the average operating margin of Plantation division (which stood at 27.7% & 5.4% for QE30/9/2008 & QE31/12/2008, respectively) with the fall in CPO prices, in order to draw any conclusion regarding the level of profits or losses to be recorded by the Plantation division. It is possible that Sime's upstream operation could incur some losses if CPO prices were to drop below RM1,400, but its downstream operation could be profitable. Whether the profit from the downstream operation is enough to buttress the losses (if any) from the upstream operation is a different question. Fortunately, we do not have to address our mind on this matter because Sime managed to record an average operating margin for its Plantation division of 5.4% for QE31/12/2008 even when its average CPO prices was at RM1,770 per tonne. Today, CPO prices are about RM1,900-2,000 per tonne but prices are forecast to be lower for the second half of the year (go here).

Technical Outlook

Sime appears to be forming a base between RM5.00-6.00 for the past 4 months. From the weekly chart (Chart 1 below), we can see that 10-week SMA has swung up & it looks set to cross above the 20-week SMA any time. This could happen if Sime were to go above the RM6.00 mark.


Chart 1: Sime's weekly chart as at 30/3/2009 (Source: Quickcharts)

I have also appended the monthly chart below (see Chart 2). If we draw an uptrend line from 1988- skipping the trough of 1998- we can see that this uptrend line was tested in December last year. This long-term uptrend line support is at RM4.90-5.00.


Chart 2: Sime's monthly chart as at 30/3/2009 (Source: Quickcharts)

I think that Sime could be a good long-term investment. A comfortable entry level would be at RM5.00-5.50 level.

Monday, March 30, 2009

Haio's top-line & bottom-line rebounded

Haio has just announced its results for 3Q2009 ended 31/1/2009. Its net profit increased by 10.1% q-o-q to RM12.0 million while turnover increased by 17.0% to RM102 million. Compared to the same quarter last year, net profit was 10.2% lower while turnover was up 1.6%. I believe that Haio's performance for 3Q2009 may have benefited from increased consumer spending during the year-end period as well as CNY festival (which fell in January 2009). In addition, there could be a rebound in MLM business in 3Q2009, after a drop-off in 2Q2009 when sale suffered due to the Ramadam festival (which fell in October 2008). Despite management's cautious optimism of delivering satisfactory results going forward, I believe Haio's performance is likely to suffer.


Haio's financial position is satisfactory, with current ratio at 2.5 times and gearing ratio (defined as Total Borrowings to Shareholders' Funds) at 0.1 times.

Haio (closed at RM3.34 on Friday) is now trading at a trailing PE of 4.8 times or at a Price to Book of 1.8 times. At these multiples, Haio's valuation may be deemed to be reasonable. This could change if its results were to deteriorate.

Technically speaking , Haio's share price has been holding up very well. In fact, Haio appears to have just broken above its medium-term downtrend line at RM3.25-30. As the volume traded is very small, the breakout is tentative. Haio has a consistent share buyback program, which provides good support for the share price. As at March 18th, the company's treasury shares stood at 1.18 million units.


Chart: Haio's daily chart as at 30/3/2009 (Source: Quickcharts)

Based on tougher economic conditions & poorer consumer spending, I am neutral on Haio despite its good growth track record. The share price is likely to trade in a range between RM3.00 & RM3.50.

GPacket dropping fast...

GPacket broke its strong horizontal support at RM1.00 on Monday, March 23rd. Today, it has just broken another strong horizontal support at RM0.85. The next strong horizontal support is at RM0.70. Its volume traded has picked significantly. My take on this stock remained unchanged, which is bearish (go here). Be very careful when presented with a falling knife...


Chart: GPacket's daily chart as at 30/3/2009 (Source: Quickcharts)

Friday, March 27, 2009

Market Outlook as at March 27, 2009

On March 24th, I've noted that "a reversal in the USD uptrend could push funds managers to divest their USD assets (or, take some profit on their portfolio of US Treasury bonds) & invest in their funds in other asset classes, such as commodities, equity markets (domestic or overseas), etc. This could lead to a sustained rally in many Emerging Markets, including Malaysia. I believe it is a good time to take constructive position in our market". I am going to expand on this a bit.

Looking at the KLCI's daily chart (Chart 1), we can see that the KLCI has broken above the medium-term downtrend and is now consolidating in a side-way market. This bottoming process is likely to last for 3-4 months, with the KLCI trapped in a trading range between 840-950.


Chart 1: KLCI's daily chart as at 26/3/2009 (Source: Tradesignum.com)

From the weekly chart (Chart 2), we can observe the following:
1) The 20-week SMA has capped recent rebound. Currently, the 20-week SMA is at 898.
2) The MACD indicator is still in a "downtrend". In fact, it is now testing that downtrend line, which appeared to be blocking its upside move.
3) The -DMI is moving lower while the +DMI is moving higher. Coupled with the declining ADX, this seems to indicate the current downtrend is weakening.

When the KLCI was in an uptrend in 2007-8, there were two occasions (denoted as 'a' and 'b') where panic selling broke out in the then elevated market. Similarly, panic buying may also break out in the present depressed market. If that happened, you may use that opportunity to take some profit. What is a panic buying situation? You would know it when you see it. For example, it could be many days (say, 10 days or more) of double digit gain, to be followed by a break above 1000 mark (within the next 2-3 weeks). Sounds too good to be true? Normally, it is.


Chart 2: KLCI's weekly chart as at 26/3/2009 (Source: Quickcharts)

After the sharp run-up in global equity market over the past 3 weeks, some correction is likely to set in. You may use this correction to accumulate some stocks. Look out for laggards in the construction sector (eg. MMC, Gamuda & WCT); gaming sector (eg. MPHB); oil & gas sector; and, plantation sector. Good luck.

Tuesday, March 24, 2009

CBIP may have a bullish breakout

CBIP, which is involved in the production of patented palm oil mills, named 'Modipalm Continuous Sterilisa-tion mill' as well as owning an oil palm estate of about 3,720ha and also managing about 5,936ha oil palm land in Miri, Sarawak.

CBIP had announced its results for 4Q2008 ended 31/12/2008 at the end of February. Its net profit dropped by 26.4% q-o-q to RM13.8 million while turnover increased by 16.4% to RM136 million. The lower net profit was attributable to lower contribution from the plantation segment, resulting from the significant decrease in average selling price of FFB during the quarter.

Compared to the same quarter last year, its net profit was 5.4% lower despite a 48% higher turnover.


CBIP has broken above its medium-term downtrend line resistance at RM2.00 today. As at 4.15 pm, the share price is up 15 sen to RM2.13, on volume of about 7000 board lots. This could be the start of an upleg for CBIP.


Chart: CBIP's daily chart as at Mar 24, 2009(source: Quickcharts)

By on the above, CBIP could be a good BUY for medium-term investing.

For more, check out these two recent reports from the Edge (here & here).

TMI's Rights Issue details announced

TMI has announced its details of its Rights Issue this morning. It has been structured as a 5-for-4 Rights Issue at RM1.12 per share. Based on this, TMI's Rights Issue share has been priced at a discount of 37.2% to the Theoretical Ex-rights price of RM1.78 (assuming the closing price on the last date of the entitlement is the same as TMI's yesterday's closing price) or 57.1% to TMI's yesterday's closing price.


Prior to the above announcement, TMI's share price has rallied strong from a low of about RM2.15. The share price is likely to correct downward. For those who like to buy & go through with the capital raising exercise, the good entry level is about RM2.30-40.


Chart 1: TMI's 60 min chart as at Mar 24, 2009(source: Quickcharts)

Maybank has also enjoyed a sharp rally in the past 4 days. Again, for those who like to buy & go through with the capital raising exercise, the good entry level is about RM4.30-40.


Chart 2: Maybank's 60 min chart as at Mar 24, 2009 (source: Quickcharts)

Times are a-changing

Last Friday, I've posted a piece on the negative effect on the US Dollar due to the Fed's decision to pump more than USD1 trillion into the economy to help revive the housing market. The plan includes buying up to USD300 billion of long-term government bonds over the next six months.

On further thought, I believe this could be a game changing development. This is because since the Global Financial Crisis started last year, US Dollar ('USD') has acted as a safe haven currency, attracting funds from around the globe. This has caused currency crises in many countries in Eastern Europe and some Asian countries which have heavy foreign currencies borrowing. In addition, it has caused funds managers to sell-off their investment overseas & to park the proceeds in USD assets (mainly, US Treasury bonds). A reversal in the USD uptrend could push funds managers to divest their USD assets (or, take some profit on their portfolio of US Treasury bonds) & invest in their funds in other asset classes, such as commodities, equity markets (domestic or overseas), etc. This could lead to a sustained rally in many Emerging Markets, including Malaysia. I believe it is a good time to take constructive position in our market.

I have appended below the daily charts of KLCI, HSI, N225, FTSE & DJIA. HSI & N225 are now pushing against their 100-day SMA, while the other markets are pushing against their 50-day SMA. DJIA will also benefit from this rally because I believe funds managers' risk-taking appetite could have changed & they are prepared to take on greater risks in order to get a higher return instead of their current meager picking from US Treasury bonds investment. The times are a-changing.


Chart 1: KLCI's daily chart as at 23/3/2009 (Source: Quickcharts)


Chart 2: HSI's daily chart as at 23/3/2009 (Source: Stockcharts.com)


Chart 3: N225's daily chart as at 23/3/2009 (Source: Stockcharts.com)


Chart 4: FTSE's daily chart as at 23/3/2009 (Source: Stockcharts.com)


Chart 5: DJIA's daily chart as at 23/3/2009 (Source: Stockcharts.com)

Friday, March 20, 2009

Tough Choice- Steady US Dollar or Lower Long-term Interest Rates?

On Wednesday, the Fed said it would pump more than USD1 trillion into the economy to help revive the housing market. The plan includes buying up to USD300 billion of long-term government bonds over the next six months. The immediate effect of the plan is a sharp drop in US Dollar (see Chart 1 below) & a sharp rally in long-term Treasury Notes (see Chart 2 for the performance of the 10-year Treasure Notes, TNX).


Chart 1: USD's daily chart as at March 19, 2009 (Source: Stockcharts.com)


Chart 2: TNX's daily chart as at March 19, 2009 (Source: Stockcharts.com)

The sharp drop in the US Dollar could lead to higher inflation further down the road. We can see from Chart 3 below that the Great Inflation of 1965-82 led to higher interest rates and coincided with the sub-par performance in the equity market. The US equity market begun to rise only after inflation had started to decline in early 1980s. The drop in inflation rates allowed the Fed to reduce interest rates steadily over the past 25 years. In the process, this had created one of the greatest boom in the history of the US stock market.


Chart 3: TNX & DJIA's weekly chart from 1963 to March 19, 2009 (Source: Yahoo Finance)

DJIA may drop further as correction set in among banking stocks

Over the past few days, the US equity market enjoyed a good rally, driven by strong gain in the financial or banking sector. From Chart 1 below, we can see that the Philadelphia Banking Index ('BKX') has rebounded to test its medium-term downtrend line resistance at the 30 point level. It has failed to surpass that downtrend line and is likely to drift lower to the support levels of 22-25 point. I think it is not likely re-test its recent low of 18 point, which happened when commentators & pundits were screaming for banks' nationalization.


Chart 1: BKX's daily chart as at March 19, 2009 (Source: Stockcharts.com)

A sharp pullback for BKX will probably lead to further correction in DJIA. Since September last year, DJIA has been in a downtrend, with the troughs supported by the purple line (S) & the peaks blocked by the blue line (R). The current rally is quite similar to the oversold rally in October-November last year (both rallies are marked out in the pink boxes). I think the current rally is nearing the end & correction will follow shortly. The next concern for the US market is the recent sharp depreciation in the US dollar (see next story).


Chart 2: DJIA's daily chart as at March 19, 2009 (Source: Stockcharts.com)

TMI's Rights Issue yet to be finalized

TMI's Rights Issue ('RI') was announced on the same date as the Maybank's RI, but it lags behind in a few areas. Firstly, TMI has yet to announce how many RI shares is each existing shareholder entitled to subscribe. Secondly, the subcription price of the RI shares has not been finalized. Finally, the ex-date of the RI entitlement has also not been finalized. If the recovery in the share price yesterday is any indication, I believe that we will have an announcement on this matter next week. TMI may fix this RI as a 1-for-1 Rights Issue at RM1.00 each, following the illustration accompanying its announcement on February 27th.

From the chart below, we can see that TMI was sold down sharply until RM2.15 before the stock rebounded to test its very short-term downtrend line, yesterday. Earlier this morning, the share price continued to rise & broke above that downtrend line resistance at RM2.25. As at 10.45 am today, TMI is trading at RM2.35- a gain of 11 sen over yesterday's close of RMRM2.24.


Chart: TMI's 30-min chart as at 20/3/2009 (Source: Quickcharts)

How much further can this rally go? In my opinion, TMI is a very promising company, but with serious concern regarding its liquidity & solvency position. In addition, it suffered serious setback in two of its overseas markets, i.e. Indonesia & Sri Lanka recently (for more, go here). Can this setback be reversed?

With strong local institutional funds' support, I believe that TMI's share price can be maintained at RM2.30-50 level. If TMI closed at RM2.30 on the last day of trading prior to the ex-date, the Theoretical Ex-rights price would be about RM1.65 [derived by totaling up the cost of the RI shares (1,000 x RM1.00) plus closing price of original shares (1,000 x RM2.30), then dividing by 2,000]. As such, the discount of the RI shares to the Theoretical Ex-rights price would be about 39%.

On the other hand, if TMI closed at RM2.50 on the last day of trading prior to the ex-date, the Theoretical Ex-rights price would be about RM1.75 [derived by totaling up the cost of the RI shares (1,000 x RM1.00) plus closing price of original shares (1,000 x RM2.50), then dividing by 2,000]. As such, the discount of the RI shares to the Theoretical Ex-rights price would be about 43%.

At a discount of around 40%, I believe the TMI's RI should muster enough shareholders' support to sail through.

Maybank's Rights Issue ex-date fixed

Maybank has fixed the ex-date for its Rights Issue ('RI') on March 31st. The RI of 9-for-20 was priced at RM2.74. From the chart below, we can see that Maybank has recruited sufficient buying support to stay above the RM4.00 level and further rebounded to test the horizontal resistance of RM4.30. If Maybank closed at RM4.30 on March 31st, the Theoretical Ex-rights price would be about RM3.816 (say, RM3.82) [derived by totaling up the cost of the RI shares (9,000 x RM2.74) plus closing price of original shares (20,000 x RM4.30), then dividing by 29,000]. As such, the discount of the RI shares to the Theoretical Ex-rights price would be about 28%.

On the other hand, if Maybank closed at RM4.50 on March 31st, the Theoretical Ex-rights price would be about RM3.954 (say, RM3.96) [derived by totaling up the cost of the RI shares (9,000 x RM2.74) plus closing price of original shares (20,000 x RM4.50), then dividing by 29,000]. As such, the discount of the RI shares to the Theoretical Ex-rights price would be about 31%.

I believe Maybank would well be supported by local institutional funds & hopefully it would trade between RM4.30 & RM4.50 from now to the ex-date of March 31st. Some stability in the share price would be good for the stock & would encourage shareholders to take up the RI.


Chart: Maybank's 30-min chart as at 20/3/2009 (Source: Quickcharts)

Wednesday, March 18, 2009

Jerneh broke its 1998 low

Background

Jerneh Asia Bhd ('Jerneh') is involved in the provision of general & life insurance as well as takaful insurance. For the corporate structure of the Jerneh, see the diagram below.


The largest shareholder of Jerneh is Kuok Brothers Sdn Bhd, which own 37% of its outstanding shares based on the Annual Reports for FY2007.

Recent Financial Results

From Table 1 below, we can see that Jerneh's financial performance deteriorated after 1Q2008. Its pre-tax profit dropped from RM8 million in 1Q2008 to about RM4-5 million in 2Q2008 & 3Q2008 and then to a loss of RM7 million in 4Q2008. Not much details were given, but the company acknowledged that it made provisison for diminution in value of investment totaling RM37.6 million for the whole of FY2008. This explained the drop in pre-tax profit from RM45 million in FY2007 to a mere RM10 million in FY2008.


Table 1: Jerneh's 8 quarterly results up to 31/12/2008

Historical Financial Results

In FY2008, Jerneh booked in its share of losses in Associated Companies totaling RM14 million- a drop from RM19 million incurred in FY2007. From the Annual Report for FY2007, we learn that this amount came from losses suffered by its JV insurance business in Thailand & the Philippines as well as losses from its new start-up takaful insurance JV with HSBC and its fund management associate, Areca Capital Sdn Bhd. From the two tables below, we can see that share of losses in Associated Companies has been a permanent fixture since FY2002.


Table 2: Jerneh's results for FY2003-2008


Table 3: Jerneh's results for FY1998-2002

Valuation

It is not useful to value Jerneh based on PE multiple, given the huge impairment provision made in the current financial year. Its P/Book is fairly low at 0.35 time (the stock closed at RM0.79). It also pays a dividend of about 5 sen- giving a decent dividend yield of 6.3%.

Technical Outlook

From April 2001 to September 2008, Jerneh had been moving in a range between RM1.40 & RM2.20. In September 2008, it broke below the RM1.40 support. Jerneh has dropped below its 1998 low of RM0.91-92, to making new low for the past few days.


Chart: Jerneh's monthly chart as at March 17, 2009 (Source: Quickcharts)

Conclusion

Due to the years of lackadaisical financial performance, Jerneh does not recruit many supporters. As a result, the stock failed to hold above its low recorded during the Asian Financial Crisis 1998. This is unfortunate because the stock is trading at only 0.35 time its book value, while paying a decent dividend yield of 6.3%. If ever there is a case for a privatization, Jerneh is it. However, I do not think this is likely as the Kuok group may not want to own an insurance group outright. If you have loads of patience, Jerneh could be a good stock for a very long-term investment.

Tuesday, March 17, 2009

Semiconductor sector- a quick look

We are going to compare the financial performance, position & valuation of 3 main semiconductor stocks listed in our exchange, i.e. Gtronic, MPI & Unisem.

Financial Performance

1. Unisem is the only company that managed to grow its turnover in the last 4 quarters up to 31/12/2008, as compared to the preceding 4 quarters. This is due to the contribution from Advanced Interconnect Technologies Limited ("AIT"), which was acquired for a total cash consideration of up to US$70.25 million. The deal was completed on July 18th 2007 and AIT has since been renamed “Unisem (Mauritius) Holdings Limited”.
2. Both Unisem & MPI reported a net loss for the QE31/12/2008. Gtronic is the only company that did not incur any loss during the last 8 quarters.
3. Based on the turnover for the 4 quarters up to 31/12/2008, Gtronic is only about one fifth the size of MPI or Unisem. The smaller size may be a blessing for Gtronic in this difficult times. However, in the event of a strong recovery, both Unisem & MPI share is likely to outpace Gtronic.


Table 1: Gtronic's 8 quarterly results up to 31/12/2008


Table 2: MPI's 8 quarterly results up to 31/12/2008


Table 3: Unisem's 8 quarterly results up to 31/12/2008

Financial Position

1. Gtronic's financial position is healthy, with negligible bank borrowings & very strong liquidity position.
2. MPI's financial position is also satisfactory, with low gearing & acceptable liquidity position.
3. Unisem's financial position is quite shaky, with fairly elevated gearing & inadequate liquidity position.


Valuation

Gtronic appears to be the most attractive stock, with PE at 6 times; Price to Book of 0.6 times; and, Dividend Yield of 20%. The Dividend Yield looks excessively high, so do take that with a pinch of salt. Obviously, between Unisem & MPI, one would expect Unisem to trade at higher multiples than MPI due to Unisem's poor financial position.


Conclusion

Based on the above, we can conclude that Gtronic is both the cheaper & financially healthier stock, among the 3 under consideration. This, plus the earlier post, makes a case for a Trading BUY call for Gtronic. Nevertheless, the semiconductor sector, being a cyclical sector, may not be due for an upswing yet.

Gtronic completed a reverse split of 5-to-1

Globetronics Technology Bhd ('Gtronic') completed a share consolidation (or, reverse split) of 5-to-1 on March 13th. What this means is that a shareholder, who has 5,000 shares of RM0.10 each prior to March 13th, will end up with only 1,000 shares of RM0.50 each on March 13th (if he has not disposed off his shares before March 13th).

Gtronic was trading at about RM0.12-13 before the share consolidation. So, after the share consolidation, one would expect the market price of Gtronic share to trade around RM0.60-65. Instead, the share price dropped over the last 2 days and it dropped again to RM0.465 at the close of today's morning session. There is nothing wrong with Gtronic (see the next story). This is not a share consolidation that is part & parcel of a restructuring case, where the share capital would be reduced in a capital reduction. This is similar to PBBank's share consolidation of 2-to-1 that was carried out in May 2004 (see Chart 2 below). I can only conclude that the market is reacting wrongly in this instance & has presented us a buying opportunity. I believe that the market will correct itself & Gtronic share price will slowly inch back up to RM0.60-65 over the next few days.


Chart 1: Gtronic's daily chart as at March 16, 2009 (Source: Tradesignum.com)


Chart 2: PBBank's daily chart from March-August 2004 (Source: Tradesignum.com)

Monday, March 16, 2009

Parkson to benefit from the Chinese economic recovery

Introduction

Parkson Holdings Bhd ('Parkson') is an investment holding company, with the main subsidiaries involved in the operation of department stores in the People’s Republic of China, Malaysia & Vietnam. As at 30/6/2008, the Group has a total of 76 stores located in these 3 countries.


Recent Financial results

Parkson has recently announced its results for the 2Q2009 ended 31/12/2008. Its net profit increased by 73.2% q-o-q or 72.3% y-o-y to RM104 million while its turnover increased by 10.3% q-o-q or 12.6% y-o-y to RM685 million. The improvement of both the top-line & bottom-line over the preceding quarter's was due to the festive & holiday seasons while the improvement over the previous corresponding quarter's was due to same store sale growth as well as new stores opened.


Financial Position

Parkson's financial position is mixed as at 31/12/2008. Its current ratio is satisfactory at 1.6 times while gearing ratio (defined as Bank Borrowings divided by Shareholders' Funds) is quite high at 0.9 times. The Bank Borrowings, which stood at RM2.0 billion as at 31/12/2008, was used to finance its aggressive store expansion program.

Importance of the Chinese operation

Parkson's Chinese operation is carried on by its Hong Kong-listed 53.68%-owned subsidiary, Parkson Retail Group Ltd. For FY2008, this division accounts for 69% of its turnover & 84% of its total assets employed. Its significance was clearly amplified on January 6th this year, when Parkson Retail Group Ltd announced in Hong Kong that it had experienced a lower same store sale ('SSS') growth of between 7% and 8% for the QE31/12/2008 (as compared to its earlier projection of 12% to 13%). This immediately prompted a sharp sell-off in Parkson which resulted in the share price dropping 70 sen the next day (go here).

China's economy on the mend?

The Chinese economy seems to be recovering. The Shanghai Stock Exchange's SSEC has broken above its immediate downtrend line in December 2008. In February this year, the 50-day SMA had crossed above its 100-day SMA- giving a mini-Golden Cross. A sustained recovery for the Shanghai stock market & the Chinese economy will augur well for Parkson's Chinese operation.


Chart 1: SSEC's daily chart as at March 13, 2009 (Source: Stockcharts.com)

Parkson's technical outlook

Parkson's share price seems to have broken above its downtrend. Further recovery will result in its 10-week SMA crossing above its 20-week SMA. This would signal the beginning of the next upleg for the stock.


Chart 2: Parkson's weekly chart as at March 13, 2009 (Source: Quickcharts)

Conclusion

Parkson could be a stock to ride on the Chinese economic recovery. Based on tentative signs of economic recovery there, we can expect consumer spending to improve. This will benefit Parkson which operates department stores there. Technically, the stock appeared to have made a bottom. A good entry level is at RM3.20-30.

PS- I have just added in my comment on Parkson's Financial Position, which was accidentally left out earlier.

Friday, March 13, 2009

Commerz & PBBank- dropping to their long-term uptrend line

Due to the sharp selldown of Maybank shares, PBBank & Commerz share prices were also badly knocked down. Commerz dropped from an opening price of RM6.85 on March 2nd to close at RM6.20 yesterday. Based on its Net Assets of RM4.84 as at 31/12/2008, Commerz is now trading at a Price to Book of 1.3 times. Based on Kenanga's forecast 2009 EPS of 67.8 sen for Commerz (as per its reports dated February 24th), the stock is now trading at a PE of 10.4 times. From Chart 1 below, we can see that Commerz's long-term uptrend line support is at RM5.80.


Chart 1: Commerz's monthly chart as at March 12, 2009 (Source: Quickcharts)

PBBank dropped from an opening price of RM8.80 on March 2nd to close at RM7.05 yesterday. Based on its Net Assets of RM2.84 as at 31/12/2008, PBBank is now trading at a Price to Book of 2.5 times. Based on Kenanga's forecast 2009 EPS of 75.5 sen for PBBank (as per its reports dated January 21st), the stock is now trading at a PE of 9.9 times. From Chart 2 below, we can see that PBBank's long-term uptrend line (SS) support is at RM6.50. This stock has earlier broken through its accelerated uptrend line (S1S1) support at RM8.00.


Chart 1: PBBank's monthly chart as at March 12, 2009 (Source: Quickcharts)

I think that both stocks are good long-term BUY at their respective long-term uptrend line support.

Maybank- a good long-term BUY

Over the last 4 days, the US' Philadelphia Banking Index ('BKX') has rebounded off its low of just under 18 recorded on March 6th to lose at 26 yesterday. The rebound was due to favorable comments from Citibank & Bank of America that they made profit in the first two months of this year (see Chart 1 & 2 below).


Chart 1: BJX's 5-min chart as at March 12, 2009 (Source: Marketwatch.com)


Chart 2: BJX's daily chart as at March 12, 2009 (Source: Stockcharts.com)

In our local market, banking stocks were heavily sold down over the past two weeks due to the selldown of banking stocks worldwide as well as poor sentiment brought on by the sharp fall in the share price of Maybank. As mentioned earlier, Maybank is undertaking a rights issue of 9-for-20 at RM2.74 per share in order to raise its share capital after its recent overseas acquisition. Since the announcement of the rights issue, Maybank's share price has dropped about RM1.20 (from RM5.20 to yesterday's close of RM4.06). See Chart 3 below.


Chart 3: Maybank's daily chart as at March 12, 2009 (Source: Tradesignum.com)

I believe that a long-term investor will find Maybank to be a very attractive buy. Moment like this only come once in a long while. The last time, Maybank has a sharp fall was during the Asian Financial Crisis. Then, Maybank's share price dropped from a high of RM8.00 in February 1997 to a low of RM1.50 in August 1998- a drop of RM6.50 or 81%. Since its recent high of RM10.60 in January 2008, Maybank has lost about RM6.50 or 61% of its value. Why?

There are two main reasons for the fall; firstly, the global financial crisis & the ensuing global equity meltdown and secondly, Maybank's untimely overseas acquisitions of about RM12 billion. If the same acquisitions were made 6 months later, Maybank would have gotten a better deal (maybe, 20% cheaper). If it was made a year before, the same might apply. In both instances, Maybank may be viewed less harshly as it is now. I think Maybank is being unfairly punished by the untimely investments. Maybank offers investor great value at the present moment (like buying a Mercedes at the price of a Toyota). When sentiment improves-- and it always will-- Maybank's share price will surely reward us handsomely. You only have to look at the price appreciation from RM1.50 in August 1998 to RM9.65 in January 2000- a gain of RM8.15 or 543%!!! Take a good look at Chart 4 & 5 below.


Chart 4: Maybank's monthly chart as at March 12, 2009 (Source: Quickcharts)


Chart 5: Maybank's daily chart for 1997-8 & 2008-9 (Source: Tradesignum.com)

I believe a good approach is to accumulate Maybank slowly at the present market price. There is a good likelihood that the price may go lower. I do not think it will go much lower than RM3.50. Good luck.

Tuesday, March 10, 2009

WTIC & CPO have bullish breakouts

Crude Oil prices recovery may have began. From the WTIC daily chart below, we can see that a bullish breakout above the symmetrical triangle at USD45.


Chart 1: WTIC's daily chart as at Mar 9, 2009 (source: Stockcharts.com)

A recovery in crude oil prices should be positive for oil & gas stocks, such as Sapcres, Kencana etc.

Similarly, I expect further recovery in CPO prices. From the CPO's daily chart below, we can see a bullish breakout above the ascending triangle at RM2040 level. Again, I believe plantation stocks, such as IOI, KLK, Asiatic etc would put in a decent rally.
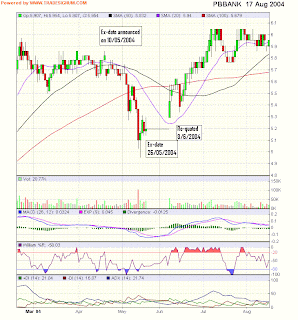


Chart 2: CPO's daily chart as at Mar 6, 2009 (source: ifs.marketcenter.com)