Friday, October 30, 2015

Transaction in Nexttrade Recovery Portfolio

Today, I disposed off 5000 Canone at RM3.38. This stock was acquired at RM2.62 on October 13. The investment yielded a profit of RM3568.66. In addition, I bought 10000 Teoseng at RM1.55.


The holdings of Nexttrade Recovery Portfolio


 The allocation of Nexttrade Recovery Portfolio

Our initial capital as at October 13, 2015 of RM100,000 has grown to RM103,419.26.

Unisem: Bottom-line & top-line continue to rise

Result Update

For QE30/9/2015, Unisem's NP rose 28% q-o-q or 48% y-o-y to RM40.2 million while revenue was up 10% q-o-q or 21% y-o-y to RM330 million. The company attributed the higher net profit for the current quarter to increased  revenue and lower interest expense. The directors expect the performance of the Group will remain satisfactory till the end of the financial year.


Table: Unisem's last 8 quarterly results


Chart 1: Unisem's last 44 quarterly results

Industrial Outlook

Semiconductor Industry Association (SIA) reported recently that global sales for August 2015 total of $27.9 billion were 3.0 percent lower than the August 2014 total of $28.6 billion. Regionally, year-to-year sales increased in China (4.4 percent), but decreased in the Americas (-3.5 percent), Europe (-12.4 percent), Japan (-13.0 percent), and Asia Pacific/All Other (-2.3 percent). SIA's president and CEO, John Neuffer said “The global semiconductor market has endured a slight softening of demand in recent months, which has combined with currency devaluation and regular market cyclicality to slow sales somewhat”. For more, go here.

Meanwhile the Philadelphia's Semiconductor index, SOX has rebounded off its August low of 550 to 660.  

 
Chart 2: SOX's weekly chart as at Oct 29, 2015 (Source: Stockcharts.com)

Valuation

Unisem (closed at RM2.30 yesterday) is now trading at a PE of 14 times (based on annualized FY14E EPS of 16.7 sen). At this multiple, Unisem - a cyclical stock - is deemed fairly valued.

Technical Outlook

Unisem share prices tend to trend. From the chart below, we can see uptrend & downtrend alternate from time to time. Currently, it has broken its immediate uptrend line. This means that Unisem could be at the start of a downtrend. You should note that MACD & Stochastic have both hooked down.


Chart 3: Unisem's monthly chart as at Oct 29, 2015 (Source: ShareInvestor.com)

Conclusion

Despite the satisfactory financial performance, Unisem should be treated with a bit of caution as its technical outlook is showing signs of a possible top. I would rate it a HOLD for now but if the share price exceeds the RM2.50 mark, you may consider SELL INTO STRENGTH.

Note:
In addition to the disclaimer in the preamble to my blog, I hereby confirm that I do not have any relevant interest in, or any interest in the acquisition or disposal of, Unisem.

Thursday, October 29, 2015

Market Outlook as at October 29, 2015

FBMKLCI has once again dropped below the neckline of the head and shoulders top at 1680. On October 7, we had noted that the index managed to climb back above the neckline (for the chart, go here). That earlier recovery (above the neckline) meant that the prior interpretation of a market that had made a top was in doubt. However, with the index once again trading below the neckline, the interpretation that the market has made a top reassert itself.


Chart 1: FBMKLCI's weekly chart as at October 29, 2015_9.50am (Source: ShareInvestor.com)

For long-term charts on FBMKLCI & FBMEmas, look at Chart 2 & 3.


Chart 2: FBMKLCI's monthly chart as at October 29, 2015_9.50am (Source: ShareInvestor.com)


Chart 3: FBMEmas's monthly chart as at October 29, 2015_9.50am (Source: ShareInvestor.com)

If the two indices do not recover above their respective neckline in the next 1-2 day(s), the negative interpretation would return, i.e. the market has made a top and will likely to continue to drift lower in the weeks and months ahead. Thus, it is important that we watch the market closely and take the necessary corrective action to adjust for the latest market outlook.

Tuesday, October 27, 2015

SCGM: Risk And Reward Are Two Sides Of The Same Coin

SCGM had risen from about RM0.40 to RM2.60 since our BUY call in December 2012. Is there more upside to this stock after the 1-for-2 bonus issue in August? Let's re-examine the stock!

Results Update

SCGM's latest results for QE31/7/2015 was announced on August 19. In that quarter, SCGM's net profit dropped 5% q-o-q but rose 38% y-o-y to RM4.9 million while revenue rose 15% q-o-q and 9% y-o-y to RM30 million. Revenue increased q-o-q due to the introduction of a new product line, i.e. plastic cups and higher sales during Hari Raya in July 2015.

Despite foreign exchange gains as a result of a stronger U.S. dollar and slight improvement in profit margin as a result of stable fuel cost, SCGM's bottom-line dropped q-o-q due to a sharp drop in Other Operating Income from RM1.45 million to RM267k. No detail was given as to the reason for the drop in Other Operating Income. See Diagram 1 below.

 
Table: SCGM's last 8 quarterly results

 
Chart 1: SCGM's last 25 quarterly results


 Diagram: SCGM's quarterly results for QE31/7/2015, 30///42015 & 31///7/2014

Valuation

SCGM (closed at RM2.68 yesterday) is now trading at a PE of 20.6 times (based on last 4 quarters' EPS of 3 sen). At this PER, SCGM is fully valued. However, if you viewed SCGM as a growth stock with earnings CAGR averaging 40% in the past 2 years, its PEG ratio at 0.5x is quite reasonable. Like Daibochi & Tomypak, I always have difficulty accepting packaging companies as growth stocks because their revenue numbers are fair stagnant. Their earnings growth seems to come from better efficiency or lower operating cost (flowing more from lower input costs). Without growing your business, there is a limit to which one can squeeze out profit through efficiency improvement or from favorable input price movement. In view of that, I feel that SCGM is probably fairly valued but may gain further upside due to current low input price & favorable forex environment.

Technical Outlook

SCGM is in a long-term uptrend line. The 10-month SMA line, currently at RM2.50, has supported the stock fairly well. Recently, the stock broke above the horizontal resistance of RM2.60, accompanied by the bullish signal of MACD Signal line crossing above the MACD line. This bullish breakout could send the price higher- possibly testing the psychological RM3.00 mark.

However, unlike past breakouts, the current breakout is without huge volume. In fact, the price run-up in the past 10 months was not accompanied by significant volume. To me, the lack of volume can be viewed in two ways: positively as it means small number of sellers & less impediment as the share price marches higher AND also negatively because a change in perception can suddenly bring out large number of sellers that could easily overwhelm the reluctant buyers at high prices. Thus, it is important to watch this stock closely. In fact, the recent breakout level at RM2.60 should serve as an important support that must not be violated.


Chart 2: SCGM's monthly chart as at Oct 26, 2015 (Source: ShareInvestor.com)

Conclusion

Based on good financial performance, "reasonable" valuation & positive technical outlook, SCGM is still a good stock for long-term investment. For technical reason noted above, we must track this stock closely and be ready to reduce position if the share prices were to reverse below the recent breakout level of RM2.60.

Note:
In addition to the disclaimer in the preamble to my blog, I hereby confirm that I do not have any relevant interest in, or any interest in the acquisition or disposal of, SCGM.

Sunday, October 25, 2015

Analyzing Stocks on ShareInvestor

In the past 1 year, I have been using ShareInvestor Station to obtain my research material & to carry out the bulk of my charting work. It is an application-based software that provides trading tools and customisable screen layout for stock monitoring.

I go to ShareInvestor Station to get the factsheet for any stock that pricks my interest. To do that, you go to the FUNDAMENTAL tab. Under this tab, you can also access 10 years of financial data for the company. See Diagram 1 & 2.


Diagram 1: Factsheet from ShareInvestor Station's Fundamental Section


Diagram 2: Financial from ShareInvestor Station's Fundamental Section

The other tab that I access regularly is CHARTS. It provides price charts for stocks in many markets, including Bursa Malaysia, SGX, HKEX, etc.


Diagram 2: ShareInvestor Station's Chart Section

If you want to look at stocks traded in other markets, like SGX, HKEX or IDX, you just select the appropriate exchange. Below I appended the charts of Wilmar (listed on SGX), Lenovo (listed on HKEX) and BII (listed on IDX)


Chart 1: Wilmar's monthly chart as at Oct 23, 2015 (Source: ShareInvestor)


Chart 2: Lenovo's monthly chart as at Oct 23, 2015 (Source: ShareInvestor)


Chart 3: BII's monthly chart as at Oct 23, 2015 (Source: ShareInvestor)

The service is fairly priced, with the base annual subscription fee for ShareInvestor Station at RM630. You can choose to use the slim-down version, known as ShareInvetor Webpro which has a base annual subscription fee of RM110. For more, go here. Before you commit, you may like to sign up for a free trail to check out the system (here). For further questions on membership, go here. However, to fully benefit from the experience - and to make better decisions - it is advisable if you attend one of the learning workshop conducted by the company - like this one (here).


Diagram 4: Shareinvestor's Plans Overview

Trading Stocks on Kentrade Platform

Online customers of Kenanga will use the Kentrade platform for the purpose of transacting in the market, tracking their portfolio and updating themselves on stocks & markets (including overseas markets).

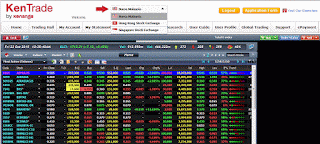
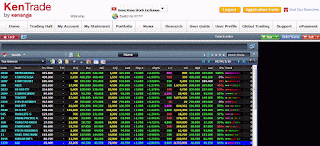
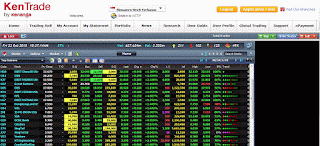
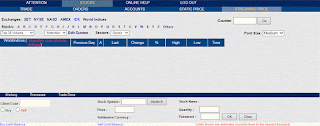
Kentrade platform allows customers to transact in stocks listed on Bursa Malaysia, HKEX & SGX. The default screen will show prices for Bursa Malaysia (see Diagram 1). If you click on the small arrow, the drop down menu will give you the choice of transacting in HKEX or SGX (see Diagram 2 & 3). To trade in overseas markets, you need to make prior arrangement with the company.


Diagram 1: Kentrade Trading Hall, showing prices of stocks listed on Bursa Malaysia


Diagram 2: Kentrade Trading Hall, showing prices of stocks listed on HKEX


Diagram 2: Kentrade Trading Hall, showing prices of stocks listed on SGX

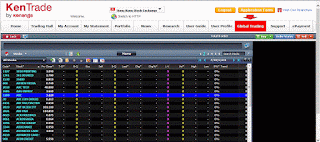
In addition to HKEX & SGX, you can also trade in IDX, SET & US stock exchanges , such as NYSE, Nasdaq & AMEX. To access these other overseas markets, you have to click on "GLOBAL TRADING" button (see Diagram 4).


Diagram 4: Access to more overseas markets via Kentrade 

Another window will pop up! See Diagram 5.


Diagram 5: Access to Kentrade Global Trading Platform

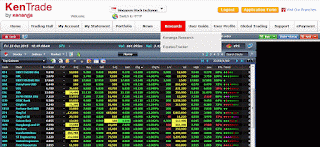
To access research material, you have to click on "RESEARCH" button (see Diagram 6). This will give you a choice of looking up Kenanga Research or Equities Tracker.


Diagram 6: Access to research via Kentrade

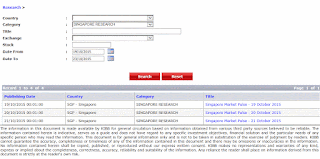
If you click on Kenanga Research, a new window will open up! See Diagram 7.


Diagram 7: Kenanga Research

With a comprehensive trading platform, trading in stock markets - here and overseas - are just a click away!!

Friday, October 23, 2015

TAS: The recovery begins...

Results Update

For QE31/8/2015, TAS's net profit jumped by 285% q-o-q or 60% y-o-y to RM8.7 million on the back of relatively unchanged reve nue of RM76 million. The sharp jump in bottom-line was attributed to gain from foreign exchange due to the strengthening of the USD & SGD against the MYR.


Table 1: TAS's last 8 quarterly results


Chart 1: TAS's last 25 quarterly results 

Valuation

TAS (closed at RM0.51 yesterday) is now trading at a current PE of 6 times (based on annualized EPS of 9 sen). We do not know how much of the earning of QE31/8/2015 will recur as it includes a substantial forex gain. Assuming the recurring earnings accounted for 2 sen EPS out of 5 sen reported EPS, then its recurring annualized EPS would be 8 sen. At this "adjusted" EPS, TAS's PER would be 6.4 times. Thus, TAS is deemed fairly attractive.

Technical Outlook

TAS had a sharp drop from a high of RM1.50 in July 2014 to a low of RM0.40 in August this year. It was at this time that it cracked below the long-term uptrend line, SS at RM0.40. Since then, the share price has recovered above its strong resistance of RM0.50. To rise further, TAS needs to break above the intermediate downtrend line, RR at RM0.52-0.54.


Chart 2: TAS's weekly chart as at Oct 22, 2015 (Source: ShareInvestor.com)

Conclusion

Based on imporved financial performance, relatively attractive valuation & mildly positive technical outlook, TAS is considered a good stock for a recovery play.

Note:
In addition to the disclaimer in the preamble to my blog, I hereby confirm that I do not have any relevant interest in, or any interest in the acquisition or disposal of, TAS.

Thursday, October 22, 2015

Huayang: Earnings dipped sequentially

Results Update

For QE30/9/2015, Huayang's net profit dropped 4% q-o-q but rose 10% y-o-y to RM29 million while revenue improved 6% q-o-q or 8% y-o-y to RM151 million. The y-o-y improvement in revenue & PBT (of 9%) were attributed to steady construction progress of all on-going projects.


Table: Huayang's last 8 quarterly results


Chart 1: Huayang's last 29 quarterly results 

We can see from the chart below that Huayang's unbilled sales was at a high of 5.6 quarters in 2Q2013. With better delivery/execution, this ratio of unbilled sales to current quarter revenue recognized started to ease back in 2@2014, despite higher unbilled sales. However, the improved delivery/execution coupled with slowing sales in 2Q2015 led to a drop in the ratio of unbilled sales to current quarter revenue recognized to 4.05. This means that Huayang's sales in hand should last about 1 year.

 
Chart 2: Huayang's last 5 years of 2Q's sales book 

Valuation

Huayang (at RM1.81 yesterday) is trading at a PE of 4.0 times (based on last 4 quarters' EPS of 45 sen). At this PE, Huayang is still deemed fairly attractive.

Technical Outlook

The monthly chart shows that Huayang has broken below its uptrend line, SS. It is now moving sideways, with support at the horizontal line RM1.75 & resistance at the horizontal line RM2.50.

Chart 2: Huayang's monthly chart as at Oct 21, 2015 (Source: ShareInvestor.com)

Conclusion

Despite the mildly negative technical outlook, Huayang is still a good stock for long-term investment based on attractive valuation & satisfactory financial performance. 

Note: 
In addition to the disclaimer in the preamble to my blog, I hereby confirm that I do not have any relevant interest in, or any interest in the acquisition or disposal of, Huayang.

Wednesday, October 21, 2015

Scable: Breaking to the upside

In August, I posted on Scable based on its improved financial performance, attractive valuation  & mildly positive technical outlook. At that time, the stock was testing its long-term uptrend line at RM1.20-1.22 (here).

Yesterday, it broke above its intermediate downtrend line at RM1.45-1.47. With this breakout, the stock could begin its next upleg. Thus, it could be a good trading BUY.

 
 Chart 1: SCABLE's weekly chart as at Oct 21, 2015_12.15pm (Source: ShareInvestor,com)

 
 Chart 2: SCABLE's monthly chart as at Oct 21, 2015_12.15pm (Source: ShareInvestor,com)

Note: 

In addition to the disclaimer in the preamble to my blog, I hereby confirm that I do not have any relevant interest in, or any interest in the acquisition or disposal of, SCABLE.

Rubber Gloves: It's All about Earnings!

In the past few years, 2 out of the 4 large rubber glove producers have been market darlings. They are Harta and Kossan. Lately, Topglov has made it to that list, leaving out only Supermx.


Chart 1: Supermx, Topglov, Kossan & Harta's monthly chart as at Oct 20, 2015 9Source: ShareInvestor.com)

The share price run-up has been consistent with improved earnings. We can see the following:
1. Kossan & Topglov's share price rallied when their earnings trend higher.
2. The same was noted for Harta from FY2008 to FY2011 before flattened out in FY2012. Despite the earnings drifted lower in FY2013 & FY2014, share price correction was very minimal as it has been the top pick for the sector for quite a while. With earnings starting to rollback, Harta's share price is again on the rise.
3. Supermx's share price has been trapped in a large triangle as its earnings were flattish since FY2010.

 Chart 2: Supermx, Topglov, Kossan & Harta's P&L

Looking at the valuation table below, we can see that Kossan is the most expensive of the rubber glove producers. Kossan has PER & PBR of 32.6 & 6.0 times, respectively. Next in line is Topglov, with PER & PBR of 20.9 & 3.7 times, respectively. This cheaper valuation may reverse as Topglov rallies higher on good earnings and proposed 1-for-1 bonus issue.


Table: Supermx, Topglov, Kossan & Harta's Valuation

Based on the above, I would recommend a switch from Kossan to Topglov and Harta. Supermx will have to wait as the company is still sorting out its problems that is weighing down its earnings. For Topglov, the next few weeks or months will be like the good old days of 2004-2007 when it was the Master of the Universe!!

Note:
In addition to the disclaimer in the preamble to my blog, I hereby confirm that I do not have any relevant interest in, or any interest in the acquisition or disposal of, Harta, Kossan, Topglov & Supermx.

Tuesday, October 20, 2015

Market Outlook as at October 20, 2015

For the past 2 weeks, FBMKLCI has been pressing against the upper line ('AC') of its medium-term upward channel, ABCD. Buyers were reluctant to bid too aggressively but sellers were also hesitantly to sell off their shares. This stalemate must be resolved by either a breakout above the upper line, AB or a pullback towards the lower line, BD. The market was down by 14 points to 1704 as at 4.30pm and we will sign a test of the buyers & sellers' resolve tomorrow. If the index breaks below the psychological 1700 mark, it may slide down to test the horizontal line 1690. Beyond that, the index will find support at the lower line, BD (of the medium-term upward channel, ABCD) and the intermediate downtrend line, RR at 1650. 


Chart 1: FBMKLCI's daily cahrt as at Oct 20, 2015_3.30pm (Source: ShareInvestor.com)

With its near-term upside checked by the horizontal line 12800, FBM70 may enter into a corrective phase shortly. This index may pullback to the horizontal line 12400.


Chart 2: FBM70's daily cahrt as at Oct 20, 2015_3.30pm (Source: ShareInvestor.com)

All in all, I believe the market is poised for a short-term correction which is led by a correction among the blue chip stocks, as reflected in the 14-point drop for FBMKLCI today.

Thursday, October 15, 2015

Hapseng: Nothing succeeds quite as well as success!

In September 2013, I called a BUY on Hapseng because the price of Hapseng broke above its recent high of about RM2.00 while Hapseng-WA & broke a strong resistance of RM0.54-0.55. These are clearly shown in the charts below.


Chart 1: Hapseng's monthly chart as at Oct 15, 2015 (Source: ShareInvestor.com)


Chart 2: Hapseng-Wa's monthly chart as at Oct 15, 2015 (Source: ShareInvestor.com)

To be frank, I am not sure what's really driving the share & warrant prices through the roof. Haoseng's latest quarterly result was pretty good (here) but it includes an exceptional gain of  RM508.8 million arising from the disposal of Hap Seng Capital Pte Ltd. If we do not adjust for this huge gain, and simply annualized the earnings (i.e. multiply by 2) to arrive at the FY2015 earnings, then the trend of the company's earnings and CAGR would be phenomenal. See Table 1 below.


Table 1: Hapseng's last 12 years' P&L, with FY2015 earnings computed using simple annualization of unadjusted 1H2015 earnings

If we were to exclude the exceptional gain, then the recurring earnings for 1H2015 would drop from RM668 million to RM159 million! If we annualized the earnings to arrive at FY2015 earnings, the numbers are horrific! Diluted EPS would adjust to only 9.12 sen. See Table 2 below.


Table 2: Hapseng's last 12 years' P&L, with FY2015 earnings computed using simple annualization of adjusted 1H2015 earnings

Alternatively, if we were to exclude the exceptional gain and estimate that the 2H2015 earnings were similar to 2H2014 earnings, then the earnings for FY2015 earnings would still be lower than those shown on Table 1 but better than those shown on Table 2. Diluted EPS would adjust to only 15.18 sen. Check out the numbers below.


Table 3: Hapseng's last 12 years' P&L, with FY2015 earnings being the aggregate of the adjusted 1H2015 earnings & the actual earnings for 2H2014 (assumed to be the earnings for 2H2015).

Hapseng (closed at RM6.10 today) would be trading at a diluted trailing PER of 13 times the unadjusted last 4 quarters' EPS of 46.8 sen (or a diluted trailing PER of 19 times the adjusted last 4 quarters' EPS of 32.2 sen). Current year earnings & PER as per the 3 tables above have been summarized below:


It would be imprudent to compute FY2015 EPS based on a simple annualization of the unadjusted 1H2015 earnings. It could be unfair to compute FY2015 EPS based on a simple annualization of the adjusted 1H2015 earnings. I think it is probably generous to compute FY2015 EPS based on the aggregate of the adjusted 1H2015 earnings & the actual earnings for 2H2014 (assumed to be the earnings for 2H2015).

Let's be generous. Based on an estimated EPS of 15.18 sen for FY2015, Hapseng's PER would be 40 times. I think it is fair to say that Hapseng is handsomely valued.

Based on the above, I think it is advisable to TAKE PROFIT on this stock.

Note: 

In addition to the disclaimer in the preamble to my blog, I hereby confirm that I do not have any relevant interest in, or any interest in the acquisition or disposal of, Hapseng.

Topglov: Earnings jumped

Results Update

For QE31/8/2015, Topglov's net profit rose by 43% q-o-q or 123% y-o-y to RM103 million while revenue rose by 7% q-o-q or 23% y-o-y at RM709 million.  Profit Before Tax rose by 33.7% q-o-q to RM134.5 million due to higher sales volume, ongoing efficiency and quality enhancement initiatives, low raw material prices and a stronger US Dollar.

 
Table: Topglov's last 8 quarterly results


Chart 1: Topglov's last 37 quarterly results

Valuation

Topglov (traded at RM8.45 as at 3.30pm) is now trading at a PE of 18.8 times (based on last 4 quarters' EPS of 45 sen). At this PE multiple, Topglov is fairly valued.

Technical Outlook

From Chart 2 below, we can see that Topglov broke above its large pennant formation ('ABCD") at RM6.30. With this breakout, the share price is expected to continue its uptrend.
 

Chart 3: Topglov's monthly chart as at Oct 15, 2015_3.00pm (Source: ShareInvestor.com)

Conclusion

Based on better financial performance, fair valuation & positive technical outlook, Topglov is a good stock for long-term investment.

Note:
In addition to the disclaimer in the preamble to my blog, I hereby confirm that I do not have any relevant interest in, or any interest in the acquisition or disposal of, Topglov.