Showing posts with label construction. Show all posts

Wednesday, May 15, 2019

Construction & Building Material Stocks Uptrend Intact

Construction stocks, such as Gamuda and IJM, had a strong rally over the past 4-5 months. They too underwent correction in the past 2 weeks. It is good to see that their uptrend lines are still intact. 

 
 Chart 1: Gamuda daily chart as at May 15, 2019_10.45am (Source: Malaysiastock.biz)


Chart 2: IJM daily chart as at May 15, 2019_10.45am (Source: Malaysiastock.biz)

The same goes for building material stocks such as Annjoo and Tasek. Tasek reported another loss-making quarter for QE31/3/2019 (here).


 Chart 3: Annjoo daily chart as at May 15, 2019_10.45am (Source: Malaysiastock.biz)


 Chart 4: Tasek daily chart as at May 15, 2019_10.45am (Source: Malaysiastock.biz)

Despite weaker market sentiment, construction & building material stocks still gather buying support as the revival of ECRL and Bandar Maalysia will spur recovery for both sectors going forward.

Tuesday, January 15, 2019

IJM & GAMUDA: Looking like 2009

When you compare the charts of IJM and GAMUDA last 12 months with the charts for 2008-2009, the similarity is pretty uncanny. It looks like both stocks are tracing out their bottoms. Take a look at the MACD and ADX indicators.

1. IJM


Chart 1: IJM's monthly charts for 2007-2009 & 2017-2019

2. GAMUDA


Chart 2: Gamuda's monthly charts for 2008-2009 & 2018-2019

I think that it may be a good time to nibble into these 2 construction stocks.

Friday, September 07, 2018

KIMLUN: Better Value at Lower Price

Kimlun has tumbled about 36% from RM2.00 in early May to RM1.27 yesterday. Is this stock worth investing?

Results Update

For QE30/6/2018 (2Q2018), Kimlun’s net profit dropped 22% q-o-q or 33% y-o-y to RM10 million while revenue was mixed - dropped 1% q-o-q but rose 12% y-o-y to RM218 million.

Revenue dropped 1.3% q-o-q but profit after tax dropped 22% or RM2.76 million due to sharp drop in Group’s gross profit of RM3.34 million or 12.2% due to lower gross profit margin achieved by the construction division due to projects mix with higher composition of lower margin projects. The impact of a declined construction gross profit margin was partly offset by the improvement in the M&T GP margin. The improvement in manufacturing & trading ('M&T') gross profit was mainly due to the better margin precast concrete products contributed a higher proportion of M&T sales during in 2Q2018. [Note: Kimlun's result for QE30/6/2018 was announced on August 29, 2018.]


Table: Kimlun's last 8 quarters' P&L accounts


Graph: Kimlun's last 22 quarters' revenue, profits & profit margins

Financial Position

Kimlun's financial position is deemed adequate with good liquidity position (current ratio was at 1.7 time) but gearing ratio was elevated at 1 time.

Current Year Prospects

This is taken from the Notes to the latest Financial Statements:
The Group has an estimated construction and manufacturing balance order book of approximately RM1.7 billion and RM0.4 billion respectively as at 30 June 2018, contributed by numerous construction contracts and supply contracts. The balance order book provides a good earnings visibility to the Group and is expected to keep the Group busy for the next 2 years. (Emphasis mine)
Valuation

Kimlun (closed at RM1.27 yesterday) is now trading at a PER of 6.8 times (based on last 4 quarters’ EPS of 18.8 sen). At this PER, Kimlun is deemed fairly attractive.

Technical Outlook

Kimlun has dropped very near to its long-term uptrend line support at RM1.20.


Chart: Kimlun's weekly chart as at Sep 6, 2018_4.00pm (Source: Malaysiastock.biz)

Conclusion

Despite a slightly weaker financial performance, Kimlun is a good stock for long-term investment based on clear earning visibility, reasonably healthy financial position and fair valuation.

Note:

I hereby confirm that I do not have any direct interest in the security or securities mentioned in this post. However, I could have an indirect interest in the security or securities mentioned as some of my clients may have an interest in the acquisition or disposal of the aforementioned security or securities. As investor, you should fully research any security before making an investment decision.

Tuesday, November 14, 2017

Construction Stocks Took A Knock

Last Tuesday, Gamuda took a sharp knock on news that it will not play the role of Project Delivery Partner ('PDP') for MRT3 because the Government has opted for the 'build and finance' model by a turnkey contractor to undertake that project. This decision was taken to remove the Government's funding burden as earlier phases. MRT1 & MRT2 were financed by the Government via Danainfra bonds.

The market has now come to apply this decision to other big-ticket projects, such as the High Speed Rail Link ('HSRL') between KL & Singapore as well as the East Coast Rail Link ('ECRL'). This would effectively preclude our big construction companies from these projects and it would hit their order books as well as bottom-line going forward.

This may explain why the share prices of large construction companies took a tumble over the past few days or weeks. Let's look at them individually: 

1) Gamuda is at its intermediate uptrend line, S1-S1 support at RM4.80. If this support breaks, it may drop to the long-term uptrend line, SS at RM4.00.


Chart 1: Gamuda's monthly chart as at Nov 13. 2017(Source: Malaysiastock.biz)

2) IJM has broken below its intermediate uptrend line, S1-S1 support at RM3.30. It is now at the long-term uptrend line, SS support of RM3.00. If this fails, IJM may slide to RM2.00-2.20 horizontal support.


Chart 2: IJM's monthly chart as at Nov 13. 2017(Source: Malaysiastock.biz)

3) YTL has broken its long-term uptrend line, SS support at RM1.50 in November 2016. It is now at the horizontal support area of RM1.10-1.30.


Chart 3: YTL's monthly chart as at Nov 13. 2017(Source: Malaysiastock.biz)

I think the Government's decision on the mode of financing large project must be balanced with the negative impact of undermining one of the important components of our economy, ie. the construction sector. If we let this sector to be weakened- just as we had for the property sector - then the impact on the overall economy will be very severe. If the Government decides to limit the new approach to only MRT3 & ECRL, then the construction sector may enjoy a recovery. Thus you should take a cautious approach when you decide to buy into these beaten-down large construction stocks. I think the Government will announce a limit to its decision with regards to the new 'build and finance' model of undertaking large projects. Good luck.

Note:
I hereby confirm that I do not have any direct interest in the security or securities mentioned in this post.
 However, I could have an indirect interest in the security or securities mentioned as some of my clients may have an interest in the acquisition or disposal of the aforementioned security or securities. As investor, you should fully research any security before making an investment decision.

Tuesday, November 07, 2017

Gamuda: At the Long-term Uptrend Line

Gamuda, the construction heavyweight, is coming under heavy selling today. It is now testing its first uptrend line, SS at RM4.80. Depending on the severity of this sell-down, the share price may even test the next long-term uptrend line, S1-S1 at RM4.50

At this moment, there is no news in the market that could explain the heavy sell-down in Gamuda. Based strictly on technical analysis, Gamuda share price may find support at RM4.50-4.80.

For investors who have been waiting to get into Gamuda, this could be an opportunity to do so at an attractive price. However the big price drop that we have seen so far today, it is not unlikely that the selling will continue tomorrow or even for the next few days. You would have to track the stock closely before pulling the trigger. Ideally you will try to get in at RM4.50. Is that possible? Let's wait & see.


Chart: Gamuda's weekly chart as at Nov 7, 2017_3.30pm (Source: Malaysiastock.biz)

Note:

I hereby confirm that I do not have any direct interest in the security or securities mentioned in this post. However, I could have an indirect interest in the security or securities mentioned as some of my clients may have an interest in the acquisition or disposal of the aforementioned security or securities. As investor, you should fully research any security before making an investment decision.

Friday, October 13, 2017

HoHup: An Easy Rally!


A few weeks back, I discussed with a client about the successful launch of Malton's The Park 2 Pavilion in Bukit Jalil. This is the project which Hohup is entitled to a 18% share of the gross development value. In addition, Hohup has an adjoining piece of land measuring 10 acres. Thus I rated Hohup as a cheap proxy to ride on growing demand for Bukit Jalil area. Unlike Malton which rose from RM0.90 to RM1.10, Hohup declined from RM0.80 to below RM0.70. Today Hohup announced that it will not go ahead with its Rights Issue to raise fund for its construction & property development business. Under normal circumstances, that would be a bad news. In the present market, it is not. Hohup rose from RM0.67 to RM0.71 as at 4.10pm.

Looking at  the charts below, Hohup can be a good stock to consider for a recovery play. It is trading at the long-term uptrend line, with support just below RM0.70 (see Chart 2). If it can recruit enough buying support, it may even put in a short rally to test the upper line of the downward channel at RM0.85 (see Chart 1).


Chart 1: Hohup's daily chart as at Oct 13, 2017_4.00pm (Source: Malaysiastock.biz)


Chart 2: Hohup's weekly chart as at Oct 13, 2017_4.00pm (Source: Malaysiastock.biz)

Sunday, May 28, 2017

Ptaras: Poor Earnings Due to CNY

Results Update

In QE31/3/2017, Ptaras's net profit dropped 25% q-o-q or 19% y-o-y to RM8.4 million while revenue was mixed- down 12% q-o-q but rose 81% y-o-y to RM53million. Revenue dropped q-o-q due to lower contribution from the construction division as some on-going projects were at the tail end coupled with fewer working days during the CNY period  as well as lower investment income. However, contribution from the manufacturing division remained high.


Table: Ptaras's last 8 quarterly P&L

For 9-month ended 31/3/2017, revenue increased by 79% to RM172.1 million from RM95.9 million in the preceding year. Correspondingly, the PBT of RM41.6 million outperformed earnings for the same period last year by 155%, spurred mainly by better performance from the construction division as well as higher investment income. The construction division achieved a substantially higher revenue of RM148.8 million compared to RM70.4 million last financial year. Consequently, PBT soared by 336% to RM30.5 million from RM7.0 million last financial year. The increase in revenue and PBT were mainly due to increased volume of construction works. Revenue in the manufacturing division reduced by 9% to RM23.3 million from RM25.6 million compared to last financial year. The decline was mainly due to lower sales volume as well as lower selling prices. Nevertheless, the manufacturing division achieved a better PBT of RM3.9 million compared to RM3.6 million previous financial year, primarily due to lower material costs.


Graph: Ptaras's last 41 quarterly P&L

Financial Position

Ptaras's financial position is deemed very healthy as at 31/3/2017. Current ratio and gearing ratio stood at 0.21x and 0.21x respectively. Its cash in hand stood at RM163 million or RM1.00 per share.

Valuation

Ptaras (closed at RM3.87 last friday) is now trading at a PER of 16.6 times (based on last 4 quarters' EPS of 23.3 sen). If the cash in hand is deducted from the share price, then PER is lowered to 12.3 times. Based on this, Ptaras is deemed fairly valued.

Technical Outlook

Ptaras broke above the strong horizontal resistance at RM3.75 two weeks ago. This bulliah breakout could signal the begin of its next upleg.


Chart 1: Ptaras's weekly chart as at May 26, 2017 (Source: Shareinvestor.com)

Ptaras is still in its long-term uptrend line, with a possible hook-up in the monthly MACD. It certainly has come a long way since I first called a BUY on the stock in 2009 (here).


Chart 2: Ptaras's monthly chart as at May 26, 2017 (Source: Shareinvestor.com)

Conclusion
 
Based on satisfactory financial performance, attractive valuation & bullish technical outlook, Ptaras remains a good stock for long-term investment.

Note:

I hereby confirm that I do not have any direct interest in the security or securities mentioned in this post. However, I could have an indirect interest in the security or securities mentioned as some of my clients may have an interest in the acquisition or disposal of the aforementioned security or securities. As investor, you should fully research any security before making an investment decision.

Thursday, March 16, 2017

Gamuda: Next Upleg Could Be Starting Now

Gamuda broke above its recent high of RM5.06-5.07 to touch an intra-day high of RM5.17. This reaffirm the earlier hesitant breakout of the psychological RM5.00 mark and could well signal the continuation of Gamuda's prior uptrend.

Based on a 1-to-1 extension of the August 2016 retracement of RM1.50 (computed by deducting the low of RM3.50 from the preceding high of RM5.00), the target for this upleg would be RM6.50 (by adding RM1.50 to the breakout level of RM5.00).


Chart 1: Gamuda's daily chart as at Mar 16, 2017 (Source: MalaysiaStock.Biz)


Chart 2: Gamuda's weekly chart as at Mar 16, 2017 (Source: MalaysiaStock.Biz)

The breakout in Gamuda share price is also reflected in the breakout of the intermediate downtredn line for Gamuda-WE at RM1.29-1.30.


Chart 3: Gamuda-WE's daily chart as at Mar 16, 2017 (Source: MalaysiaStock.Biz)

Conclusion

Based on the above technical breakout, both Gamuda & Gamuda-WE could be good trading BUYs.

Note:

I hereby confirm that I do not have any direct interest in the security or securities mentioned in this post. However, I could have an indirect interest in the security or securities mentioned as some of my clients may have an interest in the acquisition or disposal of the aforementioned security or securities. As investor, you should fully research any security before making an investment decision.

Thursday, January 12, 2017

JAKS: Next Upleg Has Begun

JAKS is a pipe-maker and one of 3 Malaysian companies that has secured an IPP contract to build a power plant in Vietnam. The other 2 companies are Toyo Ink and Teknik Janakuasa (a subsidiary of Malakoff).

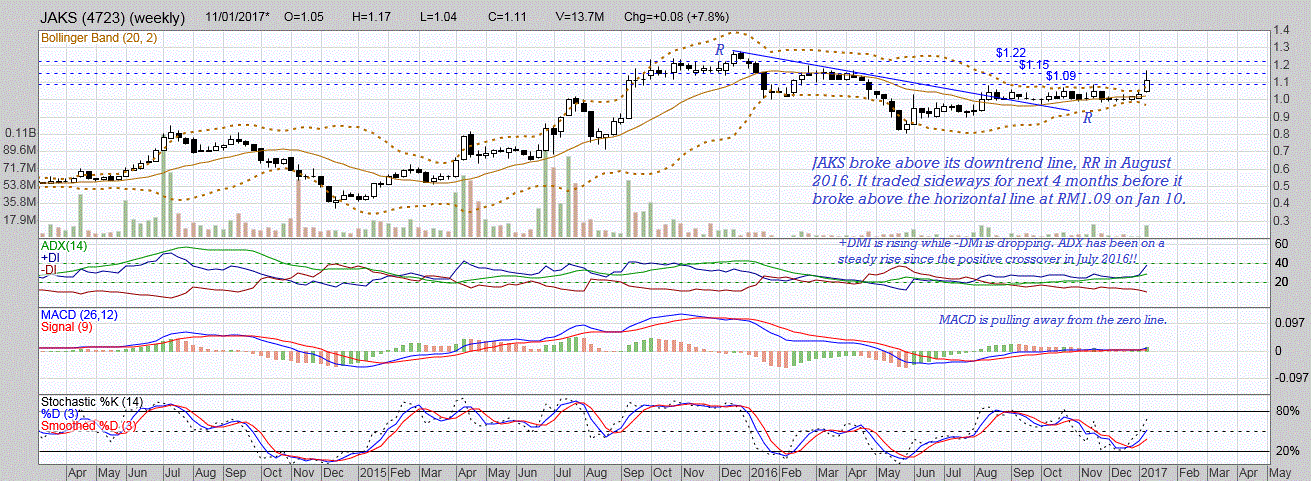
On January 10, PublicInvest Research called a BUY on JAKS witha fair value of RM1.50 (here). This has prompted the stock to rally yesterday above its horizontal line at RM1.09.

If JAKS can stay above the resistance-turned-support of RM1.09, then JAKS could be a good trading BUY.


Chart 1: JAKS's daily chart as at Jan 11, 2017 (Source: Chartnexus)


Chart 2: JAKS's weekly chart as at Jan 11, 2017 (Source: Chartnexus)

Note:
I hereby confirm that I do not have any direct interest in the security or securities mentioned in this post. However, I could have an indirect interest in the security or securities mentioned as some of my clients may have an interest in the acquisition or disposal of the aforementioned security or securities. As investor, you should fully research any security before making an investment decision.

Monday, October 31, 2016

Gadang: Earning Took A Heavy Knock

Result Update

For QE31/8/2016, Gadang's net profit dropped by 45% q-o-q or 20% y-o-y to RM17 million while revenue dropped by 58% q-o-q or 30% y-o-y to RM105 million. Gadang recorded lower revenue of RM105 million for the current quarter as compared to RM249 million in the preceding quarter mainly due to completion of various construction projects. In line with this, the Group’s profit before tax decreased from RM38 million in the preceding quarter to RM22 million in the current quarter.


Table 1: Gadang's last 8 quarters' P&L


Table 2: Gadang's segmental results for QE31/8/2016 & QE31/5/2016


Chart 1: Gadang's last 11 quarters' P&L

Valuation

Gadang (closed at RM2.92 last Friday) is now trading at a trailing PER of 8.4x (based on last 4 quarters' EPS of 34.8 sen). At this PER, Gadang is deemed fairly attractive.

Corporate Exercise


On October 7, Gadang announced a share split of 1-to-2; bonus share issue of 1-for4 (after the split) and bonus warrant issue of 1-for-4 (after the split) [here]. We have seen a few of these "massive" exercises in the past 1-2 years and they have generally been well-received by the market.

Technical Outlook

Last Friday, Gadang dropped sharply from RM3.29 to close at RM2.92, after the announcement of the latest quarterly result. Gadang is now hanging onto the 50-day SMA line support. If this support fails, its next support is at the horizontal line at RM2.58.


Chart 2: Gadang's daily chart as at Oct 28, 2016 (Source: Shareinvestor.com)


Chart 3: Gadang's weekly chart as at Oct 28, 2016 (Source: Shareinvestor.com)

Conclusion

Despite the surprisingly weak financial performance, Gadang is rated aHOLD based on fair valuation and positive long-term technical outlook

Note:

I hereby confirm that I do not have any direct interest in the security or securities mentioned in this post. However, I could have an indirect interest in the security or securities mentioned as some of my clients may have an interest in the acquisition or disposal of the aforementioned security or securities. As investor, you should fully research any security before making an investment decision.

Monday, October 24, 2016

Ekovest: No Longer A Hidden Gem

Background

Ekovest Bhd is involved in civil engineering and building works, owning of highway concessions and property development. Currently it owns 2 highway concessions, DUKE & DUKE 2 which collectively form the Duta-Ulu Kelang Expressway. The group will soon build, own & operate a third highway, the Setiawangsa-Pantai Expressway (SPE). 

In addition, Ekovest has fairly exciting prospect in property development. It has a few projects coming up, such as EkoGateway, EkoCheras and EkoTitiwangsa (which is a part of the KL River City project).


Picture: EkoGateway, EkoCheras & EkoTitiwangsa

Historical Financial Performance

Ekovest's top-line and bottom-line had been on an upswing since 2015. The increase in bottom-line was very sharp in FY2016 and it came from fair value adjustment from investment properties of RM113 million.


Chart 1: Ekovest's last 10 years' P&L

Recent Financial Result

Ekovest's quarterly result shows a group with relatively thin profit margin. In the past 10 quarters, the 4th quarters had shown bumper profits due to fair value adjustment from either investment properties or new financial liabilities (or refinancing of borrowings at lower rates).

The recent sale of a 40%-stake in DUKE and DUKE2 highway to EPF at a price of RM1.13 billion reveals just how much of the "hidden value" is in Ekovest balance sheet. The sale effectively valued Ekovest's stake in the DUKE highway at RM2.825 billion.


Table: Ekovest's last 10 quarterly P&L


Chart 2: Ekovest's last 10 quarters' P&L

Financial Position

As at 30/6/2016, Ekovest's financial position is deemed mixed, with current ratio at 1.9x and gearing ratio at 2.0x. The high gearing ratio is due to borrowings taken to finance its concession. The proceed from the sale of the 40%-stake in DUKE highway will help to reduce the gearing of the group until the start of the SPE project. It would enable the group to raise capital for the equity investment in the company undertaking the SPE project.

Valuation

Ekovest was valued at RM3.00 by UOB Kay Hian in September. I believe that the valuation to be fair. (Note: Ekovest is currently trading at RM2.18.)

Technical Outlook

Ekovest broke above the line, AB which connects the peaks for the past 14 years. Its next resistance is at the horizontal line at RM2.80 or its 2000 high of RM3.00-3.10.


Chart 3: Ekovest Matrix's monthly chart as at Oct 24, 2016 (Source: shareinvestor.com)

Conclusion

Based on exciting prospects, potential upside and bullish technical outllok, I rate Ekovest as a good Trading BUY.

Note:

I hereby confirm that I do not have any direct interest in the security or securities mentioned in this post. However, I could have an indirect interest in the security or securities mentioned as some of my clients may have an interest in the acquisition or disposal of the aforementioned security or securities. As investor, you should fully research any security before making an investment decision.

Tuesday, September 06, 2016

Kimlun: Good Results, Bullish Breakout

 Results Update

For QE30/6/2016, Kimlun’s net profit rose 41% q-o-q or 55% y-o-y to RM24 million while revenue was rose 5% q-o-q but dropped 5% y-o-y to RM246 million.

Revenue increased q-o-q due to higher revenue achieved by the manufacturing and trading division, which was in turn due to higher volume of sales of industrial building components to RAPID related projects. PBT rose q-o-q due to higher gross profit ( as a result of higher revenue & better gross profit margin of 16.4% as compared to 15.3% in QE31/3/2016); forex gain of RM2.12 million (as compared to a forex loss of RM3.21 million in QE31/3/2016) and increase of carriage outward of RM0.84 million (due to higher business volume). [Note: Kimlun's result for QE30/6/2016 was announced on August 29, 2016.]


Table: Kimlun's last 8 quarters' P&L accounts


Chart 1: Kimlun's last 14 quarters' revenue, profits & profit margins

Valuation

Kimlun (trading at RM2.04 as at 12:00pm) is now trading at a PER of 7.6 times (based on last 4 quarters’ EPS of 27 sen). At this PER, Kimlun is deemed fairly attractive.

Technical Outlook

Kimlun has broken to the upside of a pennant formation, ABCD at RM1.95 yesterday. Today it went above the psychological RM2.00 mark. Collectively, these breakouts suggest that Kimlun is continuing on its prior uptrend.


Chart 2: Kimlun's weekly chart as at Sep 6, 2016_11.15am (Source: ShareInvestor.com)
 
If we look at the monthly chart, we can see that the next resistance would be at the June 2013 high of RM2.05. Failure to break above this level could bring forth correction/consolidation at the RM2.00 mark. However, a break below the RM1.95 could convert this bullish breakout into a bull trap. In such a tricky situation, you should set a protective stop, say at RM1.90 (i.e. 5 sen below the breakout of RM1.95) to bale out in case the breakout turns into a trap.


Chart 3: Kimlun's monthly chart as at Sep 6, 2016_11.15am (Source: ShareInvestor.com)

Conclusion

Based on good financial performance, fair valuation & positive technical outlook, Kimlun could be a good stock for medium-term investment.

Note:

I hereby confirm that I do not have any direct interest in the security or securities mentioned in this post. However, I could have an indirect interest in the security or securities mentioned as some of my clients may have an interest in the acquisition or disposal of the aforementioned security or securities. As investor, you should fully research any security before making an investment decision.

Friday, July 22, 2016

Gadang: Earnings Continues to Grow

Background

Gadang Holdings Bhd ('Gadang') is involved in 3 main businesses: construction, property development and utility. The contribution by each division is outlined below:


Diagram: Gadang's segmental revenue & profit contribution for FY2015 & FY2016

Historical Financial Performance

Gadang's top-line and bottom-line grew strongly in the past 5 years.


Chart 1: Gadang's P&L for last 10 years

We can see that the growth came mainly from the construction and property development segments.


Chart 2: Gadang's segmental revenue & profit contribution for last 5 years

Recent Financial Results

For QE31/5/2016, Gadang's net profit increased by 21% q-o-q or 24% y-o-y to RM30.5 million while revenue grew by 41% q-o-q or 46% y-o-y to 249 million. Revenue increased q-o-q mainly due to higher progress billings for work done from on-going construction and property development activities. The higher revenue led to higher profits.


Table: Gadang's last 8 quarters' P&L


Chart 3: Gadang's last 10 quarters' P&L

Financial Position

Gadang's financial position as at 31/5/2016 is mixed. Its current ratio is adequate at 2.7x (or at 1.4x excluding property under development) while total liabilities to equity stood at 1.3x. The elevated gearing position is a concern which the company is addressing by raising funds by privately placing out 10% of its share capital (or 23.511 million shares) in April this year. Howevr, it may have to do more capital raising exercise as the gearing ratio is still elevated as at 31/5/2016.

Valuation

Gadang (closed at RM2.48 today) is now trading at a trailing PER of 6.8x (based on last 4 quarters' EPS of 36.42 sen). At this PER, Gadang is deemed fairly attractive.

Technical Outlook

Gadang broke above its long-term downtrend line, RR at RM0.90 in 2013. Its immediate resistance will come from the horizontal line at RM2.50-2.60.


Chart 4: Gadang's monthly chart as at July 22, 2016 (Source: Shareinvestor.com)

Another angle to look at the rise in Gadang;s share price is to draw an irregular upward channel on the price chart. The share price will soon be testing the upper line at RM2.50.


Chart 5: Gadang's monthly chart as at July 22, 2016 (Source: Shareinvestor.com)

Finally, a good way to see the potential of this stock is to place the price chart next to its profit trend. If Gadang can maintain its strong profit growth, its price rally may continue.


Chart 5: Gadang's monthly chart for past 10 years compared to its bottom-lines 

Conclusion

Based on good financial performance, reasonable valuation & positive technical outlook, Gadang could be a good stock for long-term investment.

Note: 
In addition to the disclaimer in the preamble to my blog, I hereby confirm that I do not have any relevant interest in, or any interest in the acquisition or disposal of, Gadang.

Thursday, June 09, 2016

Econbhd: A Good Specialist Construction Stock

Background

Econpile Holdings Bhd ('Econbhd') is involved in the provision of foundation and geotechnical works, civil engineering works, structure works and design and build packages.

Recent Financial Performance

Econbhd's profits have been rising gradually due to improved profit margins. Revenue, which was suffered a minor pullback in mid-2015, is again on a rising path.  


Table: Econbhd's last 8 quarters' P&L


Chart 1: Econbhd's last 9 quarters' P&L

Financial Position

Econbhd's financial position is deemed healthy as at 31/3/2016 with current ratio at 2.4x and total liability to equity at 0.6x. Debtor collection period stood at 184 days- comparable to Pintaras's 206 days.

Valuation

Econbhd (closed at RM1.39 yesterday) is now trading at a trailing PER of 11.8x (based on last 4 quarters' EPS of 11.76 sen). At this PER, Econbhd is considered fairly valued. However, Econbhd's earning grew by 61% compared to the preceding 4 quarters. Assuming it can achieve a CAGR of 20%, its PEG ratio would be less than 0.6x. This would make the stock quite attractive.

Technical Outlook

Econbhd broke above its triangle at RM1.15 in late March. With this breakout, Econbhd's upleg has begun.


Chart 2: Econbhd's weekly chart as at Jun 9, 2016 (Source: ShareInvetor.com) 

After the upside breakout, Econbhd consolidated between RM1.30 & RM1.40. It has just broken above this consolidation (an ascending triangle) at RM1.40. Is this a continuation of the upleg move or is it a fake breakout prompted by a dividend payment of 2.5 sen? We will have to wait and see.


Chart 3: Econbhd's daily chart as at Jun 9, 2016 (Source: ShareInvetor.com) 

Conclusion

Based on good financial performance & position, fair valuation & mildly bullish technical outlook, Econbhd could be a good stock for long-term investment.

Note:
In addition to the disclaimer in the preamble to my blog, I hereby confirm that I do not have any relevant interest in, or any interest in the acquisition or disposal of, Econbhd.