Wednesday, April 29, 2020

Push & Dump Operation in Progress

If you looked at the losers with volume, you would see the top 5 securities are CIMB, VIS, TECFAST, VIS-WB and SINOTOP. If you look at the charts for VIS, TECFAST and SINOTOP, you will notice huge volume accompanying the spike in share price yesterday.

We could well be witnessing push and dump operation here as retail investors or punters rush into the market under the belief that they have missed out on the cheap prices. Be careful! 

Chart: Sinotop, Tecfast & VIS's daily chart as at 29 April 2020 (Source: Kenanga BTX)


Sunday, April 26, 2020

Market Outlook as at April 24, 2020

Last week, FBMKLCI surpassed the 1400 to reach an intra-day high of 1429 on Monday (20 April, 2020). The next day, it dropped back sharply and broke its tentative uptrend line, SS at 1395. On Wednesday, FBMKLCI staged a rebound which did not carry thru on Thursday. MACD is turning down but has yet to cross below the MACD signal line. However, the stochastic indicator has crossed below the 50% mark on Friday to close at the 20%. This signals further weakness ahead for FBMKLCI.

Chart 1: FBMKLCI's daily chart as at April 24, 2020 (Source: Kenanga's BTX chart)

FBM70, which represents the medium-cap stocks, also broke its uptrend line, SS last Tuesday. Its MACD has yet to crossed below the MACD Signal line while the stochastic indicator is still above the 50% level. The same pattern of the price movement and the indicators can also be seen in FBMSCAP. This means that our market is seeing more trading activity as retail participation increased. This may not be a good sign in a challenging and extremely volatile market of today. I hope that traders would exercise careful discretion and avoid chasing stocks which have gone up substantially from their recent low, as the market begins to show signs of weakness. 


Chart 2: FBM70's daily chart as at April 24, 2020 (Source: Kenanga's BTX chart)


Chart 3: FBMSCAP's daily chart as at April 24, 2020 (Source: Kenanga's BTX chart)

Tuesday, April 07, 2020

My Selection of Stocks for Medium to Long-term Investment

I shared the following:

1) A list of sectors which are rated “overweight” by Kenanga, along with the top picks or preferred stocks in these sectors


2) A list of my preferred stocks covered by Kenanga, based on potential 1-year total return.


The 2 lists are aimed at investors with slightly different investment criteria. The first list would cater for investors who like to buy solid stocks in outperforming sectors. The second list would cater for investors who are looking to buy stocks with the highest return regardless of the sector the stocks are in.

You will see that some target prices are in red, which means that the stock target prices have been revised downward.

Good luck, and happy investing!

Monday, April 06, 2020

Market Outlook as at April 6, 2020 (Updated)

This afternoon, the Malaysian government announced support amounting to RM10 billion for the small & medium-sized enterprises, which would be badly hit by the Covid-19 outbreak. This is the second good news for the day.

The first good news was a smaller increase in total cases and total death for April 5- which could mark a temporary peak for Covid-19 cases & death. 


Chart 1: Daily increase in total cases and death from Covid-19

With the positive developments, our market may continue to recover. If the index can surpass the 1350-1353 level, we might attempt to climb back above the long-term uptrend line at 1400-1405. At this point, I doubt the index can climb above this resistance as the Covid-19 outbreak and its economic impact are just beginning to be felt. Based on these concerns, I think we should remain cautious in our investment plan.


Chart 2: FBMKLCI's daily chart as at April 6, 2020 (Source: Malaysiastock.biz)


Chart 3: FBMKLCI's monthly chart as at April 6, 2020 (Source: Malaysiastock.biz)

(UPDATE) Overnight, US markets rallied with DJIA rising 1628 points (or, 7.7%) to 22680 and Nasdaq rising 540 points (or, 7.3%) to 7913. The good point to note is that yesterday's market highs & closes for DJIA and Nasdaq were both higher than what were recorded on March 26. This is a sign of a tentative short-term uptrend move, where you have a higher "low" (or, trough) earlier and now you have a higher "high" (or, peak). The higher "low" was on April 1-3 as compared to previous low on March 18-23, while the higher "high" was made yesterday as compared to previous high on March 26. While this means that the rally may have legs room to go, the immediate resistance is just overhead at the high recorded on March 13. So, tonight will be an interesting night for US markets.

Chart 4: DJIA's daily chart as at April 6, 2020 (Source: Stockcharts.com)
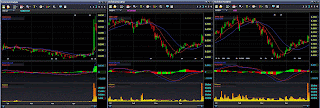
Chart 5: Nasdaq's daily chart as at April 6, 2020 (Source: Stockcharts.com)