Friday, September 29, 2006

The drop in Crude Oil has benefitted some

The drop in the price of Crude Oil has benefitted the airlines as well as other transportational stocks. Both airlines listed on Bursa i.e. MAS and Airasia have seen their share price recovering substantially in the past few days.

MAS, which was trading below RM3.00 at the end of August, has rallied to close at RM3.50 yesterday. From the weekly chart (Chart 1), we can see that MAS is likely to have commenced on its uptrend after breaking above the RM3.00/10 level.


Chart 1: MAS' weekly chart as at September 28


Chart 2: MAS' daily chart as at September 28

Airasia has similarly staged a strong rally, which saw the share price breaking out of its bottoming range between RM1.30-1.40, to reach a high of RM1.64 on September 22 (see Chart 3 & 4 below).


Chart 3: Airasia's daily chart as at September 28


Chart 4: Airasia's weekly chart as at September 28


Airport has also recovered although at a more subdue pace. Its share price has jumped 16 sen to RM2.01 as at 4.00 p.m. today (see Chart 5 below).


Chart 5: Airport's weekly chart as at September 28

Finally, PLUS- which has suffered a drop in the growth rate of its traffic volume because of higher gasoline prices- has also seen its share price recovering.


Chart 6: PLUS' weekly chart as at September 28

Thursday, September 28, 2006

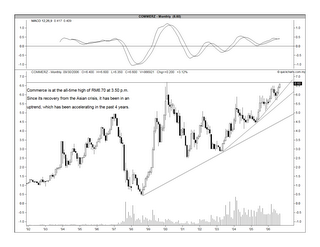
Commerce has just touched its all-time high

Commerce is at RM6.70 at 4.00 p.m., which is its all-time high recorded in February 2000 (see Chart 1 below). Is it going to surpass that level & make a new all-time high? The Commerce-CA, which has an exercise price of RM4.59, was trading at RM1.95 at 4.00 p.m., which represents a discount of 2.4% to the underlying share. The investors or punters appear not too convinced that the rise in the share price of Commerce can sustain. The weekly chart of Commerce-CA is appended as Chart 2. We will have to wait & see what will happen next.


Chart 1: Commerce's monthly chart as at September 27


Chart 2: Commerce-CA's weekly chart as at September 27

Juan posted higher net profit for QE31/7/06

Juan's net profit for QE31/7/06 increased 33.0% q-o-q or 66.9% y-o-y to RM5.4 mil. Its turnover has increased by 4.1% q-o-q or 4.4% y-o-y to RM60.3 mil. The big jump in net profit was attributable to the exceptonal gain on disposal of a subsidiary company of RM1.57 mil. If this gain is excluded, Juan's net profit would be lower than the preceding quarter's net profit by 5.6% but still 18.5% higher than the net profit for last year's corresponding quarter (see the table below).


Based on the last quarter's net profit (excluding the exceptional gain) of RM3.84 mil, Juan's annualized net profit would come to RM15.36 mil. EPS would be about 28.9 sen. Using this morning clsoing price of RM1.08, the stock is trading at a PE of 3.7 times. This is fairly attractive. [You may recall that I've highlighted this stock as a good long-term investment in July.]

Juan's share price went up 9.5 sen to close at RM1.08 at the end of the morning session. This has resulted in Juan share price breaking out of its descending triangle at the RM1.03 level. If the share price can sustain above the RM1.03 level, there is a good chance that the stock may go up further.


Chart: Juan's weekly chart as at Sep 27

Wednesday, September 27, 2006

Sunway Inc broke its RM0.40 strong horizontal support

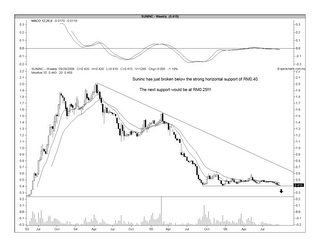
Sunway Inc (Suninc) has broken below the strong horizontal support of RM0.40 today. If there is no recovery within the next one or two days, the share price may slide further. The next horizontal support is at RM0.25!!! This stock is in a very dangerous position.

There is no news other than the recent news that its associate, Sunway Infra (owner of the SILK highway concession) is in the midst of a restructuring scheme, which involved a new shareholder & possible capital injection from Suninc. For more details, go here.

From the weekly chart (Chart 1), we can see that Suninc's strong horizontal support of RM0.40 was still supporting the stock up to yesterday. This was broken today & the next support is at RM0.25. Daily chart (Chart 2) is also attached.


Chart 1: Suninc's weekly chart as at Sep 26


Chart 2: Suninc's daily chart as at Sep 26

Hiaptek reported strong growth in topline & bottomline for QE31/7/06

Background

Hiap Teck Venture Bhd (Hiaptek) is involved in the manufacture of steel pipes & other related products as well as in the distribution of hardware and building materials.

Recent Financial Result


Hiaptek’s turnover increased 22.3% q-o-q or 107.2% y-o-y to RM341.8 mil. Its net profit jumped 75.7% q-o-q or 337.4% y-o-y to RM19.1 mil.

Valuation

Based on the last quarter’s EPS of 5.87 sen, Hiaptek’s full year EPS is projected to be 23.5 sen. As the share closed at RM0.885 yesterday, Hiaptek is now trading at a PE of 3.8 times.

Technical Outlook

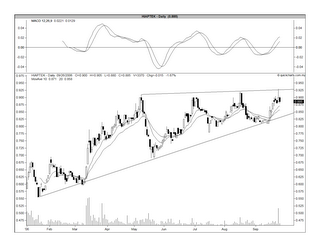
Hiaptek has broken above its medium-term downtrend line last week at the RM0.88 level. The share price is trapped in an ascending triangle with the upside breakout at RM0.92/93 level. See the weekly chart (Chart 1) below.


Chart 1: Hiaptek's weekly chart as at Sep 26


Chart 2: Hiaptek's daily chart as at Sep 26


Conclusion

Based on very attractive valuation, nice technical set-up & good outlook for the demand for steel pipes from the water sector as well as oil & gas sector, Hiaptek is a good long-term investment.

Integrax has a new exciting venture

Background

Integrax is currently the owner-operator of 2 port facilities- Lumut Maritime Terminal & Lumut Bulk Terminal. The group has been looking to diversify geographically without much success.

New Venture

Integrax has just announced plan to venture into the nickel mining business by buying a 20%-stake in the Philippines-based Platinum Group Metals Corp (PGMC) for USD12 mil.

PGMC is involved in the mining of nickel ore. It currently has one mine in Narra, Pahlawan, which has 4.2 mil wet metric tonnes of nickel ore. It will commence mining operation on a second & third nickel mines in Pahlawan & Isabela, Luzon within the next 6 months. In addition, it will start mining limonite & saprolite on Mindanao by 1st quarter 2007. It will also convert & rehabilitate a ferro-chrome smelter in Manticao, Mindanao into a ferro-nickel, which is scheduled to commence operation in late 2006. For more information, see the report in The Edge dated Sep 26, 2006 (here).

iCapital has a research report which shows that the new venture's projected payback period to be of less than 5 years, based on a conservative price of primary nickel of USD12,000 per tonne (i.e. 5-year weighted average price). This venture will boost Integrax's net profit by 50%.

Recent Financial Result


Based on the above table, we can see that turnover has increased 7.0% q-o-q or 5.4% y-o-y to RM23.1 mil. Net profit at RM9.8 mil represents an increase of 47.6% y-o-y from RM6.7 mil but declined of 6.5% from RM10.5 mil recorded in the preceding quarter. The latter was attributable to higher tax rate for QE 30/6/06 as the pre-tax profit for the latest quarter has in effect increased by 6.1% from RM13.4 mil to RM14.2 mil.

Valuation

Based on the latest quarterly result, Integrax's annualized EPS is about 13.1 sen. Using yesterday's price of RM0.785, the stock is trading at a PE of 6.0 times. That's fairly attractive for a defensive stock.

If the new nickel venture can boost net profit by 50% (as projected by iCapital), then the adjusted EPS would be about 19.5 sen. At this earning, the stock would be trading at a PE of 4.0 times only. Of course, we must bear in mind that the new venture has a different risk profile from Integrax's existing port business.

Technical Outlook

From the weekly chart (Chart 1), we can see that Integrax has broken above its medium-term downtrend line in July. It is being supported by a short-term uptrend line (current level RM0.65) & a break above the strong horizontal resistance of RM0.79/80 could be the beginning of a more sustained rally for this stock. We can see that the share price has just surpassed that level yesterday. The daily chart is also appended here as Chart 2.


Chart 1: Integrax's weekly chart as at Sep 26


Chart 2: Integrax's daily chart as at Sep 26


Conclusion

Since the break of the strong resistance of RM0.79/80 is at hand, Integrax could be in for an exciting rally.

Tuesday, September 26, 2006

Astro-CA has broken out of its trading range

Background

Astro-CA (closed at RM0.21 as at September 25) is the call warrant of Astro (closed at RM4.98 as at September 25). 28 mil Astro-CA was issued at an issue price of RM0.225 on May 22, 2006 by CIMB. The call warrant has an exercise price of RM4.65; an exercise ratio of 2 warrants for 1 share; & will expire 8 months from the date of issue.

Technical Outlook

Astro-CA has broken out of its trading range of RM0.145 & 0.18 on the upside on September 21. It went to a high of RM0.26 the following day. It is now in a correction phase. As long as it can stay above RM0.18, the breakout is valid & this could potentially lead to further upside for this call warrant.


Chart 1: Astro-CA's daily chart as at September 25

Astro’s recent financial performance

Astro has recently announced its results for QE 31/7/06. Its turnover increased by 8.8% q-o-q or 14.0% y-o-y to RM569 mil. The increased turnover was attributable to higher subscription revenue from the TV segment (with subscribers’ base increasing from 1.76 mil as at 31/7/05 to 1.99 mil as at 31/7/06) as well as higher advertisement revenue from both the TV & radio segments.

Net profit of RM73.0 mil is higher than the net profit of RM66.0 mil reported in the same quarter last year but lower than the preceding quarter’s net profit of RM90.5 mil. The higher net profit for QE30/4/06 was partly due to the reversal of accruals of RM19.9 mil in relation to the cost of set-up boxes. Meanwhile, net profit has continued to grow due to improved EBIT margin (due to lower subscriber acquisition cost) & higher interest income; which were offset partially by losses from its Indonesian venture of RM15.2 mil (see the Table below).


Technical Outlook of Astro share

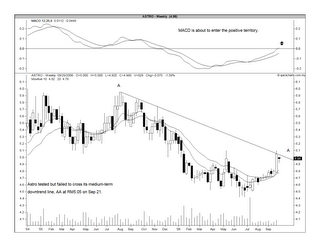
From Chart 2 below, we can see that Astro is still in a medium-term downtrend with resistance at RM5.05. The recent share price run-up saw a failed test of this downtrend line on September 21.


Chart 2: Astro's weekly chart as at September 25

Conclusion

Over the next few days, we can expect Astro-CA's price to consolidate like the price of Astro share. As long as the price of the call warrant can remain above the RM0.18, a recovery in the price of the share is likely to lead to quick improvement in the price of the call warrant.

As always, any investment in call warrants has to be tracked regularly and if it doesn't work out as envisaged, you must be prepared to sell off this investment quickly before further loss in value due to the passage of time. This call warrant will expire in January 2007.

Wednesday, September 20, 2006

Courts reported a big loss for QE30/6/2006

Courts has recently announced its result for QE30/6/2006. Its turnover dropped 11.3% q-o-q or 4.1% y-o-y to RM127.9 mil. Net loss jumped to RM12.0 mil from RM0.02 mil recorded in the immediately preceding quarter or from RM3.4 mil reported in the corresponding quarter last year (see Table 1 below). The poor result was attributed to lower credit sales & service charge income in Malaysia & higher group operating expenses such increase in bad debt charge and forex losses.


Table 1: Courts' quarterly results for QE30/6/2006 compared

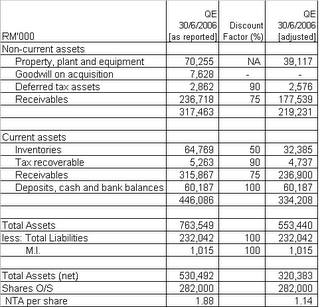
As noted in my first post on Courts, the proper valuation method to adopt is the break-up valuation. I've re-evaluated Courts again using the latest balance sheet as at 30/6/2006. Despite the poorer result, the fair value is about the same at RM1.14 per share (see Table 2 below).


Table 2: Courts' value as per break-up valuation method


Technical outlook

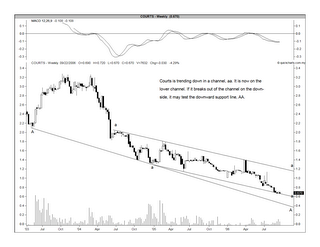
As noted in my second post on Courts that a break of the then-prevailing horizontal support of RM0.80/82 could lead to lower prices. This has indeed happened. A look at the weekly chart (Chart 1) shows that Courts is now at the lower boundary of a downward channel. This boundary should support the share price at RM0.65 level. A break of the downward channel could see the share price going to the long-term downward support line at RM0.45. I see this scenario as not likely & that the channel should hold.


Chart 1: Courts' weekly chart as at September 19


Chart 2: Courts' monthly chart as at September 19


Conclusion

The share is now trading at RM0.67, which is at a discount of 41% to the fair value (of RM1.14) derived from our break-up valuation. The latter is approximately 60% of the NTA per share (of RM1.88) based on Courts' latest balance sheet as at 30/6/2006. An investment at this level is fairly safe as it is a deep discount to the current NTA of the share.

Finally, a decision is expected soon regarding the disposal of Courts plc's majority stake in Courts Mammoth. This disposal would almost certainly lead to a MGO at the transaction price that will be agreed between Courts plc's administrator & the buyer.

Tuesday, September 19, 2006

BJToto-CA is about to make a new high

BJToto-CA (closed at RM0.315 as at September 18) is the call warrant of BJToto (closed at RM4.66 as at September 18) issued on July 11, 2006 by CIMB. A total of 25 mil BJToto-CA were issued at a issue price of RM0.30. The exercise price is RM4.43 & the expiry date is 8 months from the date of issue.

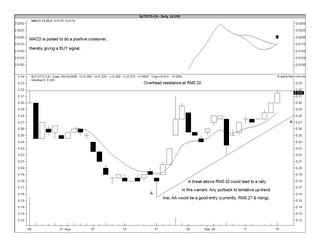
From Chart 1 below, we can see that the price of BJToto-CA has touched its high of RM0.32 recorded on its first day of trading on July 24. BJToto-CA would be considered technically bullish if it can surpass the RM0.32 level convincingly.


Chart 1: BJToto-CA's daily chart as at September 18

However, I must point out that one of the possible reason for BJToto (the underlying share)'s current strength could be the upcoming dividend of 12.5 sen, which will go "ex" on September 22. As a result of the rise in the underlying share, the call warrant has also risen accordingly. Unfortunately, the holders of the call warrant are not entitled to any dividend.

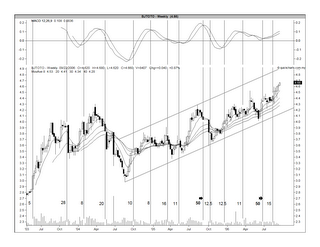
From Chart 2 below, you will see the track record of BJToto's dividend payment for the past 3 years noted down at the bottom of the price chart. You may note that BJToto has paid out dividend totaling 46 sen for calender year 2004; 52 sen for calender 2005; and 25 sen for the year todate. In addition, it has also made 2 capital repayments of 50 sen each; once in Sep 2005 & again in July 2006.


Chart 2" BJToto's weekly chart as at September 18 (with dividend payments [in sen] noted at the bottom of the chart)

Many analysts are calling a BUY on BJToto because of its steady stream of dividend. Based on last calender year's dividend of 52 sen, the stock's dividend yield is 11.16% (using yesterday's price of RM4.66).

It is noticeable that the call warrant of an underlying share that pays good dividend would normally trade at very little premium. The reason could be because investors tend to prefer the underlying share to the call warrant. The same can also be observed in BJToto-CA, which trades at a premium of 1.8% only. Nonetheless, a call warrant would move in the same direction (or, trend) like that of the underlying share.

The recommendation for BJToto-CA is strictly based on technical consideration & for trading purposes only. If you are worried that the current technical set-up may have been skewed by the upcoming dividend payment, then you should wait until the dividend payment's ex-date has passed before committing. As always, any investment in call warrants has to be tracked regularly and if it doesn't work out as you have envisaged, you must be prepared to pull the plug fast to prevent further decay due to the passage of time.

Monday, September 18, 2006

MPlant broke above it medium-term downtrend

Business Activities

Malaysian Plantations Bhd (“MPlant”) is mainly involved in the provision of financial services such as commercial banking, financing, merchant banking, stock broking, unit trust management & investment advisory services. The main subsidiary is Alliance Bank Malaysia Bhd.

Recent Financial Performance


MPlant has gone through a period of consolidation in the first half of FYE31/3/2006 (after Temasek has taken over the driving seat in the company). A spring clean of its books has resulted in loan loss provision and impairment loss of RM478 million being booked into its accounts during that period. The impact was very noticeable for 2Q2006, which ended 30/9/2005, where the specific provision and impairment loss of RM415 million were recorded & this has resulted in a net loss of RM229.9 mil.

In 4Q2006, which ended 31/3/06, MPlant has again reported a net loss of RM11.6 mil, which was “mainly due to lower net interest income and other operating income, coupled with higher operating expenses and loan allowances.”

For 1Q2007, MPlant has reported a 65.5%-jump in its net profit y-o-y to RM39.6 mil which was achieved on the back of a 9.4%-increase in turnover to RM360 mil. The turnover recorded in this latest quarter is one of the highest in the past 8 quarters (except for 4Q2005). The company attributed the improved performance to “higher net income, including net income from Islamic Banking business which improved by RM11.2 million or 73.2% and lower specific allowances being made coupled with stronger recoveries for the period under review.”

Valuation

Based on the EPS for 1Q2007 of 3.39 sen, MPlant’s annualized EPS for FY2007 is about 13.56 sen. Based on its closing price of RM2.16 as at September 15, MPlant is now trading at a PE of 16 times. This is not a cheap price to pay for a small bank in Malaysia.

If MPlant is subject to a speculative takeover play (which is unlikely given that Temasek has plans for MPlant), then the likely valuation is the 'Price to Book' method. Using this method & assigning a multiple of 1.95 times (same as what Commerce paid for Southern Bank), then MPlant may be valued at RM3.00 (i.e. RM1.54 multiplied by 1.95). As such, some may still find MPlant to be inexpensive at the current level.

Technical Picture

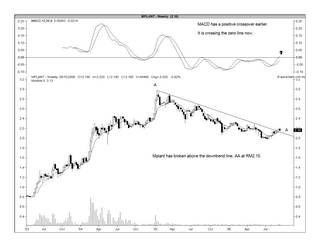
From Chart 1 below, we can see that MPlant has clearly broken above the downtrend line at the RM2.15 level. With this breakout, it is now fairly safe to buy into MPlant.


Chart 1: MPlant's weekly chart as at Sept 15

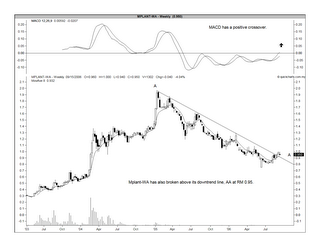
In addition to the share, we can also look at MPlant-WA (closed at RM0.95 as at September 15). This warrant has an exercise price of RM1.21 and expiring in June 2007. Based on the closing price on September 15, the warrant is trading at its intrinsic value without any premium. This could be attributable to its short remaining tenor to expiry. The technical outlook for the warrant is similar to that's of the mother share, which is a positive breakout.


Chart 2: MPlant-WA's weekly chart as at Sept 15

Recommendation

Based on the above, I believe MPlant is a safe LT investment. For those who like some leverage, you can look at the warrant. But, be forewarned that the warrant shall expire in 10 months' time.

Sunday, September 17, 2006

Linkfest time

For this week, I have the following links for your reading:

1. In recent years, private equity funds have started springing up to cater for sophisticated wealthy investors. What these funds do- at outrageous fees- are to look for undervalued public companies, or promising new companies looking to go public, and buy them up at a price higher than the current stock-market price (sometime, at a premium of up-to-20%). These acquisitions are often financed by the issuance of junk bonds, at high interest rates. The new owners would often offer fat new pay packages to the managers of the company they've just acquired, to give them even greater incentive to maximize the value of the company, so it can be taken public again.

This development raises troubling questions about the fiduciary duties of public companies’ managers. Who do they owe their allegiance to: the existing public shareholders or the potential new owners? Read more about it here.

2. Most investors are fairly confused by the on-going market correction. Are investors disappointed with the recent Budget? Or, is it a case of “buying on rumor and selling news”? Well, it could be something simpler; something to do with the time of the year that we’re operating in. It seems that September has historically been “the most difficult month for stocks”. That’s the bad news. The good news is “the strongest upward bias in stocks has historically occurred during the November-January time frame”. Go here for the chart that says it all.

3. Investing is hard. It requires a lot of hard work & discipline and a strong self-belief system. On top of all these, you need to have a fair dose of humility, that sometime you could still get it wrong. So, when someone comes along & starts to show you that you can improve your investing skill by “paper-trading” as well as using tools of “back-testing”, you could be telling yourself “This is it! This is what I've lacked all these years.” Well, think again.

4. The Capital Spectator takes a look at a research paper published on the St. Louis Fed's web site entitled “When Do Stock Market Booms Occur? The Macroeconomic and Policy Environments of 20th Century Booms”, which makes “a timely reminder that equity bull markets tend to thrive under a particular set of conditions…that appear to be on the wane these days”. "We find that booms generally occurred during periods of above-average economic growth and below-average inflation, and that booms typically ended when monetary policy tightened in response to rising inflation," write authors Michael Bordo (an economics professor at Rutgers) and David Wheelock (an economist at the St. Louis Fed). "Most booms were procyclical, arising during business cycle recoveries and expansions, and ending when rising inflation and tighter monetary policy were followed by declining economic activity.” Read more about here.

5. Despite the positive price action in the US equity market, Contra Hour still remains "cautiously pessimistic". Why? Read about it here.

6. Bob Bronson of Bronson Capital Markets Research shares the same view. Read about it here.

7. From Hello Trader, we have a set of 12 trading rules
to guide you in your trading:
Rule # 1: Let your winners run, cut your losers short
Rule # 2: Don’t add to losing positions
Rule # 3: Don’t fight the trend / tape
Rule # 4: Buy strength and sell weakness, not the other way around.
Rule # 5: Trade your personality
Rule # 6: Plan your trade and trade your plan
Rule # 7: When the reason for entering a trade is no longer valid, get out
Rule # 8: Don’t be the weak money
Rule # 9: Keep a trade diary
Rule # 10: Never risk more than 5 percent of your account equity on a trade
Rule # 11: Risk a fixed percentage of capital on every trade
Rule # 12: Focus on market selection


That's all for this week. Have a good weekend.

Friday, September 15, 2006

Plantation broke its short-term uptrend line

I've pointed out in a post
dated September 7
that the Plantation index was about to test the short-term uptrend line (the critical level then was 3688) & it might break below the uptrend line. The index did just that (see Chart 1 below).


Chart 1: Plantation's daily chart as at Sep 14

I believe that the Plantation index has put in a temporary top. Despite yesterday (Sep 14)'s healthy rebound of 83.82 points to close at 3575.78, the next few weeks would likely to see the index drifting lower until it tests the medium-term uptrend line at the 3200 level (see the weekly chart, Chart 2 below). It is likely that a rebound would happen at this 3200 level but how strong would this rebound be? If this medium-term uptrend line were to be broken, then the next support would be at the 2600-2700 level, given by the long-term uptrend that dates back to Mar 2001 (see the monthly chart, Chart 3 below).


Chart 2: Plantation's weekly chart as at Sep 14


Chart 3: Plantation's monthly chart as at Sep 14

As the Plantation sector is dominated by palm oil companies and the current plantation rally is driven by a rally in the price of CPO, it is good to take a look at CPO Futures. In an OSK Securities report dated Sep 11, the technical analyst wrote:

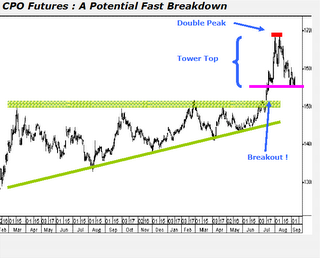
The major breakout rally of CPO Futures from the giant “Ascending Triangle” was capped at the RM1660 / tonne level, which has been tested twice lately. A “Double Peak” formation has been constructed as a result of the market action. The market has been trending down since then. While it may look like the CPO Futures has been well supported by the RM1555 / tonne level, another bearish reversal pattern of “Tower Top” has just been detected.

It is the first time we bring up the “Tower Top” candlestick pattern in this column. “Tower Top” is a type of bearish formation which looks like a “V” shape tower. The formation has sharp rally on the left side of the tower and another sharp retracement on the other side. The bearish reversal pattern will be completed if the foundation of the tower is cracked, or the RM1,555/ tonne level is this case. We expect a quick breakdown from the RM1555 / tonne level which would provide a “swing trading” opportunity for the CPO Futures traders. Cut-loss point is pegged at above the RM1,555/ tonne level. Should the RM1,555/ tonne level is violated decisively, look for the RM1,500-RM1,520/tonne zone as the immediate strong support floor. The resistance zone was previously a formidable upside hurdle for the market.

All in, the immediate technical outlook of the CPO Futures is now aligned with a bearish bias. Nevertheless, mid-term outlook of the CPO Futures is still bullish as long as the market will not retrace back below the support line of the “Ascending Triangle”.


The critical RM1,555/ tonne level has in fact been violated. CPO Futures for the month of September closed yesterday at RM1,526/tonne.


Chart 4: CPO Futures as at Sep 8

Finally, the trend of CPO Futures is partly reflective of the trend for commodities as a whole. On that count, we can say that the medium-term outlook for commodities is not good. From Chart 5 below, you can see that CRB index's medium-term uptrend has been broken.


Chart 5: CRB's weekly chart as at Sep 14

In conclusion, you may want to use any rebound in the Plantation sector to reduce your position in that sector. Entry into this sector can be deferred until the Plantation index has found a convincing support at either the medium-term or long-term uptrend line. You should also look at the technical outlook for CPO Futures to confirm your technical reading of the Plantation index.

Thursday, September 14, 2006

ZA-OSKSB- What is it?

In last weekend's issue of the Star Bizweek, you will find a good article entitled "Modifying to increase interest" contributed by Allan Voon, which touches on the attractiveness of buying ZA-OSKSB.

Allan explained that ZA-OSKSB actually stands for OSK Big 20 Basket Warrant. This basket warrant is "a tracker certificate (which is) another form of securitized derivative which belongs to the same family as covered warrant. As the exercise price of (this basket) warrant is close to zero (actually, it is a negligible 1 sen), this is no different than just buying the underlying share."

Based on the closing price as at September 13, 2006, 10 lots of ZA-OSKB [or 1000 units] is theoretically worth about RM1,013. This amount will yield a gross dividend of about RM45.85 or net dividend of RM24.76. Net dividend is arrived at by deducting 28% tax and thereafter 25% service charges levied by the management. See the table below.


While 10 lots of ZA-OSKSB [or 1000 units] is theoretically worth about RM1,013, the market is valuing it at RM900 only. This represent a discount of 11.2% to the theoretical value. In addition, these 10 lots of ZA-OSKSB [or 1000 units] would yield a net dividend of RM24.76, giving a fairly decent dividend yield of 2.75%.

Some believe that ZA-OSKSB is trading at a big discount because of its current mode of exercise. This warrant can only be exercised at the expiry date. OSK had proposed to modify the mode of exercise whereby this warrant can be exercised on a number of pre-determined occasions. In the article, it was stated that "the Securities Commission has already approved its application to modify the style of exercise and would be informing its warrant holders at a later date".

I believe that the immediate effect of this modification exercise is the narrowing of the discount that the market asks for owning ZA-OSKSB. Even if this warrant does not trade at a discount, it is still a very interesting investment instrument that allows the holder to invest in a diversified portfolio of the top 20 blue chips in Malaysia at a very small upfront cost.

Mieco- a turnaround story in the making

Business Activities & Recent Development

Mieco Chipboard Bhd ("Mieco") is involved in the manufacturing of chipboards.

Mieco has completed its new plant, which led to an increase in its production capacity from 300,000 cu meter p.a. to 940,000 cu meter p.a. The new plant will also enable the company to produce chipboard that meets the European standard i.e. the highest international standard. However, the expansion also coincided with similar expansion by other chipboard manufacturers in Malaysia & around the region (especially, Thailand), which led to a sharp drop in the selling price (due to a jump in supply) & under-utilization of production capacity.

Recent Financial Performance


From the above table, you can see that Mieco’s financial performance was badly affected since QE 30/6/05 when the new plant was completed. The poor selling price coupled with the higher overhead has led to Mieco reporting net losses for 3 quarters i.e. QE31/3/06, QE 31/12/05 & QE 30/9/05.

Mieco has finally turnaround in the last quarter, QE 30/6/06 with a net profit of RM2.9 mil (as compared to a loss of RM0.3 mil in QE 31/3/06) achieved on the back a turnover to RM86.1 mil, which is 27% higher than the immediately preceding quarter’s turnover of RM 68.0 mil. The better result was attributed to improved selling price and increased sale volume as chipboard has benefited from higher selling price of plywood. The sharp rise in the prices of plywood is expected to continue due to sustained rebound in Japanese demand & fall-off in Indonesia logs & plywood supply.

Valuation

Assuming that the performance of Mieco fro the near future shall be similar to that of QE 30/6/06, then the annualized EPS will amount to 5.52 sen. Based on this & Mieco’s closing price of RM0.93 as at Sep 13, the company is now trading at a PE of 16.8 times. This is fairly high but we must bear in mind that future earnings could be better than the last quarter’s earning. In addition, the share price should be well supported by Mieco's high NTA per share of RM1.69. This give the stock a Price to Book of 0.55 times.

Technical Outlook

From Chart 1 below, you can see that Mieco's share price hit a high of RM3.16 in w/e Mar 12, 2004. Thereafter the stock started to slide. The downtrend accelerated twice; first from December 2004 and then from August 2005. Since January this year, Mieco seemed to have found a support at the RM1.00 level & traded sideway for 8 months. During that period, its prices were range-bound between RM1.00 & RM1.20. 2 weeks ago, Mieco broken below the RM1.00.


Chart 1: Mieco's weekly chart as at Sep 12


From Chart 2 below, you can see that RM0.91/92 level is a good horizontal support level & if that failed, the next levels will be RM0.80 & ultimately, RM0.70.


Chart 2: Mieco's monthly chart as at Sep 13


Weaknesses noted

2 clear weaknesses have been noted:

(1) The technical picture is not good since it has broken below the strong support of RM1.00.
(2) The turnaround is based on 1 quarter of profitable result. It is possible that this performance may not continue.

Recommendation

Based on improving fundamental & attractive price to book, I would recommend Mieco as a LT investment. Slow accumulation would certainly be adviseable as the technical picture is still bearish.

Wednesday, September 13, 2006

Bandaraya testing the strong horizontal support of RM1.00

Bandaraya's share price has dropped yesterday & today, probably in reaction to the current market weakness. It is likely to test the strong horizontal & psychological support of RM1.00 (see the Chart below). I expect this support to hold & it may present a good BUY opportunity.


Chart: Bandaraya's daily chart as at Sep 12

Bandaraya has announced its financial result for QE30/6/06 recently. Its net profit has increased by 70% q-o-q to RM6.0 mil on the back of a 31%-increase in turnover to RM150.4 mil. The improved net profit is attributable to the higher sale of its property division as well as its chipboard manufacturing division (carried on by Mieco). See the table below for Bandaraya's last 8 quarterly result.


Based on the annualized EPS of 5.04 sen (using the EPS for QE30/6/06) & the closing price of Sep 12 of RM1.05, Bandaraya is now trading at a PE of 21 times. While this PE multiple looks high, I believe that it is likely to drop to a more moderate level due to the turnaround in Mieco & the good sale of its new property launch in Bangsar (known as "One Menerung"). Also, you may notice that the share is currently trading at a Price to Book of 0.34 times only. So, take a look at Bandaya.

Tuesday, September 12, 2006

Airasia has a bullish breakout

Airasia has been moving in a sideway manner since breaking above its recent downtrend on August 7. The RM1.40/41 horizontal resistance has checked 3 recent advances but this morning, it was overcome. If Airasia can hold above this RM1.40/41 resistance-turned-support, then there is a good chance that Airasia is commencing an uptrend move (see the chart below).


Chart: Airasia's daily chart as at Sep 11

Monday, September 11, 2006

KLCCP & Kassets- Error noted

On August 30, I've posted a piece entitled KLCCP & Kassets- Which is more attractive?

Subsequently, I've discovered that the background information for Kassets was incorrect. In the earlier post, I have stated:

Kassets is the owner of the Mid-Valley Megamall as well as a few other buildings located next to it. In total, the properties owned by Kassets are valued at RM1.68 billion (valuation was carried out in QE 31/3/2006). While the value of Kassets’ properties owned maybe smaller, this will be given a boost when the new phase of Mid-Valley Megamall is completed in 2008.

I have learned from the current issue of The Edge newsletter [w/e Sep 11] that Kassets owns only the Mid-Valley Megamall. The other components of the Mid-Valley project such as the 4-star Boulevard Hotel, 3-star Cititel Hotel, Menara IGB, Centrepoint North & South office towers plus the Phase 2 of the Mid-Valley project such as the upscale shopping mall (known as The Garden), another 2 office blocks, a 5-star hotel & a block of upmarket service apartment are all held directly under Kassets' parent company i.e. IGB.

I regret making this error & will strive to do better in the future.

Road Builder is likely to test its medium-term uptrend at RM2.20

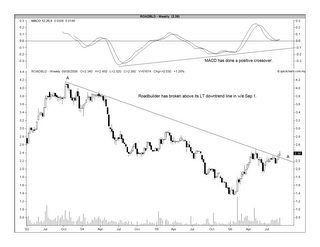
Road Builder's share price, like Gamuda's, has also dropped a bit today. From Chart 1 below, we can see that the stock has broken above its long-term downtrend line at the RM2.30/33 level in w/e Sep 1. It is also in medium-term uptrend, with support at the RM2.20 level (see Chart 2 below). Today, the stock dropped to a low of RM2.24 before closing at RM2.30 at the end of the day. If the stock can hold above the RM2.20 level, it would be a good long-term BUY.


Chart 1: Road Builder's weekly chart as at Sep 9


Chart 2: Road Builder's daily chart as at Sep 9

Gamuda has just tested its ST uptrend

Gamuda has tested its current short term uptrend line at the RM3.75/80 level today. It dropped to a low of RM3.76 before closing at RM3.80 at the end of today's trading (see the Chart 1 below).

It is interesting to note that Gamuda is in a fairly similar position today as it was on May 16 when it hit the then uptrend line at RM3.96 & re-bounded. But, 2 days later, it broke below that earlier uptrend line & slide all the way to a low of RM3.02 on June 14. This may not be a likely scenario today given the many projects that have been bandied about under the 9MP. Nevertheless, it is fairly important that the share price does not break below the current uptrend line at RM3.75/80 anytime soon.


Chart: Gamuda's daily chart as at Sep 8

Also, take a look at the weekly chart below i.e. Chart 2.


Chart 2: Gamuda's weekly chart as at Sep 8

Green Packet may have put in a temporary top

Background

Green Packet is involved in the research, development, manufacturing, marketing & distribution of wireless networking & telecommunication products, networking solution & other technology products & services.

Recent Development

Recently, one of Green Packet's associate company, GMO Limited ("GMOL") was listed on the Alternative Investment Market of the London Stock Exchange on Wednesday, 6 September 2006.

Past 4-year Financial Performance

Since the listing of this company on the Mesdaq Board in May 2005, Its financial performance has been very impressive. From Table 1 below, you can see that its turnover has grown from RM5.1 mil in FYE2003 to RM39.4 mil in FYE2005. Net profit has increased from RM2.9 mil to RM31.7 mil during the same periods.


Table 1: Past 4-year Financial Performance

Recent Financial Performance

The latest 2Q2006 results shows a net profit increase of 27.6% q-o-q to RM10.1 mil which was achieved on the back of a 21.2% q-o-q increase in turnover to RM13.9 mil. When compared to the corresponding quarter in FYE2005, the net profit has increased by 51.5% while turnover has increased by 57.8%. See Table 2 below.


Table 2: Latest quarterly results compared

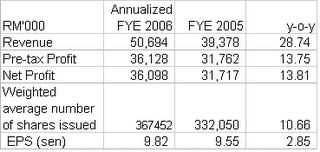
However, if you compared the annualized FYE2006 with the actual FYE2005 (see Table 3 below), you would notice that the scorching growth rate has moderated from 117% in FYE 2005 to a more comfortable 29% while pre-tax profit margin has eroded somewhat from 81% in FYE2005 to 71% in FYE2006. The slide in pre-tax profit margin plus the slower growth in turnover are clear indications that competition is picking up. Over the next few quarters, we will see whether Green Packet can weather the tougher operating environment and stay ahead of the competition.


Table 3: Annualized FYE2006 & Actual FYE2005 compared

Technical Outlook

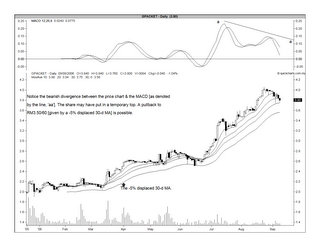
The technical outlook of Green Packet has turned a bit cloudy of late. This may in part be due to the on-going correction in the Mesdaq Board. It is also likely that some investors in Green Packet may be taking profit on the stock in view of its slower growth in turnover & a slight contraction in pre-tax profit margin.

From the chart below, we notice that the MACD has a bearish divergence when compared to the upward movement of the share price. The share price has pulled back to the 30-day MA of RM3.74 at 10.00 a.m. this morning. Further weakness will put Green Packet below its 30-day MA, which happened in June this year. However, the -5% displaced 30-day MA has been supportive in the event of a correction & I expect this may do the same again. That level is at RM3.50/60 now. However, a break below RM3.50 could mean a more severe correction for this stock.


Chart: G Packet's daily chart as at Sep 8


Conclusion

Green Packet may have put in a temporary top recently. Look out for the test of the 30-day MA [at RM3.74] & the -5% displaced 30-day MA [at RM3.50/60]. Be forewarned that a break of the latter could have serious consequences for the stock.