Showing posts with label MUDA. Show all posts

Friday, November 23, 2018

Muda: A Surprisingly Strong 3Q

Results Update

For QE30/9/2018, Muda's net profit rose 118% q-o-q or 47-fold y-o-y to RM25 million while its revenue rose 8% q-o-q & y-o-y to RM381 million. Revenue rose mainly due to improvement in selling prices for industrial paper and paper packaging products. Compared to the corresponding quarter in previous year, higher segment profit in current quarter is mainly attributable to improvement in the selling prices and lower production cost in the Manufacturing Division with minor segment margin improvement in the Trading Division.


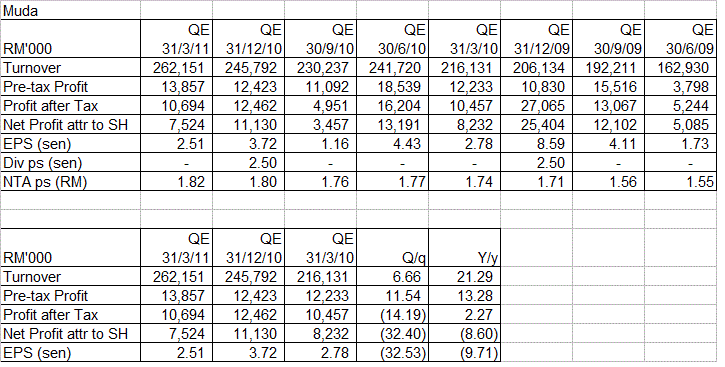
Table: Muda's last 8 quarterly results


Graph: Muda's last 50 quarterly results
 

Financial Position

Muda's financial position is deemed adequate with current ratio at 1.1 times and total liabilities to total equity at 0.9 time.

Valuation

Muda (trading at RM2.12 as at 3.15pm) is trading at a PE of 10.1 times (based on last 4 quarters' EPS of 20.88 sen). At this PER, Muda is deemed fairly attractive.

Technical Outlook

Mudahas been trading sideways for the past 6 months between RM1.50 & RM2.20. If it can break above RM2.20 (on the back of the current good performance), it may charge up to the May high of RM2.86-2.90.


Chart 1: Muda's daily chart as at Nov 23, 2018_2.50pm (Source: Malaysiastock.biz)

Looking at the monthly chart, Muda has strong resistance at RM2.35-2.50.


Chart 2: Muda's monthly chart as at Nov 23, 2018_2.50pm (Source: Malaysiastock.biz)

Conclusion

Based on good financial performance and attractive valuation, Muda is a good stock for long-term investment.

Note:

I hereby confirm that I do not have any direct interest in the security or securities mentioned in this post. However, I could have an indirect interest in the security or securities mentioned as some of my clients may have an interest in the acquisition or disposal of the aforementioned security or securities. As investor, you should fully research any security before making an investment decision.

Wednesday, May 30, 2018

MUDA: Earnings Stayed Heallthy

Results Update

For QE31/3/2018, Muda's net profit dropped 56% q-o-q or 13% y-o-y to RM15.7 million while its turnover was mixed - down 18% q-o-q but rose 17% y-o-y to RM372 million.

Revenue rose y-o-y 17.3% mainly attributable to higher selling price of industrial paper and paper packaging products and higher sales volume from the latter. Sales volume for industrial paper suffered a minor setback during the quarter due to competition from imported paper. Strengthening ringgit and increased supply from overseas paper mills to Malaysia has resulted in lower turnover during the quarter under review. However, the shortfall was compensated by better selling price. For paper packaging products, improving economy and the success of selling price increase to cover increased raw material cost has resulted in higher revenue to the Group.

Compared to the corresponding quarter in 2017, lower cost of waste paper, higher selling price of industrial paper and better selling price of paper packaging products contributed to improvement in gross margin of the Group despite higher operating cost for the quarter under review. The improved gross margin has resulted in higher profit before tax in the current quarter. Profit before tax for the quarter under review is 7.6%  higher than the corresponding period in 2017. If the impact of net compensation from the insurer for the fire which occurred in 2016 was eliminated, the adjusted profit of RM19.4 million for the current quarter under review is 2.4 times higher the adjusted profit of RM8.2 million in the corresponding quarter in 2017.


Table: Muda's last 8 quarterly results


Graph: Muda's last 48 quarterly results
 

Valuation

Muda (trading at RM2.15 as at 11.45am) is trading at a PE of 11.6 times (based on last 4 quarters' EPS of 18.5 sen). At this PER, Muda is deemed fairly attractive.

Technical Outlook

Muda is in a steep short-term uptrend based on the 10-week SMA line at RM2.20.


Chart 1: Muda's weekly chart as at May 30, 2018_11.45 (Source: ShareInvestor.com)

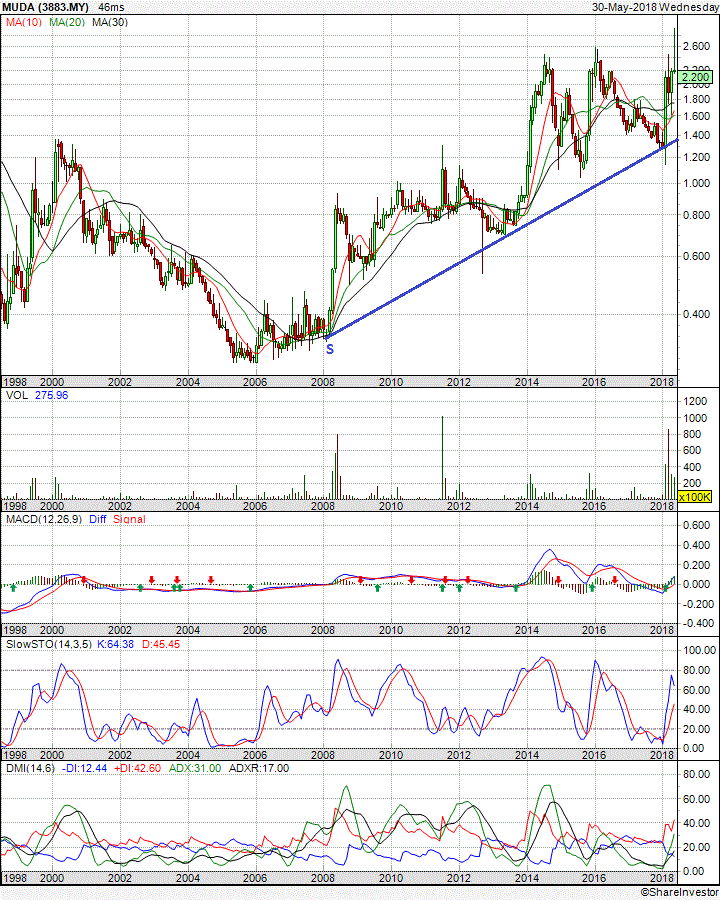
From Chart 2, we can see that Muda is in a long-term uptrend line, with support at RM1.40.


Chart 2: Muda's monthly chart as at May 30, 2018_11.45 (Source: ShareInvestor.com)

Conclusion

Based on improving financial performance, attractive valuation and bullish technical outlook, Muda is rated a BUY on WEAKNESS.

Note:

I hereby confirm that I do not have any direct interest in the security or securities mentioned in this post. However, I could have an indirect interest in the security or securities mentioned as some of my clients may have an interest in the acquisition or disposal of the aforementioned security or securities. As investor, you should fully research any security before making an investment decision.

Thursday, March 09, 2017

MUDA: Next Upleg Is Knocking


Results Update

Muda's result for QE31/12/2016 was released on Feb 23. Its net profit rose 82% y-o-y to RM18 million while its turnover rose 4% y-o-y to RM361 million. In the immediate preceding quarter, QE30/9/2016, Muda incurred a net loss of RM16 million due mainly to the write-off of inventory, warehouse & other assets of RM21.38 million resulting from a fire incident. If this write-off had not occurred, Muda would have report a net profit of about RM5.6 million.

For QE31/12/2016, Muda's revenue rose 28% q-o-q due mainly from higher revenue from the Trading Division - contributed about 80% of the increase- as a result of peak season for school bookshop operations in Singapore. The remaining increase in revenue came from the Paper Packaging Products division due to higher demand as a result of the festive season. As a result of the increased revenue, Muda's profits rose sharply.


Table: Muda's last 8 quarterly results


Chart 1: Muda's last 43 quarterly results
 

Valuation

Muda (closed at RM1.69 yesterday) is trading at a PE of 27 times (based on last 4 quarters' EPS of 6.16 sen). Excluding the losses from the fire in QE30/9/2016, Muda's last 4 quarters' EPS would be about 13.2 sen. That would lower its PER to about 13 times. At this adjusted PER of 13 times, Muda is deemed attractively valued.

Technical Outlook

Muda is pushing against the intermediate downtrend line, RR at RM1.70. If it can break above the RM1.70 level, Muda's next upleg may begin. (Note: AT the time of writing, Muda was trading at RM1.76.)


Chart 1: Muda's daily chart as at Mar 8,, 2017 (Source: MalaysiaStock.biz)

From Chart 2, we can see that Muda is well-supported by its long-term uptrend line, SS at RM1.40.


Chart 2: Muda's weekly chart as at Mar 8, 2017 (Source: MalaysiaStock.biz)

Conclusion

Based on good financial performance, fairly attractive valuation and bullish technical outlook, Muda's rating is now revised from SELL INTO STRENGTH to BUY.

Note:
I hereby confirm that I do not have any direct interest in the security or securities mentioned in this post. However, I could have an indirect interest in the security or securities mentioned as some of my clients may have an interest in the acquisition or disposal of the aforementioned security or securities. As investor, you should fully research any security before making an investment decision.

Monday, March 14, 2016

Muda: Earning Boosted By A Weak MYR

Results Update

For QE31/12/2015, Muda's net profit rose 32% q-o-q or 139% y-o-y to RM9.9 million while its turnover was up 33% q-o-q or 14% y-o-y to RM347 million. Revenue rose q-o-q as the peak season  sales for stationery products in the Trading Division and better  selling prices of products in the Manufacturing Division have contributed to the one third increase in revenue for the quarter under  review. Better selling price of products and higher margins for stationery products have raised the gross margin of the Group to 21.5% for the quarter under review and lifted profit before tax by 119.3% to RM18.76 million, compared to the preceding quarter.

FY2015 net profit rose 20.7% from RM21.8 million to RM26.3 million while revenue rose 7.0% from RM1.051 billion to RM1.124 billion. Increase in revenue was attributable to 4.4% and 3.3% increase in sales volume and prices of paper mill products respectively as a result of the weakened ringgit which prompted domestic customers to substitute foreign supplies with domestic products. Profits rose because of higher revenue and better profit margin from both the manufacturing & trading divisions.


Table: Muda's last 8 quarterly results


Chart 1: Muda's last 39 quarterly results
 

Valuation

Muda (closed at RM2.16 last Friday) is trading at a PE of 25 times (based on last 4 quarters' EPS of 8.6 sen). At this PER, Muda is deemed fully valued.

Technical Outlook

Muda broke through the 10-w SMA line as well as the 20 & 30-week EMA lines. The last time this happened was in late September 2014 when the share price continued to slide to a low of RM1.10.


Chart 2: Muda's weekly chart as at Mar 11, 2016 (Source: ShareInvestor.com)

From Chart 2, we can see that Muda pulled back after it surpassed its 2014 high of RM2.45 in January this year. This pullback could be a bearish double-top reversal.


Chart 3: Muda's monthly chart as at Mar 11, 2016 (Source: ShareInvestor.com)

Conclusion

Based on demanding valuation and tricky technical outlook, Muda is rated a SELL INTO STRENGTH.

Note: 
In addition to the disclaimer in the preamble to my blog, I hereby confirm that I do not have any relevant interest in, or any interest in the acquisition or disposal of, Muda.