Thursday, August 27, 2009

KPJ may see further upside

Background

KPJ Healthcare Bhd ('KPJ') is the largest private healthcare provider in Malaysia. It has 18 hospitals in Malaysia as well as 6 hospitals overseas.

Recent Financial Results

PJ has just announced its 2Q2009 results. Its net profit increased by 13.8% q-o-q or 23.2% y-o-y to RM24.9 million while turnover increased by 9.5% q-o-q or 19.5% y-o-y to RM371 million.


Table 1: KPJ's 8 quarterly results

From Chart 1, we can see that KPJ's top-line & bottom-line has been rising steadily over the past 10 quarters.


Chart 1: KPJ's 10 quarterly results

Valuation

KPJ (closed at RM3.43 yesterday) is trading at trailing PE of 8.6 times (based on last 4 quarters EPS of 40 sen) or at a Price to Book of 1.1 times (based on NTA per share of RM2.99). At these multiples, KPJ is still attractive.

Technical Outlook

KPJ appears to have just broken above its medium-term downtrend line at RM3.40. With this upside breakout, KPJ may test the resistance at RM3.75 & then RM4.00.


Chart 2: KPJ's weekly chart as at Aug 26, 2009 (Source: Quickcharts)

Conclusion

Based on attractive valuation, steady financial performance and bullish technical outlook, KPJ is a both a trading BUY or long-term BUY.

Wednesday, August 26, 2009

Harbour- a stock with good potential

Background

Harbour-Link Group Berhad ('Harbour') is an investment holding company with subsidiaries involved in logistics; shipping, forwarding, and transportation; and marine, engineering and construction; driver training; and road safety consultancy services. It is based in Sarawak.

Recent Financial Results

Harbour has just announced its results for FY2009 ended 30/6/2009. For 4Q2009, its net profit increased by 6.1% q-o-q to RM6.7 million while turnover was up 2.5% to RM70.5 million. Compared to 4Q2008, net profit was down 32.4% while turnover was 28.4% lower.


Financial Position

Since Harbour was the result of a restructuring scheme involving the financial-strapped Tongkah Holdings Bhd, it is wise to have a look at its current financial position. As at 30/6/2009, its current ratio is satisfactory at 1.76 times while gearing ratio is low at 0.32 times. As such, Harbour is a fairly healthy company.

Valuation

Harbour (closed at RM0.75 yesterday) is now trading at a trailing PE of 5.4 times (based on last 4 quarters' EPS of 14.4 sen) or at a Price to Book of 0.6 times (based on NTA per share of RM1.22). Based on these, Harbour is deemed fairly attractive.

Technical Outlook

Harbour may have broken above its medium-term downtrend line at RM0.58-60 in April. The stock is presently consolidating within a triangle, awaiting breakout. The upleg would continue if the price can surpass RM0.78-80 level. The next resistance is at RM0.88-90 & thereafter at RM1.00. You also need to watch out a downside breakout at RM0.70-72. If the latter were to happen, the stock may drift back to the strong horizontal support of RM0.60.


Chart: Harbour's weekly chart as at Aug 25, 2009 (Source: Quickcharts)

Conclusion

Based on attractive valuation & nice technical set-up, Harbour is a stock with good potential to go higher. The trigger for the next upleg is an upside breakout at RM0.78-80.

Maybank hit by RM1.7 billion impairment charge

Maybank has just announced its results for FY2009 ended 30/6/2009. From the Edge wrote:
MALAYAN posted net profit of RM691.87 million for its financial year ended June 30, 2009 from RM2.93 billion a year ago.

Revenue was higher at RM17.58 billion compared with RM16.15 billion. Earnings per share were RM12 sen compared with 53.32 sen.

For the fourth quarter (4Q), its suffered a net loss of RM1.118 billion compared with a net profit of RM792.21 million a year ago. Revenue was RM4.86 billion compared with RM4.49 billion. Loss per share was 17.62 sen compared with EPS of 14.41 sen. It proposed a dividend of eight sen per share.

Maybank said in 4Q, the group had made an impairment charge of RM1.617 billion on goodwill arising from its 97.5%-owned PT Bank Internasional Indonesia Tbk (BII) banking business operations and an additional impairment loss of RM111 million for the investment in MCB Bank.

For more, go here.

I'll look at the technical outlook for Maybank. The stock's uptrend accelerated from S1 to S2 and then to S3. The latter uptrend line was very steep & unsustainable. Share price broke below uptrend line S3 in mid-June and continued to rise upward in a more gradual uptrend S4. From the chart below, we can see that the uptrend line S4 has support at RM6.40 as at August 21. While the chart is outdated by 2 trading days, we can estimate the current support for uptrend line S4 as RM6.45-50 (by extra polarization). If Maybank were to break below this level, Maybank may find support at uptrend line S2 at RM5.80-6.00. As at 9.45 am, Maybank was trading at RM6.39. Should one do a trading SELL at the present price & hope to buy back at RM5.80-6.00? I can't answer that. However, I believe that further impairment charges is likely to be smaller since the economic recovery is picking up steam.


Chart: Maybank's daily chart as at Aug 21, 2009 (Source: Tradesignum)

Tuesday, August 25, 2009

RHBCap- a good long-term BUY

Background

RHB Capital Berhad ('RHBCap') is an investment holding company. It is involved in commercial banking, Islamic banking, investment banking, leasing, offshore banking, offshore trust services, general insurance, unit trust management, asset management, and nominee and custodian services. All these activities are carried on via RHB Banking Group, which is the fourth largest fully integrated financial services group in Malaysia.

Recent Financial Results

RHBCap has just announced its results for 2Q2009 ended 30/6/2009. Its net profit increased by 31.9% q-o-q or 11.2% y-o-y to RM302 million while its turnover dropped by 1.2% q-o-q or 10.8% y-o-y to RM1.34 billion.

Higher sequential pre-tax profit was attributed to increase in net interest income (of RM20.8 mil), Islamic Banking income (of RM40.8 mil), Other Operating Income (of RM19.1 mil); and drop in Other Operating Expenses (of RM40.1 mil) which offset the higher allowances on loan losses (of RM17.4 mil) & reversal of impairment losses (of RM18.3 mil).

Turnover, which consists of Interest Income, Other Operating Income & Islamic Banking Income, has been declining in the past 2 quarters due to lower interest rate charged.


Table 1: RHBCap's 8 quarterly results


Chart 1: RHBCap's 8 quarterly results

Valuation

RHBCap (closed at RM4.60 yesterday) is now trading at a trailing PE of 9.2 times (based on last 4 quarters' EPS of 50 sen) or at a Price to Book of 1.2 times (based on NTA per share of RM3.74).

This compared favorably to Public Bank which is trading at a trailing PE of 14.1 times (yesterday's price of RM9.89 & annualized EPS of 70 sen) or Commerce which trades at a trailing PE of 15.0 times (yesterday's price of RM10.34 & annualized EPS of 69 sen). If we valued RHBCap at a 10%-discount to Public Bank & Commerce's PE multiple, then its fair value could be RM6.50.

Technical Outlook

RHBCap has broken above its medium-term downtrend in July (see Chart 2). A short-term uptrend line has also formed, with support at RM4.45-50 (see Chart 3). Its next resistance ia at RM4.90-5.00 & thereafter at RM5.50.


Chart 2: RHBCap's weekly chart as at Aug 24, 2009 (Source: Quickcharts)


Chart 3: RHBCap's daily chart as at Aug 24, 2009 (Source: Quickcharts)

Conclusion

Based on improving performance, attractive valuation & good technical outlook, I think RHBCap is a good stock for long-term investing.

Monday, August 24, 2009

Pharma- an attractive long-term stock

Background

Pharmaniaga Berhad ('Pharma') is the largest integrated local healthcare company in Malaysia. Its core businesses are generic pharmaceuticals manufacturing and R&D, warehousing and distribution of pharmaceutical and medical products, sales & marketing as well as hospital equipping.

Recent Financial Results

For 2Q2009 ended 30/6/2009, its net profit increased by 21.9% q-o-q or 35.0% y-o-y to RM17.7 million. Its turnover was 6.2% higher than 1Q2009 but 5.7% lower than 2Q2008.


Table 1: Pharma's 8 quarterly results

From the chart below, we can see that the growth in Pharma's turnover has hit a slow patch over the past 1 year, after a period of strong growth in FY2007 & FY2006. Its net profit has been flattish for the past 2 years, after peaking in 3Q2007.


Chart 1: Pharma's 15 quarterly results

Valuation

Pharma (closed at RM4.40 on Friday) is now trading at a trailing PE of 7.7 times (based on the last 4 quarters' EPS of 57 sen) or at a Price to Book of 1.2 times (based on NTA per share of RM3.74 as at 30/6/2009). At these multiples, Pharma is deemed attractive.

Technical Outlook

Pharma has been in a downtrend for the past 5 years (see the charts below). A break above the RM4.50 level could signal the start of the recovery in its share price. On weakness, it may drift back to the RM4.00 horizontal line.


Chart 2: Pharma's daily chart as at Aug 21, 2009 (Source: Tradesignum)


Chart 3: Pharma's monthly chart as at Aug 21, 2009 (Source: Quickcharts)

Conclusion

Based on attractive valuation, Pharma may be a good stock for long-term investing. It may even be a good trading BUY if the share price were to break above the RM4.50 level.

Friday, August 21, 2009

ENG may be another good long-term BUY

Background

ENG Teknologi Holdings Bhd ('ENG')'s core businesses can be divided into:
- the Data Storage Group that primarily focused into the Hard Disk Drive & Tape Back-up Drive industry; and
- the Industrial Product Group that focused into the electrical and electronics and industrial mechanical sectors.

Recent Financial Results

After declining for the last 4 quarters, ENG's top-line & bottom-line have finally rebounded. It reported a net profit of RM11.4 million on a turnover of RM106 million for Q2009 ended 30/6/2009. This compared favorably to the results for 1Q2009 where it reported a small loss of RM84k on a turnover of RM101 million. Compared to the previous corresponding quarter, net profit was up 45% while turnover was down 17%. The company attributed to improved performance to a leaner operation, which resulted in cost reduction. Other factors working in its favor are higher interest income (offsetting interest charges) & lower effective tax rate (due to certain income not subject to tax & incentives enjoyed by local subsidiaries.


Table 1: ENG's 8 quarterly results


Chart 1: ENG's 27 quarterly results

Valuation

If ENG can sustain its 2Q2009 results for the next few quarters, then its forward EPS could be as high as 38 sen (annualized EPS for 2Q2009). As such, ENG (clsoed at RM1.09 yesterday) could be trading at a forward PE of only 3 times. If we were to discount its EPS by 50%, the forward PE of 6 times is still reasonably attractive. Price to Book stood at 0.6 times.

Technical Outlook


ENG may have just broken above its long-term downtrend line at RM1.00-1.05.


Chart 2: ENG's weekly chart as at Aug 20, 2009 (Source: Quickcharts)

Conclusion

Based on a possible turnaround; fairly attractive valuation; and possible technical outlook, ENG may be a good stock for long-term investing.

Mamee- a very attractive consumer stock

Background

Mamee-Double Decker (M) Bhd ('Mamee') is principally involved in the manufacture and marketing of fast moving consumer products, such as food, dairy products and soft drinks.

Recent Financial Results


Its recently announced results for 2Q2009 ended 30/6/2009 shows that Mamee can maintain its top-line & bottom-line in the difficult economic environment. Its net profit increased by 1.4% q-o-q or 185% y-o-y to RM10.7 million while turnover increased by 12.5% q-o-q or 4.3% y-o-y to RM103 million.


Table 1: Mamee's 8 quarterly results

Over 21 quarters, Mamee's turnover grew from RM69 million in QE30/6/2004 to RM103 million in the recently completed QE30/6/2009- a compounded annual growth rate of 9%. At the same time, its net profit grew from RM2.6 million to RM10.7 million- a compounded annual growth rate of 33%.


Chart 1: Mamee's 21 quarterly results

Valuation

Mamee (closed at RM2.50 yesterday) is now trading at a trailing PE of 5.4 times (based on last 4 quarters' EPS of 46 sen) or at Price to Book of only 1 time. At these multiples, Mamee is deemed very attractive. With its high growth rate, I believe Mamee could easily trade at a PE of 10 times; thus giving the stock a target of at least RM4.60.

Technical Outlook

Mamee is in a short-term uptrend, with support at RM2.30. Its immediate resistance is at RM2.60 and thereafter at RM2.75. See the daily & weekly charts below.


Chart 2: Mamee's daily chart as at Aug 20, 2009 (Source: Quickcharts)


Chart 3: Mamee's weekly chart as at Aug 20, 2009 (Source: Quickcharts)

Conclusion

Based on good financial performance; attractive valuation; and positive technical outlook, Mamee is a good stock for medium- & long-term investing.

Kossan hit by RM12.5 million forex loss in 2Q2009

Results update

Kossan has just announced results for its 2Q2009 ended 30/6/2009. Its net profit declined by 3.8% q-o-q or 3.0% y-o-y to RM13.6 million while turnover dropped by 2.8% q-o-q or 9.4% y-o-y to RM197 million.

The lower turnover was due to reduction in selling price of gloves as a result of lower price of raw materials. Pre-tax profits in the current and preceding quarters include foreign exchange losses amounting to RM 12.51 million and RM 12.21 million respectively.


Table 1: Kossan's 8 quarterly results


Chart 1: Kossan's 12 quarterly results

I have posted earlier about the impact of forex losses on Kossan's results for FY2009. The forex losses is the result of Kossan's hedging its receivables at an average contract of RM3.37 to the US dollar in anticipation of further weaknesses in the US currency. Instead, the US dollar has rebounded from April 2008 to April 2009. Since then, it has eased off to 3.50-3.60. I expect this trading range to be intact for the next 2-3 months. See Chart 2 below.


Chart 2: USD/RM exchange rate as at August 20, 2009 (Source: Yahoo Finance)

As such, Kossan's 2nd half-year results will likely to record smaller forex losses. We will then see an improvement in its EPS from 8.4 sen for 2Q2009 to about 10-12 sen for 3Q2009 & 4Q2009. Kossan's FY2009 EPS may come at about 40 sen. As such, Kossan (closed at RM3.86) is now trading at a current PE of 9.7 times. I think Kossan may trade up to 12 times earning; thus giving the stock a potential upside is about 20%.

From Chart 3 below, we can see that Kossan is trending higher in an upward channel, with support at RM3.50 & resistance at RM4.40.


Chart 3: Kossan's weekly chart as at Aug 20, 2009 (Source: Quickcharts)

Based on the expectation of a better results for 2nd half-year; still attractive valuation; and positive technical outlook, Kossan remained a good stock for long-term investing.

Thursday, August 20, 2009

Market Outlook as at August 20, 2009

The KLCI has rebounded today, along with other regional markets. Nevertheless, it may be too early to call an end to this round of correction, just yet. The KLCI is however expected to find support at its uptrend line at 1135 or at its 50-day SMA line of 1125. See Chart 1 below.


Chart 1: KLCI's daily chart as at Aug 20, 2009 (Source: Quickcharts)

Some stocks have dropped back to their uptrend line support. You may begin to slowly accumulate some of them, especially those that have rebounded off the uptrend line. One good example is Genting, which rebounded from its uptrend line support of RM5.90 (see Chart 2 below). Commerz is at its uptrend line support now, while PBBank & IOICorp are likely to test their uptrend line soon. These are some of the good stocks that you can look at.


Chart 2: Genting's daily chart as at Aug 20, 2009 (Source: Quickcharts)


Chart 3: Commerz's daily chart as at Aug 20, 2009 (Source: Quickcharts)


Chart 4: PBBank's daily chart as at Aug 20, 2009 (Source: Quickcharts)


Chart 4: IOICorp's daily chart as at Aug 20, 2009 (Source: Quickcharts)

While buying at the uptrend line is a reliable trend-following method for trading purposes (even for investing purpose), one must bear in mind that a break of an uptrend line normally signal increased likelihood of a change in trend. I had noted in an earlier post that the upside in the market may be limited after the recent strong rally. The contradiction between these two statements is something that we have to live with. We have to act on certain technical signal or set-up even when we feel that the market may be a bit high. A compromise may be found by way of reducing our exposure to the market while continuing to act on technical signal or set-up as given by the market.

Wednesday, August 19, 2009

Yee Lee- an attractive consumer stock

Background

Yee Lee Corporation Bhd ('Yee Lee') is involved in manufacturing; marketing & distribution of fast-moving, high quality consumer products (such as household food products, oral care products, household cleaners and laundry products); and eco-tourism (which is carried out near its Sabah Tea estate, near the foothills of Mount Kinabalu). Its manufacturing operations include:
- Manufacturing of corrugated fiberboard cartons and boxes
- Milling of crude palm oil and palm kernel
- Printing and manufacturing of general line tin cans
- Manufacturing and distribution of tea

Recent Financial Results

Yee Lee has just announced its results for 2Q2009 ended 30/6/2009, where its net profit increased by 11.9% q-o-q to RM4.5 million on the back of a 5.6%-increase in turnover to RM177 million, with higher turnover from sale of cooking oils and Dutch Lady products. Compared to 2Q2008, net profit was lower by 10.7% while turnover dropped by 12.7%. The lower turnover was "primarily due to the substantial decrease in crude palm oil price which directly reduced the selling price of oil palm products. However the sharp decrease had been mitigated by the substantial increase in the sales of bottled water and other agency products such as Campbell and newly secured agency product, Dutch Lady".


Table: Yee Lee's last 8 quarterly results


Chart 1: Yee Lee's last 27 quarterly results

Financial Position

Yee Lee's financial position is deemed satisfactory, with current & gearing ratios at 1 time each. To be fair, the gearing ratio includes short-term borrowings of RM151 million which was used to finance its working capital. If this amount is excluded, the gearing ratio is only 5%.

Valuation

Yee Lee (closed at RM1.40 yesterday) is now trading at a trailing PE of 5.6 times (based on last 4 quarters' EPS of 25 sen) or at a Price to Book of 0.46 times (based on NTA per share of RM3.04 as at 30/6/2009). At these multiples, Yee Lee is fairly attractive.

Technical Outlook

Yee Lee appears to have been trapped in a bottoming phase over the past 3 years until it broke above the RM1.20 resistance level in March. It subsequently surpassed the next resistance level of RM1.40 (to make a high of RM1.50). Since then, it has dropped back below the RM1.40 level. Above the RM1.40 resistance, Yee Lee will encounter another resistance at RM1.70.


Chart 2: Yee Lee's weekly chart as at Aug 18, 2009 (Source: Quickcharts)


Chart 3: Yee Lee's monthly chart as at Aug 18, 2009 (Source: Quickcharts)

Conclusion

Based on attractive valuation and satisfactory financial performance, Yee Lee could be a good stock for long-term investment. Technically, the stock needs to break out convincingly above RM1.40 before a new upleg shall commence.

Dgate- to sell into strength, if opportunity prevailed

On August 13, I recommended a trading BUY for Dgate (here) when it had broken above its triangle at RM0.20. Like many breakouts that happened last week, DGate's bullish breakout could well turn into a bull trap in the present market. The saving grace is that the uptrend is still intact as the share price hasn't broken below RM0.18.


Chart 1: Dgate's weekly chart as at Aug 18, 2009 (Source: Quickcharts)

Besides the market correction that has spooked many an investors, Dgate was affected by the results for 2Q2009 ended 30/6/2009, which was announced on August 17. The results is presented in the table & chart below. You can see clearly that Dgate's financial performance has not shown any sign of recovery. This poor set of results will likely to act as a drag on the share price for the near-term.


Table 1: Dgate's 8 quarterly results


Chart 2: Dgate's 13 quarterly results

With no sign of recovery in sight, I think that Dgate's near-term outlook will not be good. As Dgate is still in an uptrend, I think we do not have to sell off the stock immediately. However, we should sell into strength if the stock were to rebound. A good level to aim for is RM0.20- the earlier bullish breakout level- as this will act as a strong resistance.

Century- time to take profit

Results Update

Century Logistics has just announced its results for 2Q2009 ended 30/6/2009, which shows a strong rebound in its top-line & bottom-line. Its net profit increased by 282% q-o-q or 57% y-o-y to RM3.9 million while turnover increased by 18.6% q-o-q or 37.7% y-o-y to RM47 million. See Table 1 & Chart 1 below.


Table 1: Century's 8 quarterly results


Chart 1: Century's 13 quarterly results

Century (closed at RM1.73 yesterday) is now trading at a trailing PE of 15 times (based on last 4 quarters' EPS of 11.5 sen) or 0.9 times its Book Value of RM1.92 as at 30/6/2009. At these multiples, I believe Century is nearing its fair value of about RM1.80-2.00.

From Chart 2 below, we can see that Century will encounter strong resistance at the horizontal line of about RM1.90-95 and the psychological RM2.00 mark. On the other hand, Century has strong support at RM1.60.


Chart 2: Century's weekly chart as at Aug 17, 2009 (Source: Quickcharts)

After a strong rally that brought this stock near to its fair value, I think it is time to track it for the purpose of profit-taking. Nevertheless, if the price of Century were to drop back to RM1.60, you can accumulate it as it's on the road to recovery.

Tuesday, August 18, 2009

Aji's bottom-line recovered from the dip in previous quarter

Results Update

Aji has just announced its results for 1Q2009 ended 30/6/2009. Its net profit increased by 291% q-o-q or 16.2% y-o-y to RM7.0 million while turnover was up 17.3% q-o-q or 23.8% y-o-y to RM71.3 million. The sharp sequential increase in net profit was attributable to a low base in 4Q2008, when Aji's bottom-line took a hit due to higher selling expenses resulting from intensive sales & promotional activities. The continued improvement in bottom-line & top-line resulted from increased export to the Middle East as well as higher domestic sales.


Table 1: Aji's 8 quarterly results

Aji's sale has been rising steadily over the past 16 quarters, as shown by the chart below.


Chart 1: Aji's 16 quarterly results

Valuation

In term of valuation, Aji (closed at RM3.18 yesterday) is now trading at a trailing PE of 9.6 times (based on last 4 quarters' EPS totaling 33 sen) or at 1 times its Book Value of RM3.17. At these multiples, Aji is still fairly attractive for a growth stock.

Technical Outlook

Aji's gradual uptrend (SS) picked up pace in November last year and turned into the accelerated uptrend (S1S1). Aji has recently tested its May high of RM3.20 again. A failure to surpass this level means that Aji may have put in a temporary top. In the event of correction, Aji may pull back to the S1S1 uptrend line support of RM2.95-3.00. At lower level, we can expect horizontal line support to kick in at RM2.85 & RM2.70.


Chart 2: Aji's weekly chart as at Aug 17, 2009 (Source: Quickcharts)

Conclusion


Based on good financial performance & reasonable valuation, Aji is good stock for a long-term investing. Accumulate if the stock were to pull back to the RM2.80-3.00 level.

CPO- mild correction setting in

Yesterday, the Parabolic SAR (SAR stands for 'stop-and-reversal' indicator) has moved above the CPO price. This signals the start of a correction in CPO prices. I expect the correction to be mild with support seen at RM2300-2350, from either the horizontal line or the center line of the Bollinger Band (which is a 20-day Exponential Moving Average line).


Chart: CPO's daily chart as at Aug 17, 2009 (Source: ifs.marketcenter.com)

Monday, August 17, 2009

US markets may see correction ahead

The US markets look set for correction. DJIA & S&P500 are both pressing against the upside of the expanding triangle. Some called this pattern a "bugle" and over the past two weeks the "bugle" remained intact. The indicators are now giving negative reading. RSI, MACD & ADX are all pointing to a correction (see the red boxes). Compared these with the positive readings in March, just before the US markets rallied (see the blue boxes). How far would DJIA & S&P500 decline to? With all the positive economic news, I believe the correction would be quite mild, possibly to the 50-day SMA line. This means that DJIA & S&P500 should find support at 8750 & 950, respectively. If the 50-day SMA line failed to hold up the market, DJIA & S&P500 may test their 100-day SMA line support at 8500 & 910, respective.
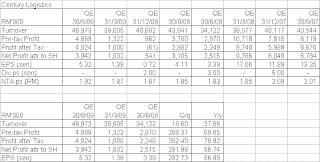

Chart 1: DJIA's daily chart as at Aug 14, 2009 (Source: Stockcharts.com)


Chart 2: S&P500's daily chart as at Aug 14, 2009 (Source: Stockcharts.com)

How would the global equity markets react to a simultaneous correction in the US markets & Shanghai's SSEC? I believe that the near-term outlook for equity market is now turning negative, with more downside than upside. As such, it may be prudent to reduce our exposure to the market & keep some cash in reserve.

Friday, August 14, 2009

Plantation- time to take some profit

As at 4.00pm, CPO September future contract was trading at RM2476 (down RM49 or 1.9%). At the same time, Plantation index was up 140 points or 2.4% to 6083. Why the opposite moves? Chart 1 shows the intra-day movement for the Plantation index over the past 1 month.


Chart 1: Plantation's 60-min intra-day chart as at 14/8/2009_4.00pm (Source: Quickcharts)

The two intra-day CPO charts below will show that the upside for CPO prices may be capped for the next few days. Chart 2 shows that CPO prices are pressing against the upper boundary of the Bollinger Band, while Chart 3 shows that CPO prices are pressing against the upper boundary of the upward channel for CPO prices. If CPO prices were to drift sideway, one can expect Plantation index to follow suit. As such, you may want to lock in your profit for your Plantation stocks, if you have any. This can be a trading SELL whereby you can buyback the same stocks when the prices have eased back a bit.


Chart 2: CPO's intra-day chart as at August 13, 2009, with Bollinger Band overlaid (Source: ifs.marketcenter.com)


Chart 3: CPO's intra-day chart as at August 13, 2009, with upward channel drawn (Source: ifs.marketcenter.com)

SSEC to correct further

Shanghai's SSEC has put in a temporary top. It has broken below its 50-day SMA line at 3097 today. As at 11.29pm ET, SSEC was down 75 points (or, 2.38%) to 3066. The next support will come from the psychological 3000 mark; the horizontal support of 2950; and, the 100-day SMA line of 2810. We can see the violation of the uptrend line in the RSI & MACD indicators now (highlighted in blue boxes). Compared that with the bullish breakout of the downtrend line of the same indicators in November & December last year (highlighted in pink "bubble"). The present bearish breakdown is likely to lead to a consolidation of 1 to 2 months.


Chart: SSEC's daily chart as at August 13, 2009 (Source: Stockcharts.com)