Showing posts with label packaging materials. Show all posts

Wednesday, December 29, 2021

SCGM: Earnings Continued To Stall

 Results Update

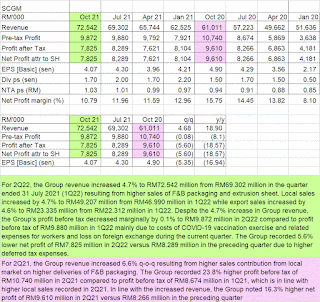
In QE31/10/2021 (2Q22), SCGM's net profit dropped 6% q-o-q or 19% y-o-y to RM7.8 million while revenue increased 5% q-o-q or 19% y-o-y to RM72.5 million. 

For 2Q22, the Group revenue increased 5% q-o-q "resulting from higher sales of F&B packaging and extrusion sheet. Local sales increased by 4.7% to RM49.207 million from RM46.990 million in 1Q22 while export sales increased by 4.6% to RM23.335 million from RM22.312 million in 1Q22. Despite the 4.7% increase in Group revenue, the Group’s profit before tax decreased marginally by 0.1% to RM9.872 million in 2Q22 compared to profit before tax of RM9.880 million in 1Q22 mainly due to costs of COVID-19 vaccination exercise and related expenses for workers and loss on foreign exchange during the current quarter. The Group recorded 5.6% lower net profit of RM7.825 million in 2Q22 versus RM8.289 million in the preceding quarter due to higher deferred tax expenses".

 
Table: SCGM's last 8 quarterly results
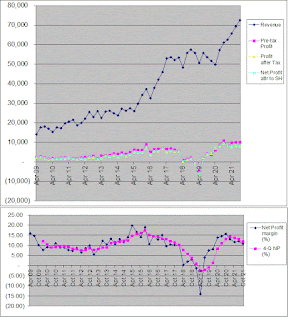
 
Graph: SCGM's last 51 quarterly results

Financial Position

SCGM's financial position is deemed healthy with current ratio at 1.65 times while gearing ratio is elevated at 0.55 time.

Valuation

SCGM (closed at RM2.42 yesterday) is now trading at a PE of 15X (based on the last 4 quarters' EPS of 16.54sen).  At this PE, SCGM is deemed fairly attractive.

Technical Outlook

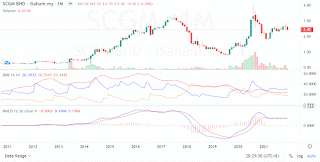
SCGM's medium-term uptrend may have ended after the share prices went below the uptrend line, SS. Its next support should be at the horizontal line at RM2.35.
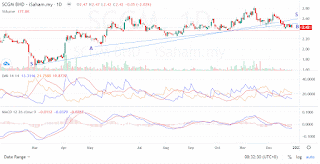


Chart 1: SCGM's daily chart as at  Dec 28, 2021 (Source: iSaham.my)


Chart 2: SCGM's monthly chart as at  Dec 28, 2021 (Source: iSaham.my)

Conclusion

Despite the weaker financial performance, SCGM is still a good stock for long-term investment based on healthy financial position & fair valuation,

Note:

I hereby confirm that I do not have any direct interest in the security or securities mentioned in this post. However, I could have an indirect interest in the security or securities mentioned as some of my clients may have an interest in the acquisition or disposal of the aforementioned security or securities. As investor, you should fully research any security before making an investment decision.
Tuesday, June 29, 2021

SCGM: Steady Earnings Growth Continued

Results Update

In QE30/4/2021(4Q21), SCGM's net profit dropped 6% q-o-q or rose 11% y-o-y to RM7.6 million while revenue increased 5% q-o-q or 32% y-o-y to RM66 million. 

The Group Revenue increased q-o-q resulting from 13%-increase in local sales to RM46.106 million from RM40.757 million (due to higher deliveries of F&B packaging due to higher demand in general) which offset the 9.8% decline in export sales to RM19.638 million from RM21.768 million (due to lower sales of F&B packaging, in line with the past trend in which export sales would be higher during the few months prior to Christmas and New Year). 

The Group recorded a 24% higher profit before tax of RM9.792 million, which is in line with higher local sales recorded in 4Q21. Despite the increase in revenue, the Group recorded 6% lower net profit of RM7.621 million due to higher income tax expense and deferred tax expense.

 
Table: SCGM's last 8 quarterly results

 
Graph: SCGM's last 49 quarterly results

Financial Position

SCGM's financial position is deemed healthy with current ratio at 1.55 times while gearing ratio is elevated at 0.62 time.

Valuation

SCGM (closed at RM2.45 yesterday) is now trading at a PE of 14 X (based on the last 4 quarters' EPS of 17.36 sen).  At this PE, SCGM is deemed fairly attractive.

Technical Outlook

SCGM has been on a steady rise, from the low of RM1.69 recorded in March this year. It is rising on an uptrend line, with support at RM2.30.


Chart 1: SCGM's daily chart as at Jun 28, 2021 (Source: Kenanga BTX)

Prior to this, it had a big drop from its all-time high of RM3.95 in August 2020. 


Chart 2: SCGM's weekly chart as at  Jun 28, 2021 (Source: Kenanga BTX)

Conclusion

Based on improved financial performance, healthy financial position & fairly attractive valuation, SCGM is a good stock for long-term investment. 

Note:

I hereby confirm that I do not have any direct interest in the security or securities mentioned in this post. However, I could have an indirect interest in the security or securities mentioned as some of my clients may have an interest in the acquisition or disposal of the aforementioned security or securities. As investor, you should fully research any security before making an investment decision.

Monday, December 21, 2020

SCGM: Earnings Continue to Rise

Results Update

In QE31/10/2020 (2Q21), SCGM's net profit rose 16% q-o-q or 138% y-o-y to RM9.6 million while revenue increased 7% q-o-q or 14% y-o-y to RM61 million. The group revenue increased 7% q-o-q resulting from higher sales contribution from local market on higher deliveries of F&B packaging. The Group recorded 24% higher profit before tax of RM10.7 million in 2Q21 compared to profit before tax of RM8.7 million in 1Q21, which is in line with higher local sales recorded in 2Q21. In line with the increased revenue, the Group noted 16% higher net profit of RM9.6 million in 2Q21 versus RM8.3 million in the preceding quarter

 
Table: SCGM's last 8 quarterly results

 
Graph: SCGM's last 47 quarterly results

Financial Position

SCGM's financial position is deemed healthy with current ratio at 1.49 times while gearing ratio is elevated at 0.67 time.

Valuation

SCGM (closed at RM2.48 yesterday) is now trading at a PE of 16.6X (based on the last 4 quarters' EPS of 14.92 sen).  At this PE, SCGM is deemed fairly attractive.

Technical Outlook

SCGM peaked at RM3.95 in early August. It has dropped back to around the RM2.50 level in the past few days. Its 200-day SMA line support is not far away at RM2.32.


Chart 1: SCGM's daily chart as at Dec 21, 2020 (Source: Malaysiastock.biz)


Chart 2: SCGM's weekly chart as at Dec 21, 2020 (Source: Malaysiastock.biz)

Conclusion

Based on improved financial performance, healthy financial position & fairly attractive valuation, SCGM is a good stock for long-term investment. The current price downtrend is likely to continue until a reversal is achieved, which may come once the share prices have surpassed the RM3.00 mark.

Note:

I hereby confirm that I do not have any direct interest in the security or securities mentioned in this post. However, I could have an indirect interest in the security or securities mentioned as some of my clients may have an interest in the acquisition or disposal of the aforementioned security or securities. As investor, you should fully research any security before making an investment decision.

Tuesday, August 11, 2020

BPPLAS: Earnings Rose Sharply

Result Update

For QE30/6/2020, BPPLAS's net profit rose 36% q-o-q or 87% y-o-y to RM8.5 million while revenue was mixed- up 3.5% q-o-q but down 7.4% y-o-y to RM80.3 million. 

Operating revenue rose q-o-q due to improved sales demand in 2Q20. A subsidiary of the Group received approval since the beginning of Movement Control Order (MCO), thus able to operate to deliver stronger sales performance because food packaging film, stretch film and customised film products produced by the Group are part of the critically required packaging for Food and other Essential Goods.

The Group recorded a historical high for the unaudited PBT and PAT for the quarter under review of RM11.3 million and RM8.5 million respectively, representing an increase of 36% and 36% compared to unaudited PBT and PAT of RM8.3 million and RM6.2 million respectively in 1Q20. The increase in the unaudited PBT and PAT for the quarter under review were mainly due to better product mix and production efficiencies.

Table: BPPLAS's last 8 quarterly P&L

Graph: BPPLAS's last 26 quarters' P&L

Financial Position

As at 30/6/2020, BPPLAS's financial position is deemed healthy with current ratio and gearing ratio at 4.6 times and 0.2 times. Cash in hand amounted to RM78.8 million or RM0.42 per share.

Valuation

BPPLAS (closed at RM1.40 yesterday) is now trading at a PER of 10 times (based on last 4 quarters' EPS of 14.36 sen). If the cash in hand is deducted from the share price, then BPPLAS's PER will be lowered to 7 times. BPPAS also paid a decent dividend totaling 8 sen last 4 quarters- giving it a dividend yield of 5.7%. Overall, BPPLAS is deemed fairly attractive.

Technical Analysis

BPPLAS has broken above the Downtrend line, RR at RM1.00 in early May. Its immediate support is at the horizontal line at RM1.35 while immediate resistance is at the horizontal line at RM1.60.

Chart: BPPLAS's mweekly chart as at Aug 11, 2020 (Source: Malaysiastock.biz)  

Conclusion

Based on good financial performance & position, attractive valuation and bullish technical outlook, BPPLAS could be a good stock for long-term investment. 

Note:

I hereby confirm that I do not have any direct interest in the security or securities mentioned in this post. However, I could have an indirect interest in the security or securities mentioned as some of my clients may have an interest in the acquisition or disposal of the aforementioned security or securities. As investor, you should fully research any security before making an investment decision.

Tuesday, December 17, 2019

Scientx: Earnings Dipped Sequentially

Result Update

For QE31/10/2019, Scientx's net profit rose 51% y-o-y to RM81 million on the back of a 23%-increase in revenue to RM877 million. When compared to the immediate preceding quarter, QE31/7/2019, net profit dropped 39% while revenue was down 7%.  The q-o-q decrease in revenue was mainly due to lower progress billings recognized for the property division. In line with the lower revenue recognized in current financial quarter, profit before taxation for the current financial quarter was RM116 million compared to the preceding financial quarter of RM177 million.


Table: Scientex's last 8 quarterly results


Graph: Scientex's last 57 quarterly results

Financial Position

As at 31/10/2019, Scientex's financial position is deemed satisfactory with current ratio at 1.2 times and gearing ratio at 0.7 time.

Valuation

Scientex (closed at RM9.53 today) is now trading at a trailing PE of 13.4 times (based on last 4 quarters' EPS of 70.99 sen). At this PER, Scientex is deemed fairly attractive.

Technical Outlook

Scientx is in an uptrend which has been capped by the horizontal line at RM9.40-9.50. If Scientx cannot charge above this resistance, its uptrend will continue.


Chart: Scientex's monthly chart as at Dec 17, 2019 (Source: Malaysiastock.biz)

Conclusion

Based on good financial performance, strong financial position, fairly attractive valuation and positive technical outlook, Scientex remains a good stock for medium to long-term investment.

Note:
I hereby confirm that I do not have any direct interest in the security or securities mentioned in this post. However, I could have an indirect interest in the security or securities mentioned as some of my clients may have an interest in the acquisition or disposal of the aforementioned security or securities. As investor, you should fully research any security before making an investment decision.

Tuesday, December 10, 2019

SCGM: Earnings Increased Sharply

Results Update

In QE31/10/2019, SCGM's net profit rose 83% q-o-q or 144% y-o-y to RM4.0 million while revenue declined 4% q-o-q or 7% y-o-y to RM54 million. The q-o-q decline in revenue was attributed to lower sales contribution from non-customized F&B packaging i.e. lunch boxes, cups and plates. The Group recorded a profit before tax of RM4.2 million in 2Q20, compared to profit before tax of RM2.2 million in 1Q20, in line with lower raw material prices, lower interest expense, higher gain on foreign exchange and higher amount of doubtful debts recovered in 2Q20.

 
Table: SCGM's last 8 quarterly results

 
Graph: SCGM's last 39 quarterly results

Financial Position

SCGM's financial position is deemed adequate with current ratio at 1.26 times while gearing ratio is elevated at 0.87 time.

Valuation

SCGM (closed at RM1.56 yesterday) is now trading at a PE of 26X (assuming the last 2 quarters' EPS can be maintained for a full year).  At this PE, SCGM is deemed fully valued.

Technical Outlook

SCGM broke above its downtrend line at RM0.80 in September. After the breakout, SCGM began a steep uptrend which nearly doubled in price. Its immediate resistance will be from the horizontal line at RM1.60.


Chart 1: SCGM's weekly chart as at Dec 9, 2019 (Source: Malaysiastock.biz)


Chart 2: SCGM's daily chart as at Dec 9, 2019 (Source: Malaysiastock.biz)

Conclusion

Based on improved financial performance & bullish technical outlook, SCGM is a good stock for long-term investment.

Note:

I hereby confirm that I do not have any direct interest in the security or securities mentioned in this post. However, I could have an indirect interest in the security or securities mentioned as some of my clients may have an interest in the acquisition or disposal of the aforementioned security or securities. As investor, you should fully research any security before making an investment decision.

Friday, September 27, 2019

Scientx: Earnings Soared

Result Update

For QE31/7/2019, Scientx's net profit rose 83% q-o-q or 51% y-o-y to RM133 million while revenue was rose 13% q-o-q or 28% y-o-y to RM939 million. The increase in revenue and profits were contributed by better sales performance from both the manufacturing and property divisions.


Table: Scientex's last 8 quarterly results


Graph: Scientex's last 56 quarterly results

Financial Position

As at 31/7/2019, Scientex's financial position is deemed satisfactory with current ratio at 1.3 times and gearing ratio at 0.7 time.

Valuation

Scientex (closed at RM8.89 yesterday) is now trading at a trailing PE of 13.4 times (based on last 4 quarters' EPS of 66.26 sen). At this PER, Scientex is deemed fairly attractive.

Technical Outlook

Scientx was in an uptrend line, SS with support at RM8.00. Its upside is capped by the intermediate downtrend line, RR at RM9.20. An upside breakout above RM9.20 could signal the continuation of its uptrend.


Chart: Scientex's weekly chart as at Sep 26, 2019 (Source: Malaysiastock.biz)

Conclusion

Based on good financial performance, strong financial position, fairly attractive valuation and positive technical outlook, Scientex remains a good stock for medium to long-term investment.

Note:
I hereby confirm that I do not have any direct interest in the security or securities mentioned in this post. However, I could have an indirect interest in the security or securities mentioned as some of my clients may have an interest in the acquisition or disposal of the aforementioned security or securities. As investor, you should fully research any security before making an investment decision.

Thursday, June 27, 2019

Scientx: Earnings Grew Due to Contribution from Newly-Acquired Daibochi

Result Update

For QE30/4/2019, Scientx's net profit dropped 1% q-o-q but rose 19% y-o-y to RM73 million while revenue was rose 8% q-o-q or 38% y-o-y to RM828 million. The Group’s revenue rose q-o-q mainly due to contribution from the newly acquired subsidiary, Daibochi. Profit before tax for the current financial quarter was RM101.4 million, a marginal increase of 1.4% compared to RM100.0 million recorded in the preceding financial quarter.


Table: Scientex's last 8 quarterly results


Graph: Scientex's last 53 quarterly results

Financial Position

As at 30/4/2019, Scientex's financial position is deemed satisfactory with current ratio at 1.2 times and gearing ratio at 0.72 time.

Valuation

Scientex (closed at RM8.56 yesterday) is now trading at a trailing PE of 14.7 times (based on last 4 quarters' EPS of 58.43 sen). At this PER, Scientex is deemed fairly attractive.

Technical Outlook

Scientx was in an uptrend line, SS which accelerated in a steep uptrend lien, S1-S1 in 2016 & 2017. The share price then broke this steep uptrend line, S1-S1 and tentatively established a more gradual uptrend line, S1-test the uptrend line, S1-S2 at RM7.50.


Chart 1: Scientex's weekly chart as at Jun 26, 2019 (Source: Malaysiastock.biz)


Chart 2: Scientex's monthly chart as at Jun 26, 2019 (Source: Malaysiastock.biz)

Conclusion

Based on good financial performance, strong financial position, fairly attractive valuation and mildly positive technical outlook, Scientex remains a good stock for medium to long-term investment.

Note:
I hereby confirm that I do not have any direct interest in the security or securities mentioned in this post. However, I could have an indirect interest in the security or securities mentioned as some of my clients may have an interest in the acquisition or disposal of the aforementioned security or securities. As investor, you should fully research any security before making an investment decision.

Monday, February 25, 2019

BOXPAK: Into the Red Again

Result Update

For QE31/12/2018, Boxpak slipped back into the red again. It reported a net loss of RM8.4 million as compared to a net profit of RM1.2 million in QE30/9/2018. Revenue rose 3% q-o-q or 20% y-o-y to RM173 million due mainly due to increased sales volume in Q4, 2018.

Boxpak recorded a loss before taxation of RM6.1 million, compared to a profit before taxation of RM1.0 million in Q3, 2018, due to a pre-operating loss of RM1.3 million for its Myanmar plant; higher unrealized foreign exchange losses in Q4, 2018; and, lower gross profit of RM12.7 million as compared to RM15.4 million (due to higher manufacturing expenses in Malaysia and Vietnam).


Table: Boxpak's last 8 quarterly results


Graph: Boxpak's last 55 quarterly results

Financial Position

Due to its rapid growth, Boxpak's financial position is a bit stretched. Liquidity is tight with current ratio at 1.0 time as at 31/12/2018 while gearing is elevated with total liabilities to total equity at 1.8 times.

Valuation

Boxpak (closed at RM1.27 last Friday) is now trading at a Price to Book of 0.6 time (based on NTA per share of RM2.08).

Technical Outlook

Boxpak has broken above its downtrend line at RM1.00 at the end of December last year. It should find support at this breakout level of RM1.00, which is also a psychological support level.


Chart 1: Boxpak's daily chart as at Feb 22, 2019 (Source: Malaysiastock.biz)


Chart 2: Boxpak's monthly chart as at Feb 22, 2019 (Source: Malaysiastock.biz)

Conclusion

As Boxpak has fallen back into a loss-making position, the case for buying this stock for a recovery play is negated. However, due to its deeply discounted share price, I would rate Boxpak as a HOLD while we await a more definite turnaround in its financial performance.

Note:
I hereby confirm that I do not have any direct interest in the security or securities mentioned in this post. However, I could have an indirect interest in the security or securities mentioned as some of my clients may have an interest in the acquisition or disposal of the aforementioned security or securities. As investor, you should fully research any security before making an investment decision.

Friday, November 23, 2018

Muda: A Surprisingly Strong 3Q

Results Update

For QE30/9/2018, Muda's net profit rose 118% q-o-q or 47-fold y-o-y to RM25 million while its revenue rose 8% q-o-q & y-o-y to RM381 million. Revenue rose mainly due to improvement in selling prices for industrial paper and paper packaging products. Compared to the corresponding quarter in previous year, higher segment profit in current quarter is mainly attributable to improvement in the selling prices and lower production cost in the Manufacturing Division with minor segment margin improvement in the Trading Division.


Table: Muda's last 8 quarterly results


Graph: Muda's last 50 quarterly results
 

Financial Position

Muda's financial position is deemed adequate with current ratio at 1.1 times and total liabilities to total equity at 0.9 time.

Valuation

Muda (trading at RM2.12 as at 3.15pm) is trading at a PE of 10.1 times (based on last 4 quarters' EPS of 20.88 sen). At this PER, Muda is deemed fairly attractive.

Technical Outlook

Mudahas been trading sideways for the past 6 months between RM1.50 & RM2.20. If it can break above RM2.20 (on the back of the current good performance), it may charge up to the May high of RM2.86-2.90.


Chart 1: Muda's daily chart as at Nov 23, 2018_2.50pm (Source: Malaysiastock.biz)

Looking at the monthly chart, Muda has strong resistance at RM2.35-2.50.


Chart 2: Muda's monthly chart as at Nov 23, 2018_2.50pm (Source: Malaysiastock.biz)

Conclusion

Based on good financial performance and attractive valuation, Muda is a good stock for long-term investment.

Note:

I hereby confirm that I do not have any direct interest in the security or securities mentioned in this post. However, I could have an indirect interest in the security or securities mentioned as some of my clients may have an interest in the acquisition or disposal of the aforementioned security or securities. As investor, you should fully research any security before making an investment decision.

Thursday, November 22, 2018

Boxpak: Finally Profits Came!

Background

Box-pak (Malaysia) Berhad ("Boxpak") is one of the leading corrugated carton and die cut trays manufacturers in the Asean region. It has 2 plants in Malaysia (Selangor and Johor), 2 plants in Vietnam ( Hanoi adn Ho Chi Minh) and 1 plant in Myanmar (opened this year). The group has 1400 employees and plant capacity of 175000 MT. It is a subsidiary of Kianjoo.


Result Update

For QE30/9/2018, Boxpak returned to the black after 7 quarters of losses. It made a net profit of RM1.2 million on a revenue of RM168 million. Group revenue rose 12.6% q-o-q mainly due to increased sales volume in Q3, 2018. Gross profit increased from RM11.3 million in Q2, 2018 to RM15.4 million in Q3, 2018, as a result of higher sales tonnage and improved margins contributed by higher selling prices. Consequently, the Group recorded a profit before taxation of RM1.0 million in Q3, 2018 as compared to a loss before taxation of RM2.8 million in Q2, 2018.


Table: Boxpak's last 8 quarterly results


Graph: Boxpak's last 54 quarterly results

Financial Position

Due to its rapid growth, Boxpak's financial position is a bit stretched. Liquidity is tight with current ratio at 1.0 time as at 30/9/2018 while gearing is elevated with total liabilities to total equity at 1.7 times.

Valuation

Boxpak (closed at RM0.87 yesterday) is now trading at a Price to Book of 0.40 time (based on NTA per share of RM2.15).

Technical Outlook

Boxpak has been sliding for the past 3 years, from a high of RM3.00 to a recent low of RM0.87. There is no sign yet that it is even attempting to make a bottom. That might change with the report of its first quarterly profit after nearly 2 years.


Chart: Boxpak's monthly chart as at Nov 21, 2018 (Source: Malaysiastock.biz)

Conclusion

Based on its return to profitability and deeply discounted share price, Boxpak could be a good stock for long-term investment. Share price recovery will come slowly and it will be dependent on the continuity and magnitude of its profitable financial performance.

Note:
I hereby confirm that I do not have any direct interest in the security or securities mentioned in this post. However, I could have an indirect interest in the security or securities mentioned as some of my clients may have an interest in the acquisition or disposal of the aforementioned security or securities. As investor, you should fully research any security before making an investment decision.

Friday, September 21, 2018

Scientx: Earnings Picked Up

Result Update

For QE31/7/2018, Scientx's net profit rose 44% q-o-q or 22% y-o-y to RM88 million while revenue was rose 22% q-o-q or 13% y-o-y to RM733 million. Profit before taxation rose 39% q-o-q due to better sales performance from both the manufacturing and property divisions as well as contribution from Klang Hock Plastic Industries Sdn Bhd (KHPI). From the date of acquisition (on 2 May 2018), KHPI has contributed approximately RM96,622,000 of revenue and net profit of RM5,685,000 to the Group.


Table: Scientex's last 8 quarterly results

It is encouraging that Scientx achieved a new high in term of PBT and revenue in the last quarter.


Graph: Scientex's last 52 quarterly results

Financial Position

As at 31/7/2018, Scientex's financial position is deemed satisfactory with current ratio at 1.1 times and gearing ratio at 0.83 time.

Valuation

Scientex (closed at RM8.57 yesterday) is now trading at a trailing PE of 14.4 times (based on last 4 quarters' EPS of 59.58 sen). At this PER, Scientex is deemed fairly attractive.

Technical Outlook

Scientx has broken above its intermediate downtrend line, RR at RM8.25 in August 2018. Despite the upside breakout, the share price refused to launch into an upleg. With the new high for revenue and profits, Scinetex may finally continue its uptrend again. We will have to wait and see.


Chart: Scientex's daily chart as at Sep 20, 2018 (Source: Malaysiastock.biz)

Conclusion

Based on good financial performance, fairly attractive valuation and mildly positive technical outlook, Scientex remains a good stock for medium to long-term investment. The new high for revenue and profits may be the catalyst for continuation of its prior uptrend.

Note:
I hereby confirm that I do not have any direct interest in the security or securities mentioned in this post. However, I could have an indirect interest in the security or securities mentioned as some of my clients may have an interest in the acquisition or disposal of the aforementioned security or securities. As investor, you should fully research any security before making an investment decision.

SCGM: Tentative Earning Recovery

Results Update

In QE31/72018, SCGM's net profit rose 6 folds q-o-q on the back of a 16%-increase in revenue to RM56 million. When compared to same quarter last year, net profit dropped 81% while revenue rose 4%. Revenue increased q-o-q, mainly due to higher sales from local and overseas markets. PBT rose q-o-q in line with higher revenue achieved for the current quarter. PBT dropped y-o-y due to higher resin prices, higher finance costs, higher electricity costs, higher depreciation charges, higher labor cost and foreign exchange losses incurred

 
Table: SCGM's last 8 quarterly results

 
Graph: SCGM's last 38 quarterly results

Financial Position

SCGM's financial position is deemed adequate with current ratio at 1.25 times while gearing ratio is elevated at 0.96 time.

Valuation

SCGM (closed at RM1.42 yesterday) is now trading at a PE of 23X (based on last 4 quarters' EPS of 6.16  sen).  At this PE, SCGM is deemed fully valued. However, PE will improve once earning starts to increase.

Technical Outlook

After a steady decline, SCGM seems to have found support at RM1.30-1.40.


Chart: SCGM's weekly chart as at Sep 20, 2018 (Source: Malaysiastock.biz)

Conclusion

Based on tentative recovery in earnings, adequate financial position and possible bottoming of the share price, vised my rating for SCGM from a SELL to a HOLD.

Note:

I hereby confirm that I do not have any direct interest in the security or securities mentioned in this post. However, I could have an indirect interest in the security or securities mentioned as some of my clients may have an interest in the acquisition or disposal of the aforementioned security or securities. As investor, you should fully research any security before making an investment decision.

Thursday, August 23, 2018

Kianjoo: Earnings Dropped Sharply

Result Update

For QE30/6/2018, Kianjoo's net profit dropped by 60% q-o-q or 70% y-o-y to RM4.6 million while revenue dropped by 4% q-o-q or 3% y-o-y to RM429 million. Revenue dropped y-o-y due to decrease in demand for some of the Group's products and offset by upward adjustments of selling price to absorb the increase in cost of direct material. Gross profit declined to RM43.9 million from RM61.2 million in QE30/6/2017 due to decrease in revenue and increased cost of tin plate, aluminium and paper rolls. Consequently, profit before tax decreased to RM5.2 million from RM18.9 million in QE30/6/2017. During the quarter, the Group incurred pre-operating loss of RM3.4 million from a new cartons factory in Myanmar- which is expected to incur losses in the remaining quarter of the year due to pre-operating cost incurred.


Table: Kianjoo's last 8 quarterly results


Graph: Kianjoo's last 47 quarterly results

Financial Position

As at 30/6/2018, Kianjoo's financial position is deemed satisfactory with current ratio at 1.6 times and gearing ratio at 0.7 times.

Valuation

Kianjoo (closed at RM2.62 last Tuesday) is now trading at a PE of 16 times (based on last 4 quarters' EPS of 16.3 sen). At this multiple, Kianjoo is deemed fairly valued.

Technical Outlook

Kianjoo broke its long-term uptrend line, SS at RM3.10 in June 2016. Since then, it has been drifting lower. Its immediate support is at RM2.50 and the next support will be at RM2.10.


Chart 1: Kianjoo's monthly chart as at Aug 21, 2018 (Source: Shareinvestor.com)


Chart 2: Kianjoo's weekly chart as at Aug 21, 2018 (Source: Shareinvestor.com)

Conclusion

Based on continued weaker financial performance and full valuation, I revise my rating for Kianjoo a HOLD to REDUCE.

Note:
I hereby confirm that I do not have any direct interest in the security or securities mentioned in this post. However, I could have an indirect interest in the security or securities mentioned as some of my clients may have an interest in the acquisition or disposal of the aforementioned security or securities. As investor, you should fully research any security before making an investment decision.