Showing posts with label health care. Show all posts

Friday, December 10, 2021

Topglov: Revenue & Profits Have Landed

Result Update

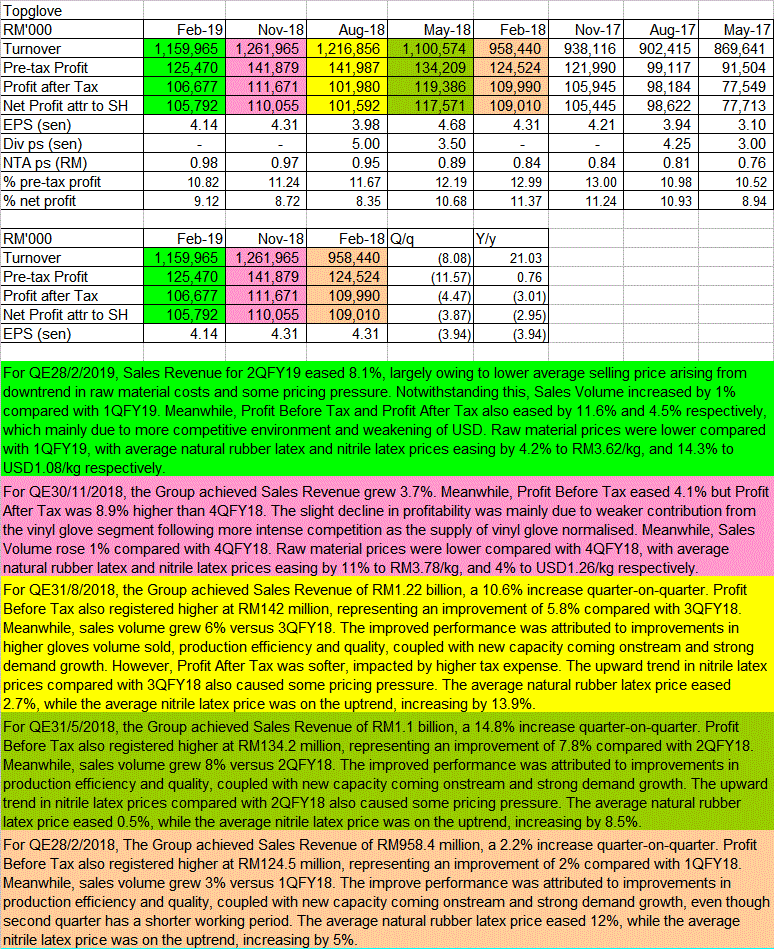
For QE30/11/2021 (1QFY2022), Topglov's net profit dropped 69% q-o-q or 92% y-o-y to RM186 million while revenue dropped 25% q-o-q or 67% y-o-y to RM1.584 billion. The Group’s weaker quarter-on-quarter performance for 1QFY2022 was mainly attributed to declining average selling prices ('ASPs') and higher operating costs as a result of lower utilisation rates, while raw material costs reduced at a much slower pace in comparison to glove ASPs, thereby impacting profit. Raw material prices for the quarter ended 1QFY2022 have reduced from 4QFY2021, with average natural latex concentrate prices reducing by 8% from RM5.54/kg to RM5.09/kg, whilst nitrile latex price fell 19% from USD2.21/kg to USD1.79/kg.


Table: Topglov's last 8 quarterly results
Looking at the quarterly result graph below, we can see that revenue, profits and even profit margins are now lower than QE31/5/2020. Not surprisingly, dividend is lower than that paid out in QE31/5/2020.


Graph: Topglov's last 77 quarterly results
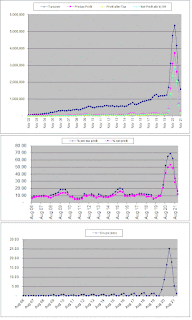
The perennial qustion - are we there yet? - has to be asked. To be frank, I don't think anyone has a quick answer. The mismatched between increased supply and reduced demand could lead to a period of lower ASPs. If that's a serious problem, imagine what would happen if a price war broke out. You may ask why would anyone engage in a price war at a time like this. The need to increase sales to match the increased capacity, would drive the players to engage in a price war! 

The price war would lead to lower revenue & lower contribution. With lower contribution, you would not be able to cover the increased overhead expenses from the increased capacity. You may note that Topglov's Property, Plant & Equipment has risen by 42% from RM2.874 billion as at May 2020 to RM4.090 billion as at November 2021. 

Based on the above, I think the prospect of further decline in profit cannot be ruled out.

Financial Position

As at 30/11/2021, Topglov's financial position is deemed healthy with current ratio at 2.0 times and Total liabilities to Total equity at 0.30 time.

Valuation

Topglov (closed at RM2.18 as at 4.05 pm) is now trading at a PE of 23 times (based on annualized EPS of 9.28 sen). That's a fair valuation if we assumed that Topglov's profit remains steady at current level. As discussed above, the prospect of lower profits or even losses, could not be discounted.

Its planned listing on the HKEX may give an indication of the management's "outlook" for the share price (here). The amount it plans to raise from its proposed Hong Kong listing is about RM2.21 billion. The number of shares it will issue for the Hong Kong listing remains at 793.5 million shares. That means the IPO price will be about RM2.785 per share. However, things are moving so fast that the expected share price may not be achieved. Nevertheless, this is an indication of the internal thinking of its management.

Technical Outlook

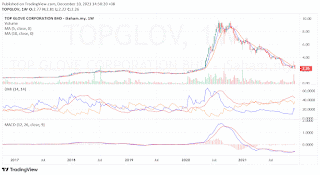
Topglov's downtrend after peaking in October 2020, is still intact. The immediate support is the psychological level of RM2.00.


Chart: Topglov's daily chart as at Dec 10, 2021 (Source: isaham.my)
Conclusion

Based on the current poor financial performance and industrial outlook, Topglov is a stock to be avoided.

Note:

I hereby confirm that I do not have any direct interest in the security or securities mentioned in this post. However, I could have an indirect interest in the security or securities mentioned as some of my clients may have an interest in the acquisition or disposal of the aforementioned security or securities. As investor, you should fully research any security before making an investment decision.

Sunday, June 13, 2021

TOPGLOV: Top-line & Bottom-line Finally Reversed

Result Update

For QE31/5/2021 (3QFY2021), Topglov's net profit dropped 29% q-o-q but rose 485% y-o-y to RM2.036 billion while revenue dropped 22% q-o-q but rose 147% y-o-y to RM4.163 billion. The Group’s softer quarter-on-quarter performance for 3QFY2021 came on the back of adjustments in line with glove market pricing trends, after ASPs had peaked in February 2021. The Sales Volume (Quantity Sold) dropped 4% quarter-on-quarter mainly due to reduction in sales to the U.S., following a temporary halt in shipments to the U.S. from Malaysia, in compliance with requirements of the U.S. Customs and Border Protection. Raw material prices for the quarter ended 3QFY2021 rose from 2QFY2021, with average natural latex concentrate prices up by 8% from RM5.85/kg to RM6.31/kg, whilst nitrile latex price increased marginally by 0.4% from USD2.30/kg to USD2.31/kg.

There you have it; lower sales volume coupled with lower ASPs mean lower revenue, and lower ASPs coupled with slightly higher raw material cost mean lower profit margins.  


Table: Topglov's last 8 quarterly results


Graph: Topglov's last 60 quarterly results

Financial Position

As at 31/5/2021, Topglov's financial position is deemed healthy with current ratio at 1.9 times and Total liabilities to Total equity at 0.50 time.

Valuation

Topglov (closed at RM4.72 last Friday) is now trading at a trailing PE of 4.4 times (based on last 4 quarters' EPS of 106.80 sen). This exceptionally low PE ratio reflects investors' perception that Topglov's future earnings must decline in the near term due to average selling prices & profit margins normalization. This is not unreasonable given the glove demand has been driven by the Covid-19 pandemic, which is expected to be brought under control with the arrival of vaccines worldwide.

I wrote about the possible scenarios of ASPs & profit normalization in my last post on Topglov (here). If Topglov were to trade at its past PE of 31-32 times, then the market is now projecting its 4-quarter net profit of RM1.344 billion in next few quarters. That means its quarterly net profit would be about RM336 million. 

As noted in that post, if the above projection is proven to be too pessimistic, then the market will revise its outlook and the share price will go up, or vice versa

Technical Outlook

Topglov's immediate support is at the horizontal line of RM4.70. If that support failed, the next support is at the horizontal line of RM4.50.


Chart: Topglov's daily chart as at June 11, 2021 (Source: Malaysiastock.biz)

Conclusion

Based on the current strong financial performance, healthy financial position and fairly attractive valuation, Topglov makes a very appealing case as a value stock for long-term investment. However the arrival of vaccines and their positive impact in controlling the spread of the pandemic have changed the narrative of investing in pandemic stocks. The question of whether Topglov is a value stock or a value trap still remain unchanged for now.

Note:

I hereby confirm that I do not have any direct interest in the security or securities mentioned in this post. However, I could have an indirect interest in the security or securities mentioned as some of my clients may have an interest in the acquisition or disposal of the aforementioned security or securities. As investor, you should fully research any security before making an investment decision.

Wednesday, March 10, 2021

TOPGLOV: Fantastic Earnings For Now? (UPDATED)

Result Update

For QE28/2/2021, Topglov's net profit rose 20.8% q-o-q or 24-fold y-o-y to RM2.869 billion while revenue rose 12.7% q-o-q or 336% y-o-y to RM5.365 billion. The Group’s strong and healthy Sales figures were attributed to the continued demand for gloves globally while the improved Profit came on the back of higher sales output, high utilisation levels which amplified production efficiency, coupled with higher average selling prices (ASPs) in line with market pricing. The Group’s healthy profit was also attributed to ongoing enhancements across its operations, through digital transformation, continuous R&D and innovation, quality and productivity initiatives and talent acquisition and development.

 
Table 1: Topglov's last 8 quarterly results


Graph: Topglov's last 74 quarterly results

Financial Position

As at 28/2/2021, Topglov's financial position is deemed healthy with current ratio at 1.9 times and Total liabilities to Total equity at 0.51 time.

Valuation

Topglov (closed at RM5.19 yesterday) is now trading at a trailing PE of 6 times (based on last 4 quarters' EPS of 85.89 sen). This exceptionally low PE ratio reflects investors' perception that Topglov's future earnings must decline in the near term due to average selling prices & profit margins normalization. This is not unreasonable given the glove demand has been driven by the Covid-19 pandemic, which is expected to be brought under control with the arrival of vaccines worldwide.

My previous 2 earnings reports on Topglov prior to the pandemic were in June 2019 (here) and October 2018 (here). In these reports, Topglov was trading at a PE of 31-32 times. Assuming that Topglov's fair PE is 32 times, the only way that Topglov's current share price can be justified is for its quarterly earnings to drop by a whopping 81% from RM2.869 billion to RM545 million! Is that too extreme?! 

To get a better feel of how much Topglov's net profit has risen, let's compare the financial performance in the last 4 quarters against the performance in the preceding 4 quarters. Ssee Table 2 below. 

Table 2: Topglov's latest 4 quarterly results compared to the previous 4 quarterly results

The first thing that would jump up is the staggering 18-fold increase in net profit from RM382 million to RM6.885 billion! This was achieved on the back of a 210%-increase in revenue from RM4.819 billion to RM14.922 billion. From the foregoing, I would highlight 2 points:

(a) Topglov's net profit margin has shot up from a mere 7.9% to 46.1%.  

(b) As a result, quarterly net profit rose from an average of RM95 million to RM1.721 billion. 

With the pandemic being brought under control, it is likely that the abnormally high net profit margin will decline over the next few quarters. I have computed 4 scenarios of lower net profit margin. See Table 3 below.

Table 3: Topglov's 4 possible scenarios of net profit margin & valuation estimate

If we accept that Topglov would eventually trade at its past PE of 31-32 times, then the market is now projecting its 4-quarter net profit would go down to RM1.344 billion in next few quarters. That means its quarterly net profit would be about RM336 million. 

Nothing is a sure thing in investing. If the above computation and assumptions are too pessimistic and proven wrong later, then the market will revise its outlook and the share price will go up, or vice versa. For now, this is what's the market is telling us.

Technical Outlook

Topglov has peaked at RM9.76 in early August, and then went into a gradual decline. If you plot a semi-log chart, it is possible to draw an uptrend line, SS with support at RM4.60.


Chart 1: Topglov's semi-log daily chart as at Mar 9, 2021 (Source: Malaysiastock.biz)

Conclusion

Based on the current strong financial performance, healthy financial position and fairly attractive valuation, Topglov makes a very appealing case as a value stock for long-term investment. However the arrival of vaccines and their positive impact in controlling the spread of the pandemic have changed the narrative of investing in pandemic stocks. Is Topglov a value stock or a value trap? Only time will tell. 

Note:

I hereby confirm that I do not have any direct interest in the security or securities mentioned in this post. However, I could have an indirect interest in the security or securities mentioned as some of my clients may have an interest in the acquisition or disposal of the aforementioned security or securities. As investor, you should fully research any security before making an investment decision.

Wednesday, November 11, 2020

Kossan: Earnings Soared But Share Price Floored

Result Update

For QE30/9/2020 (3Q20), Kossan's net profit rose 166% q-o-q or 6-fold y-o-y to RM349 million while revenue rose 47% q-o-q or 95% y-o-y to RM1.033 billion.

The improved performance was attributable to the improvement in all its three divisions – Gloves, Technical Rubber Products and Cleanroom. The improvement in the Gloves and the Cleanroom divisions were especially significant. To wit:

The Gloves division’s revenue increased 103.24% to RM946.57 million in 3Q20 from RM465.75 million in 3Q19, with PBT rising 670.80% to RM416.65 million in the current quarter as compared with RM54.06 million from a year ago. The improved performance was mainly attributable to the higher volume sold (+34.9%) and higher average selling price as compared with 3Q19.

The Cleanroom division grew revenue and PBT by 118.82% and 1131.80% respectively to RM40.25 million and RM10.19 million in 3Q20, as compared with RM18.40 million and RM0.83 million in 3Q19. The improved performance was mainly attributable to the increase in the demand for the division’s products as a result of the COVID-19 pandemic.


Table: Kossan's last 8 quarterly results


Graph: Kossan's last 56 quarterly results

Financial Position

Kossan's financial position as at 30/9/2020 is deemed healthy with current ratio at 1.7 times while gearing ratio was at 0.6 time.

Valuation

Kossan (closed at RM6.58 yesterday) is now trading at a trailing PE of 13.9 times (based on last 4 quarters' EPS of 47.36 sen). At this PER, Kossan is deemed fairly attractive. In fact, this PE is lower than the PE multiple assigned by the market in 2019. This shows that investors have begun to discount the impact of the vaccine on the future sales of Kossan as well as other glove makers. If the arrival of the vaccines are delayed or the logistics are too daunting, then there is a likelihood that the strong demand for gloves will persist for a while.

Technical Outlook

Kossan is in a long-term uptrend line, SS with support at RM7.00 yesterday. The breakdown of the uptrend line may lead to further decline unless a quick rebound takes place. In September, Kossan broke its uptrend line, SS but it rebounded the next day. We will have to wait and see how Kossan to fare today.


Chart: Kossan's monthly chart as at November 10, 2020 (Source: Malaysiastock.biz)

Conclusion

Despite the developing negative technical outlook, Kossan is a good stock for long-term investment based on good financial performance and financial position and fairly attractive valuation.

Note: 

I hereby confirm that I do not have any direct interest in the security or securities mentioned in this post. However, I could have an indirect interest in the security or securities mentioned as some of my clients may have an interest in the acquisition or disposal of the aforementioned security or securities. As investor, you should fully research any security before making an investment decision.

Tuesday, August 11, 2020

Supermx: Soaring like an Eagle


Result Update

For QE30/6/2020, Supermx's net profit rose more than 3-fold q-o-q or more than 24 times y-o-y to RM400 million while revenue rose 108% q-o-q or 147% y-o-y to RM929 million. In the notes to the Financial Statement, the company explained its spectacular y-o-y performance in these words:

Supermax achieved its best ever quarterly financial performance in its history. Revenue soared to RM929.1 million, which was 147.1% or RM553.2 million higher compared to the corresponding Quarter a year ago. Profitability rose sharply with EBITDA, PBT and PAT margins at its highest ever and industry leading levels of 60.4%, 55.9% and 43.9% respectively. The Group‟s performance was mainly due to: 
a) An exponential rise in demand for Medical Gloves & other PPEs on the back of the Covid19 pandemic. 
b) Increase in additional production capacity from the newly commissioned lines at plant # 12 block A lines. 
c) Increase in average selling prices (ASPs) each month started in March, 2020 for both its Manufacturing and Distribution divisions. 
d) Increase in percentage of the Group‟s capacity & Global Sales to end-users; including sales to governments and government agencies of various countries where Supermax Group operates and in over 165 countries.
e) Proven business model through Own Brand Manufacturing (OBM) with 2-streams of income via Manufacturing & Distribution.

Amen!

Table : Supermx's last 8 quarters' P&L

Graph: Supermx's last 55 quarters' P&L

Financial Position

Supermx's financial position as at 30/6/2020 is very healthy with current ratio at 1.3 times while gearing ratio was at 1.0 time. The company commented generously about its improved financial position as follows:

Supermax‟s already sound financial position has strengthened dramatically, most notably to a net cash position with cash & bank balances amounting to RM1.18 billion as of 30 June 2020 compared to RM173.8 million a year before. The increase is mainly due to customers paying 30%, 40% and 50% deposits in advance to secure supply.

Thanks to the deposits collected to the tune of RM892 million, Supermx was sitting on a huge cashpile of more than a billion ringgit! But bearing in mind, this is customers' money paid upfront.

Outstanding Corporate Exercise

Supermx has declared a 1-for-1 bonus which is pending shareholders' approval at its upcoming EGM on 18 August 2020 (here). Meanwhile the company has proposed a dividend-in-specie of 1 Treasury share for every 45 shares owned after the implementation of the said bonus issue (here).

Valuation

Supermx (closed at RM21.20 yesterday) is now trading at a PER of 53x (based on last 4 quarters' adjusted EPS of 40.20 sen). If we annualized the latest quarterly EPS of 30.58 sen to arrive at a full-year EPS of 122.32 sen, then its PER will be lowered to 17 times. However, I believe to compute PER based on the annualized EPS of 122.32 sen may be too generous if we looked ahead to the normalization of profit due to increased supply of gloves (as a result of increased capacity) as well as lower demand if Covid-19 pandemic were to subside. This will be a tough judgement call for analysts and investors.

Technical Outlook

Supermx share price had rallied sharply from RM2.00 in April to a high of RM23.00 just 3 days ago. Technical speaking, the share price may still go higher in the near term.

Chart: Supermx's daily chart as at Aug 10, 2020 (Source: Malaysiastock.biz)

Conclusion

Based on excellent financial performance & satisfactory financial position, fairly attractive valuation, generous bonus issue ahead and still positive technical outlook, I think Supermx deserved to be rated as a HOLD.

Note:

I hereby confirm that I do not have any direct interest in the security or securities mentioned in this post. However, I could have an indirect interest in the security or securities mentioned as some of my clients may have an interest in the acquisition or disposal of the aforementioned security or securities. As investor, you should fully research any security before making an investment decision.

Thursday, July 23, 2020

Pharma & DPharma: Some Inconvenient Questions

In the past 2 days, we have been witnessing spectacular rallies for 2 pharmaceutical stocks, Pharma and DPharma. What prompted the rally was an announcement on July 14 by the Science, Technology & Innovation Minister, Khairy that Pharma and DPharma will do the "fill-and-finish" process for the re-packing the Covid-19 vaccine when it becomes available (here).

We know that the market is getting wary of glove stocks after the spectacular rally, and many players are now looking for something else to play. So the above story seems like just the right catalyst to shift to new stocks that are (1) relatively inexpensive vis-a-vis the glove stocks and (2) they can still be counted as pandemic stocks. 

However, there are a few inconvenient questions which we must answer if and when we want to get into Pharma and DPharma. They are:

1) When will the vaccine be available? Despite promising progress made, the first vaccine will be at least 18 months from now. That's the optimistic case!

2) Will the vaccine be produced in sufficient quantity to reach our shore? This is a tough one. The answer is probably not for a few years as demand will continue to outstrip supply, and America- the epicenter of the pandemic- has shown that it is willing to use its enormous muscle to buy up everything.

3) Can Pharma and DPharma handle the fill-and-finish process? While they may have done similar process for other drugs or vaccines, the new vaccine for Covid-19 will be novel and involve complex chemistry. They may need special pharmaceutical-grade glass to be bottled in. This is taken from an interview given by Bill Gates in the Vox magazine back in April (here). When asked by the interviewer, Ezra Klein about how much of a limiting factor will the manufacturing supply chain capacity be, Bill Gates replied:
For some of these vaccine constructs, it’s hard to scale up the manufacturing, partly because they are novel or just because the chemistry is very complex. And you’re in a new regime when you talk about making billions of a vaccine. We don’t make billions of any vaccine. We make hundreds of millions, but for those, we’ve had decades to work on their efficiency.
Even the fill finish at the very end where you put it in a glass bottle, that’s a special pharmaceutical-grade glass — the world doesn’t have enough of that. So we’re working to get that underway because all the vaccine approaches need to be put into a bottle at some point in time. I hope we get to the point where it’s the manufacturing piece because those investments are at most billions to save trillions.
4) Where is the market for the end-product, the re-bottled vaccine? If it is for the local market, then that market is too small for the time and effort required to get into the business. I presume it would include overseas market, such as Indonesia etc. I remember our pharmaceutical companies needed a long time to apply for licenses to distribute individual drugs in Indonesia. I think the same should continue now and this will delay the business.  


Chart 1: Pharma's weekly chart as at July 23, 2020_9.30am (Source: Malaysiastock.biz)


Chart 2: DPharma's weekly chart as at July 23, 2020_9.30am (Source: Malaysiastock.biz)

All in all, I think we have to temper our enthusiasm to get into Pharma and DPharma as well as other pharmaceutical stocks which have gone up substantially. The investment basis may be comparable in some way to glove stocks, since they are deemed to be pandemic stocks, but the case for pharmaceutical stocks is very weak, unlike glove stocks. Be careful!

Sunday, July 05, 2020

Technology Play: Which Sub-sectors or Stocks to Buy?

Last week, tech stocks have chalked up significant gain. If you wondering how to identify laggard tech stocks to add to your portfolio or watch list, this is one way you can consider.

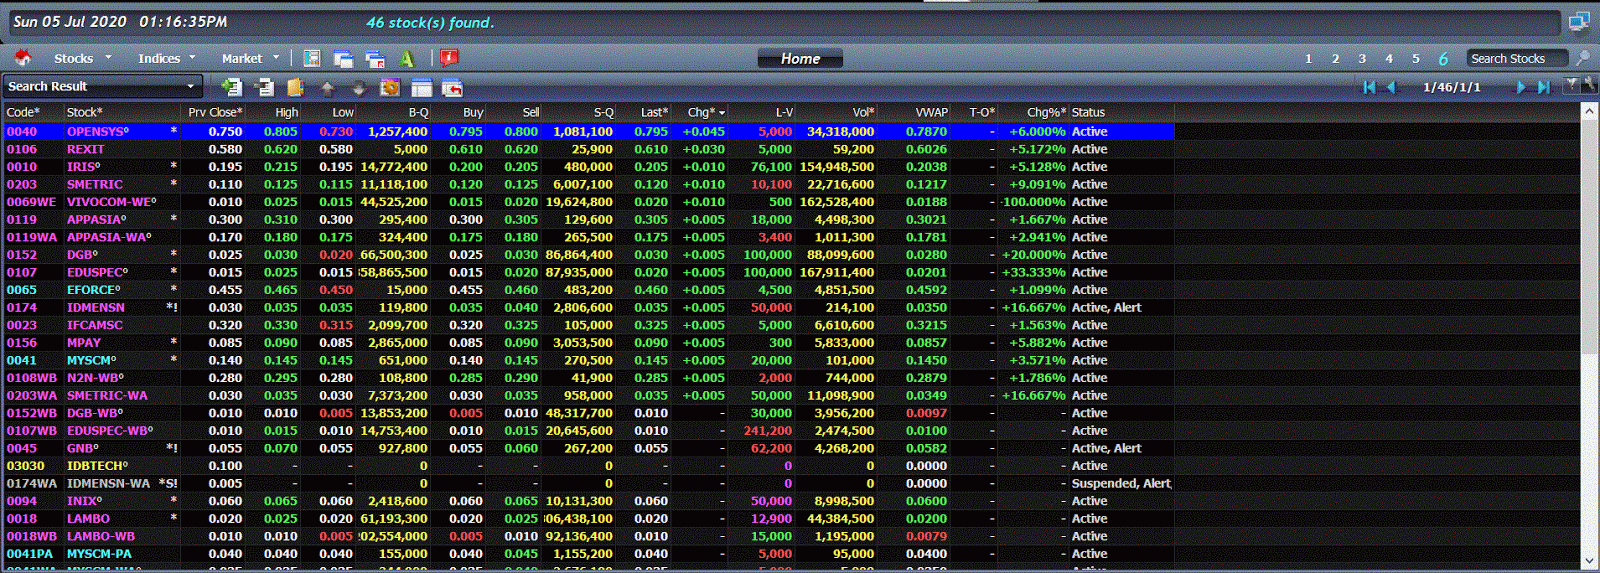
Firstly, you need to identify which sub-sectors have shown out-performance. The Technology sector is divided into 4 sub-sectors: Digital Services, Semiconductors, Software and Technology Equipment. Below I have shown the steps to look at one of the sub-sectors, Digital Services. Then you choose "Price Change" and sort it by "Descending" order to filter out the out-performers.  


Diagram 1: How to pick out stocks in a sub-sector within the Technology sector

Below are the tables of out-performers for all the 4 sub-sectors of the Technology sector. You would notice that there are more gainers among the "Semiconductor" and "Technology Equipment" sub-sectors. This is not surprising as Malaysia is stronger in manufacturing than software or services.


Table 1: Top performers in the Digital Services sub-sector within the Technology sector


Table 2: Top performers in the Semiconductor sub-sector within the Technology sector


Table 3: Top performers in the Software sub-sector within the Technology sector


Table 4: Top performers in the Technology Equipment sub-sector within the Technology sector

After you have narrowed down the out-performing sub-sectors, you can choose the stocks to track or to buy. Assuming you want to buy the laggards; you should study their financial performance and the reason for their poorer financial performance. If you feel that the poorer financial performance may change, and the company's financial position is fairly sound, then you may position yourself in these laggards and wait for their turn to go higher.

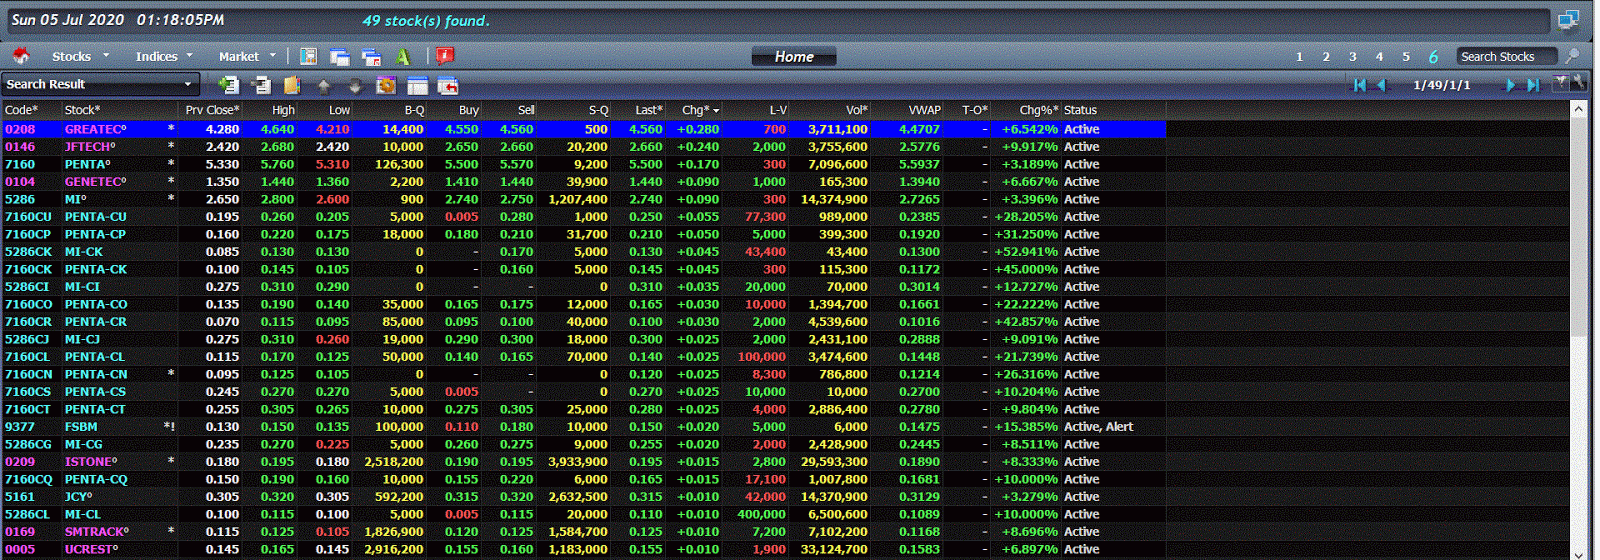
You may try the same approach for Health Care sector. You will soon get the confirmation that this sector is pretty much all about glove stocks.

Diagram 2: How to pick out stocks in a sub-sector within the Health Care sector


Table 5: Top performers in the Health Care Equipment & Services sub-sector within the Healthcare sector

Look at the long list of out-performing glove stocks & related CWs above. The laggards among the glove stocks are not really laggards nor are they cheap. In my opinion, the whole glove stocks universe has gone up so much that you have to accept them not as value stocks, but as growth stocks which come with a high premium. The high premium can be justified if the earnings growth continues. If it stopped - or the market perceived that it may stop - the rollback can be very sharp.

That's what happened in late June when the market learned that glove prices have softened (here). Since then, the share prices rallied again, which could only mean that the report of the softening of glove prices was wrong or exaggerated. Anyway, that's the risk that you have to take if you get into glove stocks now.

The above are the steps that you can use to identify the out-performing sub-sectors in the Technology and Health Care sectors, and then you can pick up certain stocks to buy or track according to your investing or trading strategy. Good luck!

Friday, November 29, 2019

KPJ: Earnings Growth Continued

Result Update 

For QE30/9/2019, KPJ's net profit rose 11% q-o-q or 12% y-o-y to RM46 million while revenue rose 7% q-o-q or 10% y-o-y to RM906 million. Group revenue rose 10% revenue due to the increase in number of patient visits, radiology cases and surgeries especially for KPJ Johor, KPJ Selangor and KPJ Rawang. The new addition to the Group’s group of hospitals, KPJ Batu Pahat, which commenced its operation on 18 September 2019, also contributed to the improved revenue of the period. Increased activities within the support companies also contributed to the revenue growth.

Profit before tax recorded 16% increase to RM69.3 million during this quarter from RM59.9 million in the same quarter in 2018 led by the increase in revenue by 10%. Despite the fact that the increase in profit before tax has been set-off by the MFRS 16 impact recognized during the quarter especially on depreciation and finance costs amounting to RM9.7 million and RM14.0 million respectively, the Group managed to set higher profit before tax margin with 7.9% as compared to last year’s 7.5%. This was due to cost optimization and initiatives from the hospitals as well as better performance by support companies.


Table: KPJ's last 8 quarterly results


Graph: KPJ's last 47 quarterly results

Financial Position

As at 30/9/2019, KPJ's financial position is deemed adequate with current ratio at 1.15 times while gearing ratio was elevated at 2.03 times.

Valuation

KPJ (closed at RM0.905 yesterday) is now trading at a PE of 21 times (based on last 4 quarters' EPS of 4.31 sen). At this PER, KPJ is fully valued.

Technical Outlook

KPJ has been moving sideways for the past 5-6 years. If it can break above the high achieved during the past 5-6 years at RM1.15-1.20, KPJ's uptrend can begin.


Chart: KPJ's monthly chart as at Nov 28, 2019 (Source: Malaysiastock.biz)

Conclusion

Based on improving financial performance and exposure to a growing consumer service sector, KPJ could be a good stock for long-term investment. However, its high valuation and neutral technical outlook mean that the stock is likely to trade sideways around RM0.90-1.10 for a while longer.

Note:
I hereby confirm that I do not have any direct interest in the security or securities mentioned in this post. However, I could have an indirect interest in the security or securities mentioned as some of my clients may have an interest in the acquisition or disposal of the aforementioned security or securities. As investor, you should fully research any security before making an investment decision.

Wednesday, August 07, 2019

Harta: Earnings Dropped 25% Due to Lower Revenue

Result Update

For QE30/6/2019, Harta's net profit rose 3% q-o-q but dropped 25% y-o-y to RM94 million while revenue dropped 6% q-o-q or 9% y-o-y to RM640 million. Revenue dropped q-o-q mainly due to decrease in sales volume for the quarter. Profit before tax for the quarter increased by RM8.0 million or 7.0% as compared with preceding quarter mainly due to lower cost of upkeep, electricity and packaging.


 Table: Harta's last 8 quarterly results


Graph: Harta's last 47 quarterly results

Financial Position

As at 30/6/2019, Harta's financial position is deemed healthy with current ratio at 2.56x and gearing ratio at 0.31x.

Valuation

Harta (closed at RM5.05 yesterday) is trading at a trailing PER of 40 times (based on last 4 quarters' EPS of 12.58 sen). At this PER, Harta is deemed overvalued.

Technical Outlook

Harta is in an uptrend line, with support at RM4.80.


Chart 1: Harta's daily chart as at Aug 6, 2019 (Source: Malaysiastock.biz)


Chart 2: Harta's monthly chart as at Aug 6, 2019 (Source: Malaysiastock.biz)

Conclusion

Based on weaker financial performance and demanding valuation, I rate Harta as a SELL or TAKE PROFIT.

Note:
I hereby confirm that I do not have any direct interest in the security or securities mentioned in this post. However, I could have an indirect interest in the security or securities mentioned as some of my clients may have an interest in the acquisition or disposal of the aforementioned security or securities. As investor, you should fully research any security before making an investment decision.

Wednesday, June 19, 2019

Topglov: Bottom-line plunged

Results Update

For QE31/5/2019, Topglov's net profit dropped 29.4% q-o-q or 36.5% y-o-y to RM74.7 million while revenue rose 2.6% q-o-q or 8.1% y-o-y to RM1.190 billion. Revenue increased due to 2%-increase in Sales Volume plus increase in ASPs.

Meanwhile, Profit Before Tax and Profit After Tax eased by 34.5% and 29.5% respectively. This was attributed to a 22% surge in the price of natural rubber latex compared with QE28/2/2019, coupled with strong competition as well as the time lag in passing on cost to customers, which affected the natural rubber glove profit contribution. However, the situation has improved from May 2019 onwards due to the effect of selling price revision. The nitrile latex price decreased slightly by 3.1% to USD1.05/kg, which mitigated the impact from competition in nitrile glove segment.

 
Table: Topglov's last 8 quarterly results


Graph: Topglov's last 50 quarterly results

Valuation

Topglov (closed at RM4.87 yesterday) is now trading at a trailing PE of 32 times (based on last 4 quarters' EPS of 15.35 sen). At this PER, Topglov is deemed overvalued.

Technical Outlook

Topglov dropped sharply yesterday after the release of its poor result during the mid-day break. The price tested the medium-term uptrend line, S1-S1 at RM4.65 before it recovered to close at RM4.87. It is possible that Topglov may re-test the medium-term uptrend line again given the sharp decline in earnings last quarter. If the medium-term uptrend line, S1-S1 cannot hold, the next support will be the horizontal line at RM4.20.


Chart 1: Topglov's daily chart as at June 18, 2019 (Source: Malaysiastock.biz)


Chart 2: Topglov's weekly chart as at June 18, 2019 (Source: Malaysiastock.biz)

Conclusion

Based on weaker financial performance and high valuation, I revise my rating for Topglov to a Trading Sell. A good sale would be closer to RM5.00 and a good re-entry price would be below RM4.50.

Note:

I hereby confirm that I do not have any direct interest in the security or securities mentioned in this post. However, I could have an indirect interest in the security or securities mentioned as some of my clients may have an interest in the acquisition or disposal of the aforementioned security or securities. As investor, you should fully research any security before making an investment decision.

Sunday, May 26, 2019

Kossan: Earnings Improved y-o-y

Result Update

For QE31/3/2019, Kossan's net profit declined 1% q-o-q but rose 30% to RM59 million while revenue dropped 5% q-o-q but rose 16% y-o-y to RM561 million.

Group’s revenue dropped 5% q-o-q to RM561 million while profit before tax (PBT) rose 5% q-o-q to RM75.08 million. The higher PBT was attributable to the improved earnings of the Gloves division. The Gloves division recorded a 4.3%-decline in revenue q-o-q to RM497 million but its PBT rose 8.7% to RM68 million due to continued strong demand for the Group’s glove products, with higher volume sold (+4.68%) as compared with 4Q18.

The TRPs division recorded a 7%-decline in revenue to RM47 million, while PBT decreased 19%  to RM7 million mainly due to lower deliveries and increase in raw material prices (SMR10 +8.16%). The Cleanroom division recorded lower revenue and lower PBT of RM17 million and RM0.6 million respectively in 1Q19, as compared with RM19 million and RM1.1 million in 4Q18.


Table: Kossan's last 8 quarterly results


Graph: Kossan's last 51 quarterly results

Financial Position

Kossan's financial position as at 31/3/2019 is deemed healthy with current ratio at 1.7 times while gearing ratio was at 0.6 time.

Valuation

Kossan (closed at RM3.82 last Friday) is now trading at a PE of 22.6 times (based on last 4 quarters' EPS of 16.9 sen). At this PER, Kossan is deemed fairly valued.

Technical Outlook

Kossan is in a long-term uptrend line, SS with support at RM3.65. In addition, it is trading very close to its 40-month SMA line (about equivalent to the 200-day SMA line). Its immediate resistance is the psychological RM4.00 mark.


Chart: Kossan's monthly chart as at May 24, 2019 (Source: Malaysiastock.biz)

Conclusion

Based on good financial performance and financial position, fair valuation & positive technical outlook, Kossan is a good stock for long-term investment.

Note: 

I hereby confirm that I do not have any direct interest in the security or securities mentioned in this post. However, I could have an indirect interest in the security or securities mentioned as some of my clients may have an interest in the acquisition or disposal of the aforementioned security or securities. As investor, you should fully research any security before making an investment decision.

Sunday, May 19, 2019

Kotra: Earnings Improved on Better Cost Control

Result Update

In QE31/3/2019, Kotra's net profit rose 7% q-o-q or 41% y-o-y to RM5.2 million while its revenue dropped 10% q-o-q or 9% y-o-y to RM41 million. The Group's revenue dropped q-o-q mainly due to lower sales of health supplement products to both the local and export markets and decrease in tender supply to local markets in current quarter. The Group's profit before tax rose q-o-q mainly due to rationalization of selling and administration expenses and lower advertisement & promotional expenses incurred in current quarter.


Table: Kotra's last 8 quarters' P&L


Graph: Kotra's last 49 quarters' P&L

Latest Financial Position

As at 31/3/2019, N2N's financial position is satisfactory, with current ratio of 2.4x and gearing ratio of 0.48x.

Background

Kotra is involved in manufacturing & trading of pharmaceutical and healthcare products. 


Kotra's MD, Jimmy Piong Teck Onn & the group's range of products

You can read about this group 's plan in 2018 (here). I post about Kotra once in October 2006 (here).

Valuation

Kotra (closed at RM1.71 last Friday) is now trading at a PER of 11x (based on last 4 quarterly EPS of 15.62 sen). At this PER, Kotra is deemed fairly attractive.

Technical Outlook

Kotra has been range-bound between RM1.60 & RM1.80 for the past 2 years. An upside breakout of the range at RM1.80 could set the stage for an upswing in the share price. Alas, there is no sign yet that this is about to happen.


Chart: Kotra's monthly chart as at May 17, 2019 (Source: Malaysiastock.biz)

Conclusion

Based on satisfactory financial performance, satisfactory financial position and fairly attractive valuation, Kotra could be a good stock for long-term investment.

Note:
I hereby confirm that I do not have any direct interest in the security or securities mentioned in this post. However, I could have an indirect interest in the security or securities mentioned as some of my clients may have an interest in the acquisition or disposal of the aforementioned security or securities. As investor, you should fully research any security before making an investment decision.

Wednesday, May 08, 2019

Harta: Earnings Dipped

Result Update

For QE31/3/2019, Harta's net profit dropped 24% q-o-q or 22% y-o-y to RM91 million while revenue was mix- down 5% q-o-q but up 11% y-o-y to RM684 million. Revenue dropped q-o-q mainly due to lower average selling price for the quarter. Profit before tax for the quarter eased by RM36.3 million or 24% mainly due to sharp strengthening of the ringgit in a short time frame as the Group was unable to pass on the corresponding cost increase to customers in a timely manner. Other factors such as lower average selling price, higher upkeep of office equipment, plant & machinery cost and labor also contributed to lower profits for the quarter.


 Table: Harta's last 8 quarterly results


Graph: Harta's last 53 quarterly results

Financial Position

As at 31/3/2019, Harta's financial position is deemed healthy with current ratio at 1.85x and gearing ratio at 0.32x.

Valuation

Harta (closed at RM5.05 yesterday) is trading at a trailing PER of 37 times (based on last 4 quarters' EPS of 13.74 sen). At this PER, Harta is deemed fully valued.

Technical Outlook

Harta has been declining in a downtrend line (RR) with resistance at RM.10. Until Harta had surpassed this downtrend line, its share price will remain weak. However, the rising low may provide support (SS) at RM4.70.


Chart: Harta's daily chart as at May 7, 2019 (Source: Malaysiastock.biz)

Conclusion

Despite weaker result & demanding valuation, Harta is considered a good stock for long-term investment based on capable management team and strong leadership in the glove sector.

Note:
I hereby confirm that I do not have any direct interest in the security or securities mentioned in this post. However, I could have an indirect interest in the security or securities mentioned as some of my clients may have an interest in the acquisition or disposal of the aforementioned security or securities. As investor, you should fully research any security before making an investment decision.

Wednesday, March 27, 2019

Topglov: Attractive Enough?

Results Update

Topglov released its result for QE28/2/2019 on March 22. Its net profit dropped 4% q-o-q or 3.0% y-o-y to RM106 million while revenue was mix - down 8% q-o-q but up 21% y-o-y to RM1,16 billion. Revenue dropped q-o-q largely owing to lower average selling price arising from downtrend in raw material costs and some pricing pressure. Revenue dropped despite sale volume increased by 1% compared with 1QFY19.

Meanwhile, Profit Before Tax dropped 11.6% q-o-q mainly due to more competitive environment and weakening of USD. Raw material prices were lower compared with 1QFY19, with average natural rubber latex and nitrile latex prices easing by 4.2% to RM3.62/kg, and 14.3% to USD1.08/kg respectively.

 
Table 1: Topglov's last 8 quarterly results


Graph: Topglov's last 50 quarterly results

Financial Position

Topglov's financial position is deemed satisfactory with adequate current ratio at 1.04 times while gearing ratio is elevated at 1.12 times.

Rapid Expansion Ahead

Like other glove manufacturers, Topglov will increase its production capacity aggressively over the few years. It has outlined its planned expansion in the notes to the financial statement. I have appended the table below, which shows clearly Topglov will increase capacity by 33.7% to 80.9 billion gloves by end 2020. Can the market absorb the increased output? We will have to wait and see.

Table 2: Topglov's Planned Expansion for 2019 & 2020

Valuation

Topglov (closed at RM4.50 yesterday) is now trading at a trailing PE of 26 times (based on last 4 quarters' EPS of 17.11 sen). At this PER, Topglov is deemed fairly valued.

Technical Outlook

Topglov has declined from its recent high of RM6.31 recorded on November 29 last year to a low of RM4.30 recorded on March 13. The share price seems to have found support at the "horizontal line" AB at RM4.30. The developing recovering may set up an uptrend line for the stock going forward.


Chart: Topglov's daily chart as at Mar 26, 2019_10.00am (Source: Malaysiastock.biz)

Conclusion

Based on good financial performance and financial position and mildly positive technical outlook, Topglov is a good stock for long-term investment. The drop of RM2.00 from the recent high could well have fully-factored in the market's concern about over-capacity in this sector.

Note:

I hereby confirm that I do not have any direct interest in the security or securities mentioned in this post. However, I could have an indirect interest in the security or securities mentioned as some of my clients may have an interest in the acquisition or disposal of the aforementioned security or securities. As investor, you should fully research any security before making an investment decision.