Tuesday, July 31, 2012

Latexx broke through two resistance levels!


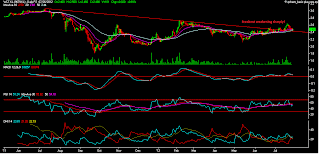
This morning, Latexx broke above its strong horizontal resistance at RM1.60 (see Chart 1). At the close of the morning, it was at RM1.68. If you look at the weekly chart (Chart 2), you will see that its next resistance should be the long-term downtrend line at RM1.75. At 4.30pm, Latexx broke through this downtrend line as well. At the time of writing, it is at RM1.78- a gain of 19 sen!

It is not advisable to jump into this stock after this sharp rally today. A safer approach would be to wait for a pullback to either the downtrend line at RM1.75 or even the gap of RM1.65 (recorded in February 2012). A sudden & sharp rally as witnessed here could be due to a price-sensitive development that is about to be announced. The insiders would have bought into the stock & could be poised to take profit as the crowd surges in.


Chart 1: Latexx's daily chart as at July 30, 2012 (Source: Tradesignum)


Chart 2: Latexx's weekly chart as at July 30, 2012 (Source: Tradesignum)

 Financial Update


The latest available financial results is for QE31/3/2012. You can see from below that Latexx's top-line & bottom-line rebounded from its sharp fall. Its financial position as at 31/3/2012 is deemed satisfactory with current ratio & gearing at 1.69 times and 0.34 time respectively.
 
Table" Latexx's last 8 quarterly results

 
 Chart 3: Latexx's last 15 quarterly results

AEONCr- time to take some profit

AEONCr is one of the best calls that I have ever made. I first posted on it in April 2011 (here) when the stock was trading at about RM4.10. The rise in the share price was well-supported by the rise in its company's earning. From April 2011 to April 2012, its trailing 4-quarters' EPS jumped from 53 sen to 80 sen while the share price rose 2.8 times to about RM11.00.

From the chart below, we can see that the stock has begun to exhibit some signs of weakness.All three indicators are pointing downward. A break below the 10-week EMA line at RM10.80 could bring forth a more meaningful consolidation.

Based on the sharp rally over the past one year and signs of technical weakness, I believe it is good time to take some profit on AEONCr.


Chart: AEONcr's weekly chart as at July 31, 2012 (Source: Quickcharts)

Friday, July 27, 2012

A Reply to a Comment from 3Pm


just a day ago you mentioned our market had enter into exciting period due to the breakout of ci, now u are saying it may be over and turn into bear??
pls enlightened me, also, when does Fitter stock been classified into 1st liner?

My reply:

I will address your 2 questions as follows:


Q1.    "just a day ago you mentioned our market had enter into exciting period due to the breakout of ci, now u are saying it may be over and turn into bear??"

Answer: What I wrote on July 26 was: "Our market has entered an exciting stage after the FBMKLCI made new all-time high. Technically speaking, this technical milestone is a bullish signal. And yet, we do not feel that way because the market breadth is rather poor. The market sentiment is weak in our local bourse as well as in other global equity markets. The global economy is uncertain, with slowdown in US and China as well as an unresolved crisis in Eurozone. Because of that, we have to be cautious."

That statement can be easily understood by any layman as conveying a need for caution in the face of an apparently bullish market. In fact, I have written about the possibility that the current rally could simply be a pre-election rally which could result in a potentially sharp reversal (here). I have also commented on July 24 that the index was in a 2-month uptrend with support at 1628-1630 (here). Unfortunately, it broke that uptrend line on July 26 (here). The breaking of the uptrend line could be the beginning of a reversal of an uptrend. That would warrant us to be very careful, if not slightly bearish. 

Are these posts inconsistent? To me, they are not inconsistent. The market is a living & breathing organism that makes up of million of investors & traders. Things changed and we have to adjust.

Q2.    pls enlightened me, also, when does Fitter stock been classified into 1st liner?

Answer: I am not sure where you are going with this. You may want an idea of how I categorize stocks into 1st liner (or blue chips), and then 2nd & 3rd liners. I must admit that I do not have a clear guideline on categorizing stocks. The top 30 stocks that are components of FBMKLCI should be blue chips. The next 70 stocks that are components of FBM Mid70 should be near blue chips. That does not mean that any stock that falls out of the top 100 are necessarily 2nd & 3rd liners. Finally, not all 2nd & 3rd liners are risky stocks that we should avoid. I believe you are referring to my statement: “The stocks that I picked are those that I've regarded as reasonably good bet. While I could have been wrong, I prefer them to some riskier 2nd & 3rd liners that are the flavor of the week”. If you want to have my definition of what are riskier 2nd & 3rd liners, I also do not have any to offer. However, I would like to quote the words of Justice Potter Stewart when he expounded his threshold test for obscenity in Jacobellis v. Ohio (1964).

I shall not today attempt further to define the kinds of material I understand to be embraced within that shorthand description ["hard-core pornography"]; and perhaps I could never succeed in intelligibly doing so. But I know it when I see it, and the motion picture involved in this case is not that. [Emphasis added.]
—Justice Potter Stewart

As I 'd said before, we are in a difficult market. This market has broken to new high and it had promised to go higher. It is hard to stay out of such an enchanting market and yet we know in our bones & in our heart that this market is fraught with danger. We have all seen how our market made new high in January 2008 in similar circumstances- election around the corner, the global economy exhibiting weakness & a major part of the developed world in trouble- only to see it tumbled down. Having said that, we have seen some stocks performed very well in the past few weeks. It is my hope that I can help to identify more of these stocks for the benefit of my readers. I must remind myself to check my ego & to remember that I am only a market watcher, not a marquee fund manager or investment strategist.

Finally, I like to say that I have no quarrel with you, 3pm. If we have a differing opinion on things, just post your comment. Constructive criticisms are welcome. Even less-than-polite comments have been posted. I would however prefer people to be decent and do not post comments like: "your blog as lots of words, not much usefull content....lots of filler rubbish...." or "for godssake do not be a coward and start demonozing commenters". I have no answer to the first comment but to the second comment that I was demonizing you, I can only say that I have not intended it that way but if I have hurt your feeling, then you have my sincere apology.


Thursday, July 26, 2012

Market Outlook as at July 26, 2012

FBMKLCI broke its 2-month old uptrend line yesterday. It failed to recovered above that uptrend line today. In the afternoon session, it continued to slide.


Chart 1: FBMKLCI's 120-min chart as at July 26, 2012_4.40pm (Source: Quickcharts)

This could signal the start of a correction similar to May 2012 or November 2011. It will soon test the 50-day EMA line at 1604. A breakdown of this support as well as the psychological 1600 mark could lead to a selldown where the index could hit lows between 1572 & 1556 (arrived at by way of a 2-3% horizontal downshift of the 50-day EMA line).


Chart 2: FBMKLCI's daily chart as at July 26, 2012_4.40pm (Source: Quickcharts)

As such, our market has turned ominously negative after today's sharp fall. Is this the end of the pre-election rally? We will wait & see.

UOADev- next upleg about to begin

UOADev has just broken above the RM1.60 resistance. This could signal the start of its next upleg. Next resistance at RM1.95. Based on this, UOADev could be a trading BUY.


Chart: UOA's daily chart as at July 26, 2012_2.40pm (Source: Quickcharts)

Angry Comments Sanitized

Today I received 3 angry comments from 3pmsupertrading (let call him 3pm in short). Two of them I have reproduced below while the last one was simply expletive that serves no value. In the two comments below, certain offensive words have been deleted. I have also deleted a naughty remark about another blogger which I regard as an unfair comment. The two comments are:

hi alex can u pls check how many times u bring ppls to Holland recently? with all your bullish calls ended up helping the stock manipulator unload to us. WCT, YTLland, Fitters, Dialog, Perisai, just to name a few for the very recent. all your (word deleted) start with xxx may have a bullish breakout!! then your cock and bull story. many die in your hand (pen) pls do some good and stop shouting bullish this bullish that.


stop pretending you are a stock Guru!! (word deleted) off!!! you are the best gift god send to the PLC boss, becos u help them to dump the (word deleted) to us. stop posting (word deleted), stop writing nonsense, (unnecessary comment about another blogger). (words deleted) MAY HAVE A BULLISH BREAKOUT!!!


Let look at these comments objectively, even though the commenter did not. I would readily admit that 3pm has a point that some of my calls are "helping the stock manipulator unload to us". He might also be right that I'm "the best gift god send to the PLC boss, becos u help them to dump the (word deleted) to us." You can see from the charts below that the stocks mentioned by 3pm have all faltered & those who bought at the breakout point are trapped. That's the sad part of trading which we have to live with. Not everything goes as planned!

Chart 1: Dialog's daily chart as at July 25, 2012 (Source: Quickcharts)

Chart 2: Fitters's daily chart as at July 25, 2012 (Source: Quickcharts)

Chart 3: Perisai's daily chart as at July 25, 2012 (Source: Quickcharts) 

 Chart 4: WCT's daily chart as at July 25, 2012 (Source: Quickcharts)

Chart 5: YTLLand's weekly chart as at July 25, 2012 (Source: Quickcharts) 

However, all stocks that enter into an uptrend, have to start somewhere. They have to start with a bullish breakout- just like 3pm started life as a baby, like the rest of us. How can you tell whether a breakout is a genuine breakout while others are simply the result of gaming by stock manipulators or PLC bosses. To be frank, I wish I can do that, just as much as we wish we can tell whether a person will turn into a cold-blooded killer- like the guy who massacred 12 innocent persons in a Batman premiere in Colorado recently. If we can do that, should we play God by locking him up. So, in the stock market, we can never be too sure. We may have to try out some bullish breakout cautiously- buying at breakout or on subsequent pullback or adding to our position as the share price inched higher- and at all time, exercise careful money management. 

There are many stocks that I wish I had called a buy earlier. Johotin when it broke above the horizontal line at RM0.95 & the psychological RM1.00 level. Deleum when it broke above the ascending triangle at RM1.15 (or RM1.70 before the recent capital exercise). I saw the breakouts but I did not make the call because I thought they might not sustain. There are some which I did and they had done reasonably well. You can find them if you look through this blog slowly. I will not trumpet them nor would I hide the calls that did not work out.

Chart 6: Johotin's weekly chart as at July 25, 2012 (Source: Quickcharts)  


Chart 7: Deleum's weekly chart as at July 25, 2012 (Source: Quickcharts) 

Our market has entered an exciting stage after the FBMKLCI made new all-time high. Technically speaking, this technical milestone is a bullish signal. And yet, we do not feel that way because the market breadth is rather poor. The market sentiment is weak in our local bourse as well as in other global equity markets. The global economy is uncertain, with slowdown in US and China as well as an unresolved crisis in Eurozone. Because of that, we have to be cautious. The stocks that I picked are those that I've regarded as reasonably good bet. While I could have been wrong, I prefer them to some riskier 2nd & 3rd liners that are the flavor of the week. Some players are like sheep being led to their slaughter. They would buy risky stocks based on nothing but tips. All they need to justify the soundness of the tip is volume and that the "manipulators or PLC bosses" are more than willing to provide. Their urge to gamble cannot be denied, putting paid to the old saying that "A Fool and his money will soon part".

Finally, I like to advise all the readers (including  3pm) that the reward in the market commensurate with the risk that you take. Those who buy for quick gain must necessarily take high risk. Those who took high risk when they bought in the market during the US financial crisis in 2008, reaped handsome reward. In the stock market, we must not only concentrate on the upside. We must always weigh the reward you hoped for against the risk that is embedded in every investment or trade. 3pm's comments provided me with the excuse to make this point. I like to thank him but I have a small advice for him. Next time, just post the comment without the expletives & naughty remark. For that, your comments will not be published. I do not like to treat my readers' comments as spams.


Wednesday, July 25, 2012

PWRoot- Time to Power Up!

Results Update

PWRoot has just announced its results for QE31/5/2012. Its net profit increased by 77% q-o-q or 35% y-o-y to RM7.8 million while revenue rose 21% q-o-q or 40% y-o-y to RM71 million. The company attributes its better performance to increased sales to oversea markets.


Table: PWRoot's last 8 quarterly results

The chart below shows a company whose revenue is soaring while maintaining its profit margin. That's a commendable performance.


Chart 1: PWRoot's last 16 quarterly results

Valuation

PWRoot (at RM0.72) is now trading at a PE of 11 times (based on last 4 quarters' EPS of 6.5 sen). At this PE multiple, the company is still deemed attractive due to its steady growth.

Technical Outlook

PWRoot has just broken above its horizontal resistance at RM0.70. With this breakout, the stock may continue its steady rise.


Chart 2: PWRoot's weekly chart as at July 24, 2012 (Source: Quickcharts)

Conclusion

Based on good financial performance, reasonable valuation & positive technical outlook, PWRoot could be a good stock for medium-term investment.

Tuesday, July 24, 2012

CMSB- poised for a quick rally?

CMSB broke above its 'horizontal' line at RM2.50 on July 19. It immediately went into a harp rally which put to stock at RM2.80 now. See Chart 1.


Chart 1: CMSB's daily chart as at July 24, 2012_12.00pm (Source: Quickcharts)

The weekly chart (Chart 2) shows that CMSB is finally pulling away from its 2-year old downtrend line, R2-R2. The last time, CMSB broke above a similar intermediate downtrend line, R1-R1a was in April 2009. That earlier downtrend  breakout was followed by a consolidation that lasted for 9 months before it broke out & rallied to a high of RM2.77 in April 2010. The current downtrend breakout was also followed by a consolidation which lasted about 4 months. CMSB seems to be repeating itself with the current strong rally which broke above the 'horizontal' line, R1-R1 at RM2.72.


Chart 2: CMSB's weekly chart as at July 24, 2012_12.00pm (Source: Quickcharts)

For a slightly different perspective, I have appended below the monthly chart which shows the next resistance will be the horizontal line at RM3.00 & then at RM3.20.


Chart 3: CMSB's monthly chart as at July 23, 2012_log scale (Source: Tradesignum)

Based on the above technical breakout, CMSB could be a good trading BUY. However, the potential gain is fairly limited (maybe as little as RM0.20) as its strong resistance at RM3.00. Finally, you have to be careful to avoid a sharp pullback after a sharp rise of the past few days. In fact, the start of the upleg in early 2010 was preceded by a sharp pullback after the breakout of the 9-month consolidation. If the same thing were to repeat, then the current breakout could suffer a correction back to RM2.60 before the rally can finally take off. That would then be a good entry to the stock.

Market Outlook as at July 24, 2012

FBMKLCI is now testing its medium-term uptrend line at 1628-1630. I expect a rebound from this level. Failure to do so could send the index to the horizontal line at 1608 & the psychological 1600 mark.


Chart: FBMKLCI's daily cahrt as at July 24, 2012_10.20am (Source: Quickcharts)

Never Lost?!


Jeffrey Saut is the Chief Investment Strategist and Managing Director of Equity Research at Raymond James & Associates. He began his career on a trading desk in New York City. In 1973, he joined E.F . Hutton, where he began following equities and writing research. For more about Jeffrey Saut, go here.

Like Pimco's Bill Gross, Jeffrey can write very insightful articles that are enjoyable to read (here). The secret for writing on a dry subject is the ability to engage the readers from the beginning to the end and, in between, you put in your points in small nuggets. The latest article from Jeffrey meets this objective perfectly.


Never Lost?!
July 23, 2012


Wall Street folklore suggests that in 10 years any fool can make every mistake there is in the stock market and that a really smart person can do the same in half the time. I don’t know how long it took me, but I have tried to learn from those mistakes and avoid repeating them! Indeed, everybody who finally learns how to make money in the stock market learns his own way. I like this tale.

Right after I was discharged from the Army at the close of World War II and went into the drilling-rig building business, I began buying and selling stocks on the side, at first as a hobby. At the end of each year I always had a net loss. I tried every approach I would read or hear about: technical, fundamental, and combinations of all these, but somehow I always ended up with a loss. It may sound impossible that even a blind man would have lost money on the rally of 1958 – but I did. In my in-and-out trading and smart switches I lost a lot of money.

But one day in 1961 when, discouraged and frustrated, I was in the Merrill Lynch office in Houston, a senior account executive sitting at a front desk whom I knew observed the frown on my face that he had been seeing for so many years and motioned me over to his desk. ‘Would you like to see a man,’ he asked wearily, ‘who has never lost money on the stock market?’ ‘Never had a loss?’ I stammered. ‘Never had a loss on balance,’ the broker drawled, ‘and I have handled his account for nearly 40 years.’ ‘If you want to meet him, you’d better hurry,’ the broker advised. ‘He only comes in here once every few years except when he’s buying.’

I introduced myself. The stranger, to my surprise, was happy to talk about stocks. He pulled a sheet of paper from his pocket with his list of stocks scrawled in pencil on it that he had just finished selling and let me look at it. I couldn’t believe my eyes! The man had made over 50% long-term-capital-gain profits on the whole group. One stock in the group of 30 stocks had been shot off the board, but others had gone up 100%, 200%, and even 500%. He explained his technique, which was the ultimate in simplicity. When during a bear market he would read in the papers that the market was down to new lows and the experts were predicting that is was sure to drop hundreds of points more on the Dow, the farmer would look through a Standard & Poor’s Stock Guide and select around 30 stocks that had fallen in price below $10 – solid, profit-making, unheard of little companies (pecan growers, home furnishings, etc.) – and paid dividends. He would come to Houston and buy a $50,000 ‘package’ of them. And then, one, two, three, or four years later, when the stock market was bubbling, and the papers were talking about the Dow soaring to new highs, he would come to town and sell his whole package. It was as simple as that.

... The Craft of Investing by John Train

For more, go here (look for the article dated July 23, 2012) or here.

If you are wondering who is John Train, the person who has to learn the art of investing from a simple farmer, well he is none other than the famous investment guru who had written about 25 books, translated into many languages, including The Craft of Investing & Money Masters of Our Time. Train has also written several hundred columns in the Wall Street Journal, Forbes, London's Financial Times, and other publications. This story simply shows that if we are humble enough or open-minded enough, our life journey can be very enriching.

Friday, July 20, 2012

YTLLand may have a bullish breakout

YTLLand broke above its intermediate downtrend line at RM0.95-0.97 in mid-June. Today, it surpassed the recent high of RM1.05 as well as its 200-day SMA line at RM1.06. With this double breakout, YTLLand could be entering into its next upleg. Its next resistance levels are RM1.15, RM1.30 & RM1.60.

Based on the above, YTLLand could be a good trading BUY.


Chart 1: YTLLand's daily chart as at July 19, 2012 (Source: Tradesignum)


Chart 2: YTLLand's weekly chart as at July 20, 2012_3.00pm (Source: Tradesignum)

BAT- bottom-line continued to grow

Results Update

BAT has just announced its results for QE30/6/2012. Its net profit increased by 13.5% q-o-q or 19.8% y-o-y to RM221 million while turnover increased 2.4% q-o-q & y-o-y to RM1.07 billion. The continued improvement in bottom-line was attributable to lower distribution cost after the change in distribution model in 2011 and the absence of merchandising depreciation following to a change in accounting treatment in Q4 2011.


Table: BAT's last 8 quarterly results


Chart 1: BAT's last 22 quarterly results

Valuation

BAT (closed at RM56.72 yesterday) is now trading at a PE of 22 times (based on the last 4 quarters' ESP of RM2.56). Compared to Nestle, which is trading at a PE of 30 times, BAT's current PE multiple could expand to 25 times- giving BAT an upside potential of 15%.

Technical Outlook

BAT broke above its range of RM44 & RM50 in January 2012 and it could continue with its multi-year uptrend. See Chart 2 & 3 below.


Chart 2: BAT's monthly chart from July 2002 to July 18, 2012 (Source: Tradesignum)


Chart 3: BAT's monthly chart from November 1993 to July 18, 2012 (Source: Tradesignum)

Conclusion

Based on continued improvement in financial performance & positive technical outlook, BAT's present uptrend is expected to continue.

Thursday, July 19, 2012

Fitters may have a bullish breakout

Fitters has three main streams: manufacturing, trading, services and theming (MTST);construction, engineering and property (CEP); and renewable energy and palm oil (RE). The excitement for this stock comes from two areas:
1. Renewable Energy sector
Fitters had commercialized its concept of sustainable palm oil mill by providing zero-waste solution via dried long fibre plants and biogas power plants.
2. Property Development
Fitters will be carrying out its maiden property development project in the prime Setapak area (with a gross development value of RM400 million) would be a major boost to FY12 to FY14 earnings.
In an April report, HwangDBS Research stated that Fitters is trading at "five times FY13 (financial year 2013) price earnings is a clear bargain on the back of three-year earnings CAGR (cumulative annual growth rate of 38 per cent while boasting solid 19 per cent FY13 ROAE (return on average equity)". In addition, it gave the stock target price of RM1.25 per share, using a sum-of-parts valuation method. For more, go here.

Chartwise, Fitters has just broken above its downtrend line at RM0.80. This is also the resistance from the horizontal line of RM0.80. Its next resistance will be at RM0.90-0.95. The stock has potential to revisit its recent high of RM1.15. See the two charts below.


Chart 1: Fitters' daily chart as at July 19, 2012_11.45am (Source: Quickcharts)


Chart 2: Fitters' monthly chart as at July 18, 2012 (Source: Tradesignum)

Based on technical consideration, Fitters could be a good stock for a trading BUY.

Dialog & Perisai- poised to break above the downtrend line

Two O&G stocks that are pressing against their downtrend line and poised for a breakout are Perisai & Dialog. Dialog's breakout level will be at RM2.45-2.47 while Perisai's breakout level is at RM0.90-0.92. As at 4.45pm, Perisai will probably close above the breakout level while Dialog will close at the downtrend line. If there is follow through for Perisai, that stock is good for a trading BUY. The same goes for Dialog


Chart 1: Perisai's daily chart as at July 19, 2012_4.45pm (Source: quickcharts)


Chart 2: Dialogi's daily chart as at July 19, 2012_4.45pm (Source: quickcharts)

Huayang- top-line & bottom-line increased


Results Update

Huayang has announced its results for QE30/6/2012. Its net profit increased by 26% q-o-q or 43% y-o-y to RM16.5 million while turnover rose by 16% q-o-q or 59% y-o-y to RM98 million.


Table: Huayang's last 8 quarterly results


Chart 1: Huayang's last 16 quarterly results

Valuation

Huayang (closed at RM1.97 yesterday) is now trading at a PE of 4.9 times (based on last 4 quarters' EPS of 40 sen). At this PE, Huayang is deemed attractive.

Technical Outlook

Huayang is in a steady uptrend since breaking above the 'horizontal' resistance at RM0.95.


Chart 2: Huayang's monthly chart as at July 18, 2012 (Source: Tradesignum)


Conclusion

Based on good financial performance, attractive valuation & positive technical outlook, Huayang is rated a good stock for long-term investment.

Wednesday, July 18, 2012

Market Outlook as at July 18, 2012

Strange & Stranger Market

 Over the past few weeks, our market has been rising steadily & making new high nearly everyday. On everyone's mind is the question: What's happening?! We are making new high as the global economy is weakening, with Chinese economy on the cusp of a hard landing, Eurozone on the edge of sovereign debt crisis and US economy teetering into another recession. Our market indices (FBMKLCI & FBMEMAS) are higher today than three months ago, contrary to the perfomance of indices of the stock markets in US, Singapore & Hong Kong.

Deja Vu, All Over Again

Don't fret! We have seen this situation before. It happened in early 2008 when our market was higher than its recent high in October 2007 as well as threading into the new high territory. At that time, the main indices in US, Singapore & Hong Kong was lower than their respective high in October 2007. See the table below.


Table: Indices in Early 2008 & Today
(Note: Indices for Dow Jones, Strait Times & Hang Seng are rounded up)

Back Then...

The reason for this exceptional performance is probably the final pre-election rally! In 2008, we had a rally into new high, against the run of play in global equity markets because the ruling party planned to call an election a few weeks later. Go the 2012 & 2008 calenders to crosscheck on the dates mentioned. The pertinent dates are:
  • FBMKLCI & FBMEMAS made new highs in first week of January 2008
  • Parliament was dissolved on February 13, 2008
  • Election Commission announced nominations would be held on February 24, 2008
  • General polling set for March 8, 2008
The same thing may happen again over the next few weeks.


Chart 1: FBMEMAS's weekly chart as at July 18, 2012_11.45am (Source: Quickcharts)


Chart 1: FBMKLCI's weekly chart as at July 18, 2012_11.45am (Source: Quickcharts)

Technically Speaking

FBMKLCI & FBMEMAS are both pressing against the line connecting the 'high' over the past 18 months. From the FBMKLCI weekly chart, we can see the uncanny similarity in the price chart & the indicators between the current period & that's experienced in early 2008.

What to do?

If this is the final pre-election rally, then we must be careful not to hold too much shares when the local funds pull the plugs or take their profit. If the previous election can be a guide, the profit-taking will come before the announcement of the dissolution of Parliament. With Hari Raya Aidilfitri likely to be celebrated on August 19-20, National Day will fall on August 31 & Malaysia Day will fall on September 16, I think the dissolution of Parliament will only happen in late September. If that is the case, then the current rally could last for a few more weeks. On the other hand, if the Government planned to dissolve Parliament right after Hari Raya Aidilfitri, then the rally could end much earlier.

Based on the above analysis, you should reduce your exposure to the market or take profit steadily during the interim period of 1-3 weeks. Good luck!

SKPetro- poised to rally?

SKPetro broke above its horizontal resistance at RM2.30 yesterday. It closed at RM2.30. If SKPetro can stay at or above the RM2.30 mark, it can launch into an upleg. We should track this stock closely for this potential rally.


Chart 1: SKPetro's daily chart as at July 17, 2012 (Source: Quickcharts)


Chart 2: SKPetro's 120-min intraday chart as at July 17, 2012 (Source: Quickcharts)

Tuesday, July 17, 2012

WCT may have a bullish breakout

WCT has been trying to pull away from its intermediate downtrend line, RR at RM2.50 for the past few weeks. After many failed attempts (which took the shape of an ascending triangle), WCT had finally broken above the triangle at the RM2.55 level. With this breakout, WCT could test its horizontal resistance at RM2.80 & then the psychological RM3.00 mark soon.


Chart 1: WCT's daily chart as at July 16, 2012 (Source: Tradesignum)

We can see from the monthly chart below that the RM2.80 level is a strong resistance as it is the long-term downtrend resistance. If WCT can break above this level, its next upleg could unfold. WCT could potentially test its all-time high of RM5.00.


Chart 2: WCT's monthly chart as at July 16, 2012 (Source: Tradesignum)

Based on technical consideration, WCT could be a good stock for a trading BUY. It could even be a long-term stock if it can break above the RM2.80 mark.

Orient- a visit to the all-time high soon?

Orient has broken above its ascending triangle, ABC at RM6.80 last Friday. Yesterday, it tested the psychological RM7.00 mark & pulled back. This morning, it broke above the RM7.00 level convincingly on big volume. With this breakout, Orient is continuing on its prior uptrend. All indicators - MACD, RSI & ADX- are positive.


Chart 1: Orient's daily chart as at July 17, 2012_9.15am (Source: Quickcharts)

With the breakout above the RM7.00 mark, Orient's uptrend is likely to accelerate. The stock is in a parabolic rise and it may soon test its all-time high of RM7.70. If it can break above that level, it could hit a target of RM8.50 (as per my projection below)


Chart 2: Orient's monthly chart as at July 16, 2012 (Source: tradesignum)

Based on technical consideration, Orient could be a good trading BUY.

Monday, July 16, 2012

IJMLand may have a bullish breakout

IJMLand & its warrant had broken above their respective downtrend line. Like the previous 2 breakouts, this breakout is confirmed by MACD going into positive territory (or, about to do so in the case of the warrant), RSI crossing above its 30-week MA line; and the +DMI crossed above the -DMI, with ADX trending higher. All indications are that the stock & the warrant are likely to rise higher.

Based on these, IJMLand & warrant could be good trading BUY.  


Chart 1: IJMLand's weekly chart as at July 16, 2012_3.00pm (Source: quickcharts)


Chart 2: IJMLand-WA's weekly chart as at July 16, 2012_3.00pm (Source: quickcharts)