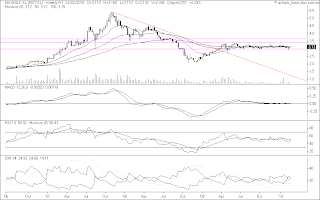
In the past 12 months, we had seen a sharp rise in the price of TChong (from a low of RM1.00 to a recent high of RM3.50). At the same time, its sister company, APM has also enjoyed a strong rally (from a low of RM1.30 to a recent high of RM3.30). Today, APM rose to a high of RM3.83 (from yesterday's close of RM3.30), surpassing its all-time high of RM3.78 recorded in 2002. TChong has also rallied today to hit a high of RM3.22 from overnight close of RM3.10. Why the sharp rally in APM?
APM & TChong are both controlled by Dato' Tan Heng Chew, mainly through Tan Chong Consolidated Sdn Bhd ('TCC'). As at 31/3/2009, Dato' Tan & TCC together owned 52.8% & 50.85% of APM & TChong, respectively. TCC is a private company owned by the two brothers who founded the Tan Chong empire years ago. The two families were at logger heads up until recently when a solution was reached on how to divide up their interests in TCC.
A corporate exercise involving APM & TChong either in the form of the takeover of APM by TChong or the merger of the two companies or the sale of the business of both companies to a Newco could be in the final leg. Looking at the fact sheet below, I think it may involve a share exchange between APM & TChong at a ratio of 5 APM shares for either 6 or 7 TChong shares, if the exercise is a takeover of APM by TChong or a merger between APM & TChong. If it's a sale of the their business to a Newco, the valuation of the business/shares of APM & TChong may reflect the same ratio of either 5:6 or 5:7 in favor of APM.
Table: APM & TChong's Fact Sheet
Chart 1: TChong's weekly chart as at Feb 24, 2010 (Source: Tradesignum)
Chart 2: APM's weekly chart as at Feb 24, 2010 (Source: Tradesignum)
This is a personal weblog, reflecting my personal views and not the views of anyone or any organization, which I may be affiliated to. All information provided here, including recommendations (if any), should be treated for informational purposes only. The author should not be held liable for any informational errors, incompleteness, or delays, or for any actions taken in reliance on information contained herein.
Thursday, February 25, 2010
Litrak & PLUS- time to take profit
The last few days, I was tracking the share price of Litrak very closely, with a view for calling a trading BUY on the stock. On closer study & much reflection, I became somewhat concerned. I began to compare the long-term chart of Litrak with PLUS (see Chart 2 & 3 below) as well as comparing these two stocks with the movement of our interest rate (see Chart 1 below). From these studies, we can make the following observations:
1) From April 2007 to August 2008, the rate of 10-year Government Bond increased from 3% to 5% (see the gray line on the top chart of Chart 1). At the same time, the price of Litrak & PLUS peaked & dropped (see the middle & bottom charts on Chart 1).
2) From September 2008 to December 2008, the rate of 10-year Government Bond dropped from 5% to 3%. This coincided with a strong recovery in the price of Litrak & PLUS which persisted until today.
Since the indications are interest rate is expected to normalize (read: move higher) in 2010, there is a good chance that Litrak & PLUS may decline in the months ahead (see BNM Governor, Zeti's comment here). With this insight and guided by the charts, I think this is a good time to take profit on Litrak & PLUS.
Chart 1: Malaysian interest rates & monthly charts of PLUS & Litrak from 2007 to Feb 2010 (Source: The Edge)
Chart 2: PLUS's monthly chart as at Feb 24, 2010 (Source: Tradesignum)
Chart 3: Litrak's monthly chart as at Feb 24, 2010 (Source: Tradesignum)
1) From April 2007 to August 2008, the rate of 10-year Government Bond increased from 3% to 5% (see the gray line on the top chart of Chart 1). At the same time, the price of Litrak & PLUS peaked & dropped (see the middle & bottom charts on Chart 1).
2) From September 2008 to December 2008, the rate of 10-year Government Bond dropped from 5% to 3%. This coincided with a strong recovery in the price of Litrak & PLUS which persisted until today.
Since the indications are interest rate is expected to normalize (read: move higher) in 2010, there is a good chance that Litrak & PLUS may decline in the months ahead (see BNM Governor, Zeti's comment here). With this insight and guided by the charts, I think this is a good time to take profit on Litrak & PLUS.
Chart 1: Malaysian interest rates & monthly charts of PLUS & Litrak from 2007 to Feb 2010 (Source: The Edge)
Chart 2: PLUS's monthly chart as at Feb 24, 2010 (Source: Tradesignum)
Chart 3: Litrak's monthly chart as at Feb 24, 2010 (Source: Tradesignum)
Latitude's bottom-line inched higher
Results Update
Latitude has just announced its results for 1H2010 ended 31/12/2009. Its net profit increased by 2.5% q-o-q or 2-fold y-o-y to RM11.4 million while turnover increased by 6.6% q-o-q or 21.3% y-o-y to RM135 million. The improved perfromance "was mainly attributable to the increase in sales as a result of the improvement in global economy and in particular the US consumption which has continued to improve".
Table 1: Latitude's 8 quarterly results
Chart 1: Latitude's 18 quarterly results
Concern for 2010
I am a bit doubtful that Latitude can maintain its sales volume given the precarious financial position of US consumers, which accounts for a significant portion of its customers. Just this morning, we have learned that "(s)ales of new homes (in US) plunged to a record low in January, underscoring the formidable challenges facing the housing industry as it tries to recover from the worst slump in decades" (for more, go here). The sales of furniture is closely correlated to the sales of new homes. Does this mean that Latitude's sales volume going forward may suffer a similar decline?
Valuation
Latitude (closed at RM2.23 at the end of the morning session) is now trading at a PER of 4.6 times (based on last 4 quarters' EPS of 49 sen). At this multiple, Latitude is deemed attractive. However we cannot assign too high a multiple for Latitude due to the concern on the sustainability of its sales. Based on a PER of 6 times, Latitude's fair value is about RM2.94.
Technical Outlook
Latitude broke above its long-term downtrend line resistance at RM1.50 in November last year. Early this month, it surpassed its horizontal resistance at RM2.00, to hit a high of RM2.63. Its next strong resistance is at RM3.35-40 while there is also some resistance at RM2.85-90.
Chart 2: Latitude's weekly chart as at Feb 24, 2010 (Source: Tradesignum)
Conclusion
Based on good financial performance & attractive valuation, Latitude may still have further upside. However, we need to be a bit cautious about Latitude's prospect for 2010 as its main customers in US are showing some signs of weakness.
Latitude has just announced its results for 1H2010 ended 31/12/2009. Its net profit increased by 2.5% q-o-q or 2-fold y-o-y to RM11.4 million while turnover increased by 6.6% q-o-q or 21.3% y-o-y to RM135 million. The improved perfromance "was mainly attributable to the increase in sales as a result of the improvement in global economy and in particular the US consumption which has continued to improve".
Table 1: Latitude's 8 quarterly results
Chart 1: Latitude's 18 quarterly results
Concern for 2010
I am a bit doubtful that Latitude can maintain its sales volume given the precarious financial position of US consumers, which accounts for a significant portion of its customers. Just this morning, we have learned that "(s)ales of new homes (in US) plunged to a record low in January, underscoring the formidable challenges facing the housing industry as it tries to recover from the worst slump in decades" (for more, go here). The sales of furniture is closely correlated to the sales of new homes. Does this mean that Latitude's sales volume going forward may suffer a similar decline?
Valuation
Latitude (closed at RM2.23 at the end of the morning session) is now trading at a PER of 4.6 times (based on last 4 quarters' EPS of 49 sen). At this multiple, Latitude is deemed attractive. However we cannot assign too high a multiple for Latitude due to the concern on the sustainability of its sales. Based on a PER of 6 times, Latitude's fair value is about RM2.94.
Technical Outlook
Latitude broke above its long-term downtrend line resistance at RM1.50 in November last year. Early this month, it surpassed its horizontal resistance at RM2.00, to hit a high of RM2.63. Its next strong resistance is at RM3.35-40 while there is also some resistance at RM2.85-90.
Chart 2: Latitude's weekly chart as at Feb 24, 2010 (Source: Tradesignum)
Conclusion
Based on good financial performance & attractive valuation, Latitude may still have further upside. However, we need to be a bit cautious about Latitude's prospect for 2010 as its main customers in US are showing some signs of weakness.
Axiata surpassed its recent high of RM3.50
Results Update
Axiata has just announced its results for FYE31/12/2009. For QE31/12/2009, its net profit increased by 10.8% q-o-q to RM558 million on the back of a 9.2%-increase in turnover to RM3.69 billion. The improved performance was attributable to increased turnover from all its operating units coupled with lower finance cost & positive contribution from AxB, which offset against lower forex gains & higher depreciation charges incurred by Celcom. Axiata has turnaround from a net loss of RM515 million recorded in QE31/12/2008.
Table 1: Axiata's 8 quarterly results
Chart 1: Axiata's 12 quarterly results
Valuation
As at 10.00am, Axiata was trading at RM3.61. From its last 3 quarters' EPS which averages about 6.5 sen each, Axiata's full-year EPS is estimated to be about 26 sen. As such, Axiata is now trading at a PER of 14 times.
With top-line growth of 15% last year, Axiata's Price/Earnings To Growth ('PEG') ratio is about 0.93 time. A PEG ratio of less than 1 means that the stock is attractive.
PEG ratio = PE / (Growth Estimate + Dividend Yield)
= 14 / (15 + 0)
= 0.93 times
Note: I have substituted Revenue growth for Earning growth due to volatility in Axiata's earning.
Technical Outlook
Axiata broke above its recent high of RM3.50 this morning. Its next resistance is at RM3.70 & thereafter at RM4.00.
Chart 2: Axiata's daily chart as at Feb 24, 2010 (Source: Tradesignum)
Conclusion
Based on improved financial performance, fairly attractive valuation & positive technical outlook, Axiata could be a good stock for either a trading BUY or for long-term investment.
Axiata has just announced its results for FYE31/12/2009. For QE31/12/2009, its net profit increased by 10.8% q-o-q to RM558 million on the back of a 9.2%-increase in turnover to RM3.69 billion. The improved performance was attributable to increased turnover from all its operating units coupled with lower finance cost & positive contribution from AxB, which offset against lower forex gains & higher depreciation charges incurred by Celcom. Axiata has turnaround from a net loss of RM515 million recorded in QE31/12/2008.
Table 1: Axiata's 8 quarterly results
Chart 1: Axiata's 12 quarterly results
Valuation
As at 10.00am, Axiata was trading at RM3.61. From its last 3 quarters' EPS which averages about 6.5 sen each, Axiata's full-year EPS is estimated to be about 26 sen. As such, Axiata is now trading at a PER of 14 times.
With top-line growth of 15% last year, Axiata's Price/Earnings To Growth ('PEG') ratio is about 0.93 time. A PEG ratio of less than 1 means that the stock is attractive.
PEG ratio = PE / (Growth Estimate + Dividend Yield)
= 14 / (15 + 0)
= 0.93 times
Note: I have substituted Revenue growth for Earning growth due to volatility in Axiata's earning.
Technical Outlook
Axiata broke above its recent high of RM3.50 this morning. Its next resistance is at RM3.70 & thereafter at RM4.00.
Chart 2: Axiata's daily chart as at Feb 24, 2010 (Source: Tradesignum)
Conclusion
Based on improved financial performance, fairly attractive valuation & positive technical outlook, Axiata could be a good stock for either a trading BUY or for long-term investment.
Wednesday, February 24, 2010
US Equity market overvalued?
The Big Picture picked up on an article on Paul Krugman, entitled "The Deflationist", which appeared on The New Yorker yesterday. One line in the piece caught Barry Ritholtz's attention:
Barry (of The Big Picture) thinks that the reason for Paul's confidence in overvalued market "has to do with who was running the Fed for most of your adult life: Some guy named Alan Greenspan" (here). To wit:
Chart 1: S&P & the Market P/E (Source: S&P, Factset)
Barry further added:
Chart 2: Consumer Speeding in excess of Cash Income (Source: The Big Picture)
Regardless of your sentiment towards Greenspan or Bernanke, there is no doubt that the Fed's action which resulted in a steady drop in bond yield since 1985 has been one of the driving force that propelled the value of equity as well as other classes of assets (such as realty) higher.
Easy monetary policy in the past few years (prior to & after the Global Financial Crisis) has resulted in funds being deployed in commodity speculation, resulting in a sharp rise in prices of commodities, including food stuff. This put pressure on the inflation front, regardless on the slack in the production capacity. Once inflation picked up, it has a life of its own. The bond market is slowly pushing bond yield higher. From Chart 3 below, we can see that the breakout level of the present long-term downtrend line for 10-year bond is at 4.5%. If & when the bond yield surpassed its downtrend line, we would see a change in the behavior of equity & other asset classes. I have commented on this before (here).
Chart 3: TNX's weekly chart from 1962 to Feb 2010 (Source: Yahoo Finance)
Chart 4: DJIA's weekly chart from 1962 to Feb 2010 (Source: Yahoo Finance)
“Let’s put it this way. I can have fairly high confidence—it’s a personality thing—that a market is overvalued. Somehow I never have the same confidence in saying that it’s undervalued.”
Barry (of The Big Picture) thinks that the reason for Paul's confidence in overvalued market "has to do with who was running the Fed for most of your adult life: Some guy named Alan Greenspan" (here). To wit:
Consider the following two charts: The first chart shows the 1977-2007 period P/E ratio for the S&P500, highlighting the band of where stock prices would have been if the P/E ratio had stayed within one standard deviation of their long term average.
As you can see, for most of Greenspan’s tenure, as well as Bernanke’s (excepting the March ‘09 lows), stocks have been mostly-to-extremely overvalued:
Chart 1: S&P & the Market P/E (Source: S&P, Factset)
Barry further added:
The second chart is a chart of how much the consumer leveraged themselves up during Greenspan’s tenure: What they purchased in excess of their cash income:
Chart 2: Consumer Speeding in excess of Cash Income (Source: The Big Picture)
Regardless of your sentiment towards Greenspan or Bernanke, there is no doubt that the Fed's action which resulted in a steady drop in bond yield since 1985 has been one of the driving force that propelled the value of equity as well as other classes of assets (such as realty) higher.
Easy monetary policy in the past few years (prior to & after the Global Financial Crisis) has resulted in funds being deployed in commodity speculation, resulting in a sharp rise in prices of commodities, including food stuff. This put pressure on the inflation front, regardless on the slack in the production capacity. Once inflation picked up, it has a life of its own. The bond market is slowly pushing bond yield higher. From Chart 3 below, we can see that the breakout level of the present long-term downtrend line for 10-year bond is at 4.5%. If & when the bond yield surpassed its downtrend line, we would see a change in the behavior of equity & other asset classes. I have commented on this before (here).
Chart 3: TNX's weekly chart from 1962 to Feb 2010 (Source: Yahoo Finance)
Chart 4: DJIA's weekly chart from 1962 to Feb 2010 (Source: Yahoo Finance)
Plenitude- a value stock
Background
Plenitude Bhd (“Plenitude”) is involved in property development & investment. Its major projects include Taman Desa Tebrau in Johor Bahru, Taman Putra Prima in Puchong, Bandar Perdana in Sg. Petani and Changkat Kiara in Sri Hartamas. Its property development is likely to last for the next 10-15 years as it has a large landbank of about 2000 acres, located in Johor Bahru & the Klang Valley.
Plenitude proposed a niche development of condominium and semi-detached houses in Penang known as Bayu Ferringhi luxury residences, which comprises 112 units of luxurious condominiums and 44 units of exclusive semi-detached villas. This development, which sits on a piece of freehold land measuring 10.76 acres, is expected to be completed in June 2011 for the three-storey semi-detached homes and in March 2012 for the condominiums respectively.
Results Update
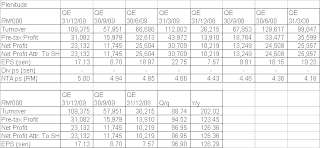
Plenitude's net profit increased by 97% q-o-q or 126% y-o-y to RM23 million while the turnover increased by 89% q-o-q or 202% y-o-y to RM109 million.
Table 1: Plenitude's 8 quarterly results
Chart 1: Plenitude's 14 quarterly results
Valuation
Plenitude (at RM2.80 as at 11.00am) is trading at a PER of 4.1 times (based the last 4 quarters' EPS of 68 sen). At this multiple, Plenitude is deemed very attractive.
Technical Outlook
Plenitude has what I considered a friendly chart, which is to say its chart is relatively easy to analyze. Since its listing in end-2003, it has trended very well. From early 2004 to end 2006, it was in a downtrend. From early 2007 to the middle of 2008, it was in an uptrend. From the middle of 2008 to early 2009, it was in a downtrend. Since then, it was in an uptrend. Right now, the stock is at a crossroad. If its 10 & 20-week SMA line were to cut below the 40-week SMA line, Plenitude could be embarking on its next downtrend. So, Plenitude's technical outlook is a shade negative unless we can see a steady rally from hereon.
Chart 2: Plenitude's weekly chart as at Feb 23, 2010 (Source: Tradesignum)
Conclusion
Based on good financial performance & attractive valuation, Plenitude is a good stock for long-term investment. The slightly negative technical outlook is a damper for this stock, which should temper our enthusiasm somewhat.
Plenitude Bhd (“Plenitude”) is involved in property development & investment. Its major projects include Taman Desa Tebrau in Johor Bahru, Taman Putra Prima in Puchong, Bandar Perdana in Sg. Petani and Changkat Kiara in Sri Hartamas. Its property development is likely to last for the next 10-15 years as it has a large landbank of about 2000 acres, located in Johor Bahru & the Klang Valley.
Plenitude proposed a niche development of condominium and semi-detached houses in Penang known as Bayu Ferringhi luxury residences, which comprises 112 units of luxurious condominiums and 44 units of exclusive semi-detached villas. This development, which sits on a piece of freehold land measuring 10.76 acres, is expected to be completed in June 2011 for the three-storey semi-detached homes and in March 2012 for the condominiums respectively.
Results Update
Plenitude's net profit increased by 97% q-o-q or 126% y-o-y to RM23 million while the turnover increased by 89% q-o-q or 202% y-o-y to RM109 million.
Table 1: Plenitude's 8 quarterly results
Chart 1: Plenitude's 14 quarterly results
Valuation
Plenitude (at RM2.80 as at 11.00am) is trading at a PER of 4.1 times (based the last 4 quarters' EPS of 68 sen). At this multiple, Plenitude is deemed very attractive.
Technical Outlook
Plenitude has what I considered a friendly chart, which is to say its chart is relatively easy to analyze. Since its listing in end-2003, it has trended very well. From early 2004 to end 2006, it was in a downtrend. From early 2007 to the middle of 2008, it was in an uptrend. From the middle of 2008 to early 2009, it was in a downtrend. Since then, it was in an uptrend. Right now, the stock is at a crossroad. If its 10 & 20-week SMA line were to cut below the 40-week SMA line, Plenitude could be embarking on its next downtrend. So, Plenitude's technical outlook is a shade negative unless we can see a steady rally from hereon.
Chart 2: Plenitude's weekly chart as at Feb 23, 2010 (Source: Tradesignum)
Conclusion
Based on good financial performance & attractive valuation, Plenitude is a good stock for long-term investment. The slightly negative technical outlook is a damper for this stock, which should temper our enthusiasm somewhat.
KKB's top-line & bottom-line soared
Results Update
KKB has just announced its results for FYE31/12/2009. For 4Q2009, its net profit increased by 14.4% q-o-q or 3-fold to RM12.0 million while turnover increased by 27.0% q-o-q or double y-o-y to RM62.1 million. The improved performance is attributed to increased revenue from the Engineering & Civil Construction divisions. KKB is involved in steel fabrication and the manufacturing of liquefied petroleum gas cylinders, steel pipes and hot dip galvanising and civil construction.
Table 1: KKB's 8 quarterly results
Chart 1: KKB's 10 quarterly results
Valuation
KKB (at RM4.00 as at 10.00am) is trading at a PER of 8.9 times (based on the last 4 quarters' EPS of 45 sen). Based on a PER multiple of 10 times for a medium-size company, I think KKB's fair value of RM4.50.
Technical Outlook
KKB's immediate horizontal resistance is at RM4.50 while its horizontal support is at RM3.25.
Chart 2: KKB's monthly chart as at Feb 23, 2010 (Source: Tradesignum)
Conclusion
Based on satisfactory financial performance, reasonably attractive valuation & positive technical outlook, KKB remained a good stock for long-term investment.
KKB has just announced its results for FYE31/12/2009. For 4Q2009, its net profit increased by 14.4% q-o-q or 3-fold to RM12.0 million while turnover increased by 27.0% q-o-q or double y-o-y to RM62.1 million. The improved performance is attributed to increased revenue from the Engineering & Civil Construction divisions. KKB is involved in steel fabrication and the manufacturing of liquefied petroleum gas cylinders, steel pipes and hot dip galvanising and civil construction.
Table 1: KKB's 8 quarterly results
Chart 1: KKB's 10 quarterly results
Valuation
KKB (at RM4.00 as at 10.00am) is trading at a PER of 8.9 times (based on the last 4 quarters' EPS of 45 sen). Based on a PER multiple of 10 times for a medium-size company, I think KKB's fair value of RM4.50.
Technical Outlook
KKB's immediate horizontal resistance is at RM4.50 while its horizontal support is at RM3.25.
Chart 2: KKB's monthly chart as at Feb 23, 2010 (Source: Tradesignum)
Conclusion
Based on satisfactory financial performance, reasonably attractive valuation & positive technical outlook, KKB remained a good stock for long-term investment.
Tuesday, February 23, 2010
Maxis & MPHB- stocks to watch
Maxis has a strong rally today. It closed at RM5.49 after making a high of RM5.50. Volume traded was above average at 9.6 million units. The RM5.50 level is the high for this stock since its listing on November 19. An upside breakout above RM5.00 could signal the beginning of the uptrend for Maxis.
Chart 1: Maxis's daily chart as at Feb 23, 2010 (Source: Quickcharts)
MPHB has been in a medium-term downtrend line since October last year. An upside breakout above the downtrend line resistance at RM1.93 could also signal the continuation of the prior uptrend for this stock. MPHB closed at RM1.93 on volume of 3.0 million shares- the highest volume traded in the past 3 months.
Chart 2: MPHB's daily chart as at Feb 22, 2010 (Source: Tradesignum)
Based on the above, Maxis & MPHB could become good trading BUY candidates tomorrow.
Note: Maxis's recent high & breakout level were wrongly stated as RM5.00 earlier. It has been re-stated as RM5.50. (Hat Tip to John for pointing out the error.)
Chart 1: Maxis's daily chart as at Feb 23, 2010 (Source: Quickcharts)
MPHB has been in a medium-term downtrend line since October last year. An upside breakout above the downtrend line resistance at RM1.93 could also signal the continuation of the prior uptrend for this stock. MPHB closed at RM1.93 on volume of 3.0 million shares- the highest volume traded in the past 3 months.
Chart 2: MPHB's daily chart as at Feb 22, 2010 (Source: Tradesignum)
Based on the above, Maxis & MPHB could become good trading BUY candidates tomorrow.
Note: Maxis's recent high & breakout level were wrongly stated as RM5.00 earlier. It has been re-stated as RM5.50. (Hat Tip to John for pointing out the error.)
Maybulk's bottom-line boosted by POSH
Results Update
Maybulk has just announced its results for FYE31/12/2009. For QE31/12/2009, Maybulk'a net profit increased by 27% q-o-q or 26-fold to RM88.4 million while turnover dropped by 15.7% q-o-q or 40.2% y-o-y to RM82.6 million.
This is a fairly good set of results, which reflects the strong contribution from its associates (of RM97 million for FYE31/12/2009 as compared to RM21 million previously), such as PACC Offshore Services Holdings Group ('POSH') as well as Eminence Bulk Carriers Pte Ltd & Novel Bright Assets Ltd, owners of bulk carriers Alam Penting (GT 46982) & Alam Murni (GT 29979). Its investment in POSH allows Maybulk to have a small foothold in a burgeoning Oil & Gas industry sector, which helped to cushion the drop in shipping rates (see Chart 2). As a result of the contribution from the above associates, Maybulk's bottom-line staged a steady recovery in the past 3 quarters (see Chart 1).
Table 1: Maybulk's 8 quarterly results
Chart 1: Maybulk's 27 quarterly results
Chart 2: Baltic Drybulk Rates' daily chart as at Feb 22, 2010 (Source: Investment.tools.com)
Valuation
Maybulk (at RM3.12 as at 4.00pm) has a PER of 13 times (based on its EPS for FYE31/12/2009 of 24 sen). At this multiple, I believe Maybulk's upside is quite limited (say, 10%). However, the Kuok group's DNA may shine through again for this company. With that, I think Maybulk deserves a HOLD rating for now.
Technical Outlook
Maybulk is likely to move sideway within a range of RM3.00 & RM3.40.
Chart 3: Maybulk's weekly chart as at Feb 22, 2010 (Source: Quickcharts)
Conclusion
Based on adequately satisfactory financial results, Maybulk should remain a stock to watch. Upside is however limited as I expect a range bound trading for this stock, between RM3.00 & RM3.40.
MMC- a trading BUY
MMC broke above its medium-term downtrend line resistance at RM2.45 yesterday. MMC's 20 & 50-day SMA line supports are at RM2.40 & RM2.35, respectively. As such, this is a relatively safe trading BUY. 1st target: RM2.60. 2nd target: RM2.80.
Chart: MMC's daily chart as at Feb 22, 2010 (Source: Tradesignum)
Evergreen's top-line & bottom-line continued to climb
Results Update
Evergreen reported its results for QE31/12/2009. Its net profit increased by 34% q-o-q or 8-fold y-o-y to RM41.6 million while turnover increased by 5.8% q-o-q or 30.5% y-o-y to RM224 million. The improved performance was "mainly due to higher sales volume as demands have started to recover following the sharp collapse triggered by the global financial crisis late last year. As a result of such recovery and coupled with the cost cutting measures implemented and improved operational efficiency, the group was able to turnaround quickly to register a significant increase in profitability."
Table 1: Evergreen's 8 quarterly results
We can see Evergreen's top-line continued to grow in the past 2 quarters after surpassing the previous high recorded in QE30/9/2007 but its bottom-line is still short of its previous high achieved in QE30/6/2007 (see Chart 1). What's surprising is that the prices of MDF & Particleboard actually peaked in the 2nd half of 2008 (see Chart 2).
Chart 1: Evergreen's 22 quarterly results
Chart 2: Prices of MDF & Particleboard from Jan 2007 to Jan 2009 (Source: ITTO)
Valuation
Evergreen (at RM1.60 as at 4.00pm) has a PER of 9.4 times (based on last 4 qaurters' EPS of 17 sen). If it can maintain the same level of profitability of the past 2 quarters, then its full year EPS may hit 28 sen. This would translate to a PER of 5.8 times. At this multiple, I believe Evergreen is fairly attractive.
Technical Outlook
From the chart, we can see that Evergreen is rising in an uptrend. It should have good support at between 50 & 100-day SMA lines (say, RM1.30-40) & could potentially hit a reaction high of RM1.80-90.
Chart 3: Evergreen's daily chart as at Feb 23, 2010_11.00am (Source: Quickcharts)
Conclusion
Based on satisfactory financial performance, attractive valuation & bullish technical outlook, Evergreen is a good stock for long-term investment.
Monday, February 22, 2010
Market Outlook as at Feb 22, 2010
Like other equity markets, our market has continued its recovery after the CNY break. FBM-KLCI broke above its short-term downtrend line on Feb 17. Indicators (MACD & RSI) continue to improve. ADX reading is still weak at 24.9 but the +DMI looks set to cross above the -DMI.
Chart 1: FBM-KLCI's daily chart as at Feb 22, 2010 (Source: Quickcharts)
While most stocks have recouped some of its losses, some stocks are racing to new high. In this very small field, we can find names such as Daiboci & Tomypak. Daiboci proves that a stock can do wonderful things when it has the wind of momentum to its back. I remained skeptical of its success story. Go to Chart 2 for the daily chart for Daiboci.
Chart 2: Daiboci's daily chart as at Feb 22, 2010 (Source: Quickcharts)
Other stocks which look very promising, include the rubber glove manufacturers (such as Supermx, Kossan, Adventa & Latexx); Unisem; and, TChong. These stocks have broken above their respective short-term downtrend line. For the daily charts of Supermx, Unisem & TChong, see below.
Chart 3: Supermx's daily chart as at Feb 22, 2010 (Source: Quickcharts)
Chart 4: Unisem's daily chart as at Feb 22, 2010 (Source: Quickcharts)
Chart 5: TChong's daily chart as at Feb 22, 2010 (Source: Quickcharts)
Finally, some stocks are resting on strong support level, with no sign of the next price direction- Up or Down? Among them are Freight.
Chart 6: Freight's daily chart as at Feb 22, 2010 (Source: Quickcharts)
In this environment, what shall we do? If you think that the uptrend of the market will continue, then you should buy into the market as soon as possible. Your risk tolerance would determine whether you should buy stocks which show more bullish outlook (such as those which had already broken above their short-term downtrend line) or stocks which haven't moved up yet but are resting at strong support level. On the other hand, if you think that the market is enjoying a short rebound with uncertainty ahead, then you should remain at the sideline. Times like these are tough on both investors & traders because they have to decide on a course of action where the outcome is anybody's guess.
Toyota could be forming a bottom
Toyota, the largest automotive manufacturer in the world, has been cut down to size over the past few weeks. For a company that seemed to be unable to do anything wrong for the past 30 years to appear suddenly seemingly unable to do anything right, must be a humbling experience. Lee Iacocca and a whole lot of people in Detroit must be grinning with an unbelievable schadenfreude about Toyota's comeuppance. Before writing out this episode, let's examine whether there is an investment opportunity in this event.
Before we look at the chart, we must bear in mind that the Toyota recall story actually started on January 21, a floor mat recall. This was followed by the pedal recall one week later. Toyota problem first appeared in November last year, according to a report in LATimes. To wit:
via, LATimes.
I have appended below Toyota's monthly, weekly & daily charts. The following can be observed:
1) The monthly chart (the top chart) shows that Toyota is in a downtrend since late 2006. The downtrend line resistance is at Y4000.
2) The weekly chart (the middle chart) shows that Toyota rebounded off its low of about Y2600 recorded in December 2008. Since the December 2008 low, Toyota has been rising in a medium-term uptrend line, with support at Y3500. In the past 3 weeks, Toyota broke below this uptrend line support to reach a low of Y3200 in early February. Since April 2009 until today, Toyota appears to be trapped in an expanding triangle, with support at Y3150-3200 & resistance at Y4300.
3) Since making the low of Y3200, Toyota seems to be forming a bottom (see the daily chart at the bottom). The current fresh weakness in the share price is building up to a test of the low, on thin volume. With or without a test of the low, a recovery above Y3500 (the reaction high in mid-February & the medium-term uptrend line support) could signal the end of the selldown in Toyota.
Chart: Toyota's monthly, weekly & daily chart as at 19/2/2010 (Source: Tokyo Stock Exchange)
From the technical angle, Toyota could be a trading BUY (even a long-term BUY) if the share price recovered above Y3500. It is currently trading at Y3340 (go here for its latest price).
Before we look at the chart, we must bear in mind that the Toyota recall story actually started on January 21, a floor mat recall. This was followed by the pedal recall one week later. Toyota problem first appeared in November last year, according to a report in LATimes. To wit:
Moving to correct what federal regulators have termed a "very dangerous problem," Toyota Motor Corp. said it would modify and replace gas pedals on 4.26 million cars and trucks to reduce the vehicles' risk of accelerating out of control.
Toyota said the measures were designed to prevent floor mats from jamming the accelerator pedal open. As an additional precaution, the Japanese automaker said most of its cars would be modified so that the brake overrides the accelerator if both pedals are pressed at the same time.
The action follows widespread reports of runaway Toyota and Lexus vehicles, including an Aug. 28 crash near San Diego that killed a California Highway Patrol officer and three family members. Sudden acceleration incidents involving Toyota-made cars and trucks have claimed 19 lives since the 2002 model year, The Times has reported, which federal officials say is more than all other manufacturers combined.
via, LATimes.
I have appended below Toyota's monthly, weekly & daily charts. The following can be observed:
1) The monthly chart (the top chart) shows that Toyota is in a downtrend since late 2006. The downtrend line resistance is at Y4000.
2) The weekly chart (the middle chart) shows that Toyota rebounded off its low of about Y2600 recorded in December 2008. Since the December 2008 low, Toyota has been rising in a medium-term uptrend line, with support at Y3500. In the past 3 weeks, Toyota broke below this uptrend line support to reach a low of Y3200 in early February. Since April 2009 until today, Toyota appears to be trapped in an expanding triangle, with support at Y3150-3200 & resistance at Y4300.
3) Since making the low of Y3200, Toyota seems to be forming a bottom (see the daily chart at the bottom). The current fresh weakness in the share price is building up to a test of the low, on thin volume. With or without a test of the low, a recovery above Y3500 (the reaction high in mid-February & the medium-term uptrend line support) could signal the end of the selldown in Toyota.
Chart: Toyota's monthly, weekly & daily chart as at 19/2/2010 (Source: Tokyo Stock Exchange)
From the technical angle, Toyota could be a trading BUY (even a long-term BUY) if the share price recovered above Y3500. It is currently trading at Y3340 (go here for its latest price).
Friday, February 19, 2010
CLSA Feng Shui chart for 2010
One of my ex-colleagues used to ask me for a Feng Shui chart every CNY. I must admit that I had never believed in Feng Shui charts and I hope that I shall remain a non-believer. Have you ever wondered how a Feng Shui chart came about? Surely, it cannot be something that is drawn by a Feng Shui master based on his ability to see the market for the next 12 months. In my opinion, it must be the amalgamation of the views of 'analysts' & 'strategists' collected by the so-called Feng Shui master. Even if this is an 'accurate' view of the market, it remains a static view.
CLSA regularly makes available a Feng Shui chart to its clients every CNY. I think it is done to generate publicity as well as to pamper to the demands of some of its Chinese clients. Regardless of how this chart was compiled, I believe it represents the view of the firm, with minor 'events' added for distraction. If viewed from this angle, I believe that CLSA Feng Shui chart for 2010 is in line with my view of the market for the next few months. As for the later part of the year, we will have to wait for future events to unfold & their impact on the economy to filter through the market.
Chart: CLSA Feng Shui Index 2010 (Source: FTAlphaville)
Thursday, February 18, 2010
Technical Outlook for US & European Markets as at Feb 18, 2010
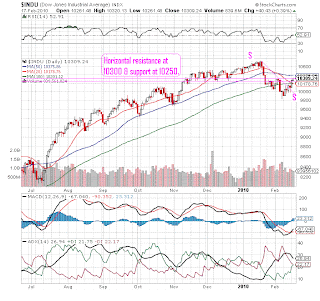
The US & major European markets (London, Frankfurt & Paris) have all rebounded above their respective short-term downtrend lines. However, their 20-day SMA lines have cut below their respective 50-day & 100-day SMA lines. The latter SMA lines have turned flattish, signaling flattish market ahead. With strong horizontal resistance just ahead, I expect the recent market rally to enter a corrective phase soon. Thereafter, these markets are likely to move sideway, with downward bias for the next few months.
Chart 1: DJIA's daily chart as at 17/2/2010 (Source: Stockcharts.com)
Chart 2: FTSE's daily chart as at 17/2/2010 (Source: Stockcharts.com)
Chart 3: DAX's daily chart as at 17/2/2010 (Source: Stockcharts.com)
Chart 4: CAC's daily chart as at 17/2/2010 (Source: Stockcharts.com)
Chart 1: DJIA's daily chart as at 17/2/2010 (Source: Stockcharts.com)
Chart 2: FTSE's daily chart as at 17/2/2010 (Source: Stockcharts.com)
Chart 3: DAX's daily chart as at 17/2/2010 (Source: Stockcharts.com)
Chart 4: CAC's daily chart as at 17/2/2010 (Source: Stockcharts.com)
Technical Outlook for Emerging Markets as at Feb 18, 2010
The question on everyone's mind is whether this is the right time to buy stocks again? I will look at the main barometer for Brazil, Russia & India, which make up 3 of the countries referred to as BRIC. The third country, China is excluded as its main stock market, Shanghai Stock Exchange has been closed since Feb 12.
1. Brazil
The Brazil's Bovespa Index (BVSP) has rebounded above its short-term downtrend line. Its 20-day SMA line has cut below the 50-day SMA line but not the 100-day SMA line, which is still rising. BVSP, which closed at 67695 yesterday, is still below its medium-term uptrend line support at 69000. Go to the earlier post (here).
Based on the mixed technical reading, I expect BVSP to trade sideway.
Chart 1: BVSP's daily chart as at 17/2/2010 (Source: Stockcharts.com)
2. Russia
While Russia's RTSI's 50-day SMA line is already flattening out, the 100-day SMA line is still rising. The 20-day SMA line has yet to cut below the 50-day & 100-day SMA lines. Despite the relatively better technical reading, RTSI has yet to break above its short-term downtrend line, with resistance at 1470. The weak rebound may be due to its close proximity to the region with serious sovereign risks concern, i.e. Europe. In addition, it is noted that RTSI, which closed at 1422 yesterday, is still below its medium-term uptrend line support at 1490.
Based on the mixed technical reading, I expect RTSI to trade sideway.
Chart 2: RTSI's daily chart as at 17/2/2010 (Source: Stockcharts.com)
3. India
The Bombay's BSE has rebounded above its short-term downtrend line. Nevertheless, the 100-day SMA line flattening out and the 20-day SMA line has cut below both the 50-day & 100-day SMA lines. BSE, like Hong Kong's HSI, seems like a rounding top. The best indicator to use to chart this type of market is multiple moving average lines, which has turned bearish.
Based on the mixed technical reading, I expect BSE to trade sideway, with a downward bias.
Chart 3: BSE's daily chart as at 17/2/2010 (Source: Stockcharts.com)
Based on a study of these 3 major emerging markets, I believe the technical outlook for the emerging markets in general remained unchanged, which is slightly bearish for the next 2-3 months.
Friday, February 12, 2010
GONG XI FA CAI
Star- awakening a sleeping dog?
Background
Star Publications (Malaysia) Berhad ('Star') is principally engaged in the publication, printing and distribution of newspapers and magazines. It is the publisher of the Star newspaper, the largest English language newspaper in Malaysia.
Next Growth Engine
In late 2008, Star took over the Singapore-listed, Cityneon Holdings Ltd when it offered S$0.58 (RM1.39) cash per share in Cityneon. The total cost of the acquisition was about S$34mil (go here). After the takeover, Star undertook a private placement of shares in order to comply with the minimum public shareholding spread of 10% of its shares in the hands of the public. After the placement, Star's stake in Cityneon was reduced to 59%
Cityneon’s core activities include exhibition and event management services while its other areas of expertise include interior architecture, galleries and thematics. Cityneon serves its international client portfolio through various subsidiaries in Asia and the Middle East, delivering events and exhibitions across the Americas, Europe, Asia and the Middle East. Cityneon was relisted in September 2009 on SGX. It has more than double its order book to S$110mil from S$52mil in January (go here).
Recent Financial Results
Star has just announced its results for QE31/12/2009, where its net profit increased by 87% q-o-q or 357% y-o-y to RM60.9 million while turnover increased by 29% q-o-q or 49% y-o-y to RM315 million. The increased top-line & Bottom-line came from Cityneon, which contributed RM11.7 million of Star's overall pre-tax of RM97 million and RM222 million of Star's total turnover of RM974 million for FYE31/12/2009.
Table 1: Star's 8 quarterly results
From Chart 1, we can see that Star's top-line & bottom-line had jumped up strongly in the past 3-4 quarters.
Chart 1: Star's 13 quarterly results
Valuation
Star (closed at RM3.20 yesterday) is now trading at a PER of 10 times (based on annualized EPS of 33 sen). Star pays a dividend of 21 sen for the past 3 years, which translates to a dividend yield of 6.6%. For a stable consumer stock, I believe Star should trade at a PER of 13-15 times. Assuming a PER of 13 times, Star's fair value is about RM4.30.
Technical Outlook
Star's chart can be summarized in one word: Semi-comatose! It is range-bound at RM2.80-3.70 (or, RM3.00-3.50). This may be about to change...
Chart 2: Star's monthly chart as at Feb 10, 2010 (Source: Tradesignum)
Conclusion
Based on attractive valuation & improved financial performance, Star should be a good stock for long-term investment.
Star Publications (Malaysia) Berhad ('Star') is principally engaged in the publication, printing and distribution of newspapers and magazines. It is the publisher of the Star newspaper, the largest English language newspaper in Malaysia.
Next Growth Engine
In late 2008, Star took over the Singapore-listed, Cityneon Holdings Ltd when it offered S$0.58 (RM1.39) cash per share in Cityneon. The total cost of the acquisition was about S$34mil (go here). After the takeover, Star undertook a private placement of shares in order to comply with the minimum public shareholding spread of 10% of its shares in the hands of the public. After the placement, Star's stake in Cityneon was reduced to 59%
Cityneon’s core activities include exhibition and event management services while its other areas of expertise include interior architecture, galleries and thematics. Cityneon serves its international client portfolio through various subsidiaries in Asia and the Middle East, delivering events and exhibitions across the Americas, Europe, Asia and the Middle East. Cityneon was relisted in September 2009 on SGX. It has more than double its order book to S$110mil from S$52mil in January (go here).
Recent Financial Results
Star has just announced its results for QE31/12/2009, where its net profit increased by 87% q-o-q or 357% y-o-y to RM60.9 million while turnover increased by 29% q-o-q or 49% y-o-y to RM315 million. The increased top-line & Bottom-line came from Cityneon, which contributed RM11.7 million of Star's overall pre-tax of RM97 million and RM222 million of Star's total turnover of RM974 million for FYE31/12/2009.
Table 1: Star's 8 quarterly results
From Chart 1, we can see that Star's top-line & bottom-line had jumped up strongly in the past 3-4 quarters.
Chart 1: Star's 13 quarterly results
Valuation
Star (closed at RM3.20 yesterday) is now trading at a PER of 10 times (based on annualized EPS of 33 sen). Star pays a dividend of 21 sen for the past 3 years, which translates to a dividend yield of 6.6%. For a stable consumer stock, I believe Star should trade at a PER of 13-15 times. Assuming a PER of 13 times, Star's fair value is about RM4.30.
Technical Outlook
Star's chart can be summarized in one word: Semi-comatose! It is range-bound at RM2.80-3.70 (or, RM3.00-3.50). This may be about to change...
Chart 2: Star's monthly chart as at Feb 10, 2010 (Source: Tradesignum)
Conclusion
Based on attractive valuation & improved financial performance, Star should be a good stock for long-term investment.
Subscribe to:
Posts (Atom)