Friday, September 30, 2016

Prlexus: Earnings Recovered


Results Update

For QE31/7/2016, Prlexus's net profit rose 189% q-o-q or 39% y-o-y to RM10 million while revenue rose 72% q-o-q or 4% y-o-y to RM125 million. Revenue increased q-o-q mainly  due to higher revenue from the apparel division. This led to increase in profits.

  
Table 1: Prlexus's last 8 quarterly results


Chart 1: Prlexus's last 32 quarterly results

Valuation

Prlexus (at RM1.54 at 10.00am) gives a PE of 9 times (based on last 4 quarters' EPS of 17.28 sen). At this PER, Prlexus is deemed fairly attractive.

Technical Outlook

Prlexus has broken above its intermediate downtrend line, RR at RM1.45. Its next resistance is at RM1.60 & then RM1.70.


Chart 2: Prlexus's weekly chart as at Sep 30, 2016_10.00am (Source: ShareInvestor)

If share price tracks earning, we have reason to believe that Prlexus's share price should go higher rather than lower.


Chart 3: Prlexus's monthly chart as at Sep 30, 2016_10.00am compared to profit track record (Source: ShareInvestor)

Conclusion

Based on imporved financial performance, fairly attractive valuation & mildly positive technical outlook, I revise my rating for Prlexus from TAKE PROFIT to ACCUMULATE.

 Note:

I hereby confirm that I do not have any direct interest in the security or securities mentioned in this post. However, I could have an indirect interest in the security or securities mentioned as some of my clients may have an interest in the acquisition or disposal of the aforementioned security or securities. As investor, you should fully research any security before making an investment decision.


Tekseng: There's Something Going On!

Yesterday evening, Tekseng made this announcement on Bursa website:

We refer to the above article that appeared in New Straits Times on 27 September 2016, with particular reference to the statement in the 1st paragraph reproduced as follows:


“Another wave of retrenchments has apparently hit Penang’s manufacturing sector, with a sudden announcement to over 200 employees that they are out of jobs.”

We wish to clarify that the above measures undertaken by TS Solartech Sdn Bhd, a 50.69% owned subsidiary of Tek Seng Holdings Berhad (“Tek Seng” or “the Company”) is to optimize manpower to enhance productivity efficiency and to reduce its operating cost over the longer term.

The cost saving measures will not have any operational impact on TS Solartech Sdn Bhd or the Group. TS Solartech Sdn Bhd still has sufficient manpower of around 500 employees to fulfill the operation lines and is operating as usual in Penang Science Park. The Management of TS Solartech Sdn Bhd had resolved the issue by compensating monetarily. Despite that, the financial impact of manpower retrenchment is minimal.

The last line- the financial impact of manpower retrenchment is minimal - raised the question: How minimal is that? Does the management expect the company to still have a satisfactory performance this year?

From the chart below, we can see that the solar segment - Tekseng's most profitable - had suffered a drop in PBT from RM20 million in QE31//3/2016 to RM13 million in QE30/6/2016. Its contribution to overall revenue had also declined from 68% to 63%. The drop in revenue & profit could be a developing negative trend which prompted the drastic action to retrench 200 workers.


Chart 1: Tekseng's segmental results for QE30/6/2016, QE31/3/2016 & QE30/6/2015

Chartwise, Tekseng is now enjoying a tepid rebound from the announcement. I don't think the rebound will go far. At best, it may touch RM1.10. In any event, I seriously doubt it can surpass the horizontal line at RM1.15.


Chart 2: Tekseng's 120-min intra-day chart as at Sep 30, 2016_11.20am (Source: Shareinvestor.com)

Based on the uncertain prospects of the Solar segment, I recommend to avoid Tekseng.

Note:

I hereby confirm that I do not have any direct interest in the security or securities mentioned in this post. However, I could have an indirect interest in the security or securities mentioned as some of my clients may have an interest in the acquisition or disposal of the aforementioned security or securities. As investor, you should fully research any security before making an investment decision.

Thursday, September 29, 2016

Banking Stocks: Some Thoughts


Since the beginning of the year, CIMB and RHBBANK have been slowly rising off their low. If you look at the charts below, you can see that they tested their long-term uptrend line and then rebounded. Will CIMB and RHBBANK enter into their next upleg? That's the big question.  


Chart 1: RHBBANK's monthly chart as at Sep 28, 2016 (Source: ShareInvestor.com)


Chart 2: CIMB's monthly chart as at Sep 28, 2016 (Source: ShareInvestor.com)

In a banking sector report dated September 8, 2016, Kenanga rated the sector as neutral. In addition, it rated all the banking stocks as Market Perform, except AFFIN. The latter was rated Under Perform, which means it may perform below the market (or effectively a SELL).


From Kenanga Research

In addition to CIMB and RHBBANK which tested their respective long-term uptrend lines, we may be seeing two other banking stocks that are now testing their respective long-term uptrend lines. These stocks are AMBANK & (yes!) AFFIN. The monthly MACDs of these stocks have just crossed above the MACD signal line (or about to do so). If this happens, they may experience a similar rebound like CIMB and RHBBANK in the start of the year.


Chart 3: AMBANK's monthly chart as at Sep 28, 2016 (Source: ShareInvestor.com)


Chart 4: AFFIN's monthly chart as at Sep 28, 2016 (Source: ShareInvestor.com)

To complete my round up of the banking sector, I have to say that there is one stock that looks decidedly negative. That's MAYBANK! It may continue to slide and test the tentative long-term uptrend line support at RM6.30-6.50. Why is it so weak? I have no idea.


Chart 5: MAYBANK's monthly chart as at Sep 28, 2016 (Source: ShareInvestor.com)

Conclusion

Based on the above, I would recommend slow accumulation of AMBANK and AFFIN as well as buy on weakness for CIMB and RHBBANK. Avoid MAYBANK.

Note:

I hereby confirm that I do not have any direct interest in the security or securities mentioned in this post. However, I could have an indirect interest in the security or securities mentioned as some of my clients may have an interest in the acquisition or disposal of the aforementioned security or securities. As investor, you should fully research any security before making an investment decision.

VS: Earnings Took A Knock

Result Update

For QE31/7/2016, VS's net profit dropped by 43% q-o-q or 79% y-o-y to RM11 million while revenue rose 9% q-o-q & y-o-y to RM554 million. VS's PBT dropped q-o-q from RM22 million to RM9 million due to impairment losses from Other Investments of RM7.6 million & deposit forfeited of RM21.8 million for proposed acquisition of  a 20%-stake in a solar power project in China. If these losses were not booked into the account, VS's pre-tax profit would improve by 72% q-o-q to RM38 million.


Table: VS's last 8 quarterly results


Chart 1: VS's last 46 quarterly results

Valuation

VS (closed at RM1.34 yesterday) is trading at a trailing PE of 13 times (based on last 4 quarters' EPS of 10.19 sen). At this PER, VS (a cyclical stock) is deemed fairly valued.

Technical Outlook

VS has been trading sideways since it broke below its 20-week SMA line in January. The stock is supported by the horizontal line at RM1.15.


Chart 2: VS's weekly chart as at Sep 28, 2016 (Source: ShareInvestor.com)

On the monthly chart, VS seems to have peak. MACD has crossed below the MACD signal line.


Chart 3: VS's monthly chart as at Sep 28, 2016 (Source: ShareInvestor.com)

Conclusion

Based on weaker financial performance and prior sharp price run-up, I would rate VS as a SELL INTO STRENGTH.

Note:

I hereby confirm that I do not have any direct interest in the security or securities mentioned in this post. However, I could have an indirect interest in the security or securities mentioned as some of my clients may have an interest in the acquisition or disposal of the aforementioned security or securities. As investor, you should fully research any security before making an investment decision.

Wednesday, September 28, 2016

Superln: Earnings Stays Strong

Background


Superlon Holdings Berhad ('Suprtln') is involved in the design, test and manufacture of thermal insulation materials mainly for the heating, ventilation, air-conditioning and refrigeration (“HVAC&R”) industry and trading of HVAC&R parts and equipment.


 Superlon's products & factory in Malaysia

Historical Financial Performance

Superln's financial performance rose exponentially in FY2015 & this year. We can see its annual revenue breaking above the RM70 million mark & its pre-tax profit breaking above the RM10 million in FY2015.
 

Chart 1: Superln's last 10 years' results

The year 2015 happens to be the year when our MYR weakened substantially. This has boosted Superln's sales in the international market as the company exports to about 50 countries. If USD-MYR were to retrace back to 3.50, it is likely that Superln's profit margin may drop from the existing 20% to 10%. Its net profit could then be about RM9-10 million. Until then, Superln could enjoy hefty profit or expand its markets overseas.


Chart 2: Superln's last 10 years' profit margins & USD-MYR exchange rate

Recent Financial Results

In QE31/7/2016 Superln's net profit rose by 63% q-o-q or 57% y-o-y to RM6 million while its revenue rose by 9% q-o-q or 16% y-o-y to RM26 million. Profit after tax rose q-o-q mainly due to higher gross margin & exchange gain.


Table: Superln's last 8 quarters' results


Chart 2: Superln's last 14 quarters' results

Financial Position

Superln's financial position as at 31/7/2016 is deemed healthy with current ratio at 3.7x and gearing ratio at 0.21x. Return on Equity was good at 20%.

Valuation

Superln (closed at RM2.38 yesterday) is now trading at a trailing PER of 10x (based on last 4 quarters' EPS of 23.75 sen). For medium-cap stock, the PER is deemed fairly attractive. Dividend receivable rose from 6 sen in FY2015 to 9 sen in FY2016. 1Q2017 dividend receivable rose from 2 sen last year to 2.5 sen. Assuming dividend receivable is 9 sen, the stock has a DY of 3.8%.

Technical Outlook

Superln broke above the line connecting its recent peaks, AB at RM2.38 last Friday. After the upside breakout, the share price corrected back to the AB support at RM2.38. If this support can sustain, the stock may continue to go higher from hereon.


Chart 3: Superln's weekly chart as at Sep 27, 2016 9Source: Shareinvestor.com)


Chart 4: Superln's monthly chart as at Sep 27, 2016 9Source: Shareinvestor.com)

Conclusion

Based on good financial performance, fairly attractive valuation & mildly bullish technical outlook, Superln could be a good stock for trading BUY.

Note:

I hereby confirm that I do not have any direct interest in the security or securities mentioned in this post. However, I could have an indirect interest in the security or securities mentioned as some of my clients may have an interest in the acquisition or disposal of the aforementioned security or securities. As investor, you should fully research any security before making an investment decision.

Tuesday, September 27, 2016

Tekseng: Solar Division Retrenching 200 Workers


NST just reported this: "TS Solartech Sdn Bhd - a subsidiary of Tek Seng Holdings Bhd - that some of its employees will be out of work as early as tomorrow. TS Solartech is a mainland Penang-based crystalline silicon solar cell maker in which Taiwan-based Solartech Energy holds a 42 per cent stake." For more, go here.

This means that Tekseng, which is fairly dependent on the Solar Division, may not do well going forward. For financial performance, check out my earlier report.


Chart: Tekseng's daily chart as at Sep 27, 2014_4.45 (Source: Shareinvestor.com)

Based on this news, we can expect the share price to be weak. You may want to reduce your position in this stock

Note:

I hereby confirm that I do not have any direct interest in the security or securities mentioned in this post. However, I could have an indirect interest in the security or securities mentioned as some of my clients may have an interest in the acquisition or disposal of the aforementioned security or securities. As investor, you should fully research any security before making an investment decision.

Pohuat: Earnings Recovered

Results Update

For QE31/7/2016, Pohuat's net profit rebounded back & rose 158% q-o-q but dropped 6% y-o-y to RM10 million while revenue rose 18% q-o-q or 12% y-o-y to RM126 million. Revenue rose q-o-q   following  the lower level of production during the Tet/Chinese New Year Holiday which fell in the month of February (in Vietnam where 66% of its operation is based). The improvement in profitability was the result of the higher plant utilization rate.

Pohuat expected a satisfactory performance for FY2017 as per its comment:

All round improvement in economic sentiments and business confidence amongst our customers, coupled with the continued strength of the US Dollars, suggest better purchasing power and sustained demand for the Group’s products. The recent completion and commission of our reconstructed finishing line cum warehouse facilities in Binh Duong, Vietnam has added 20% to the capacity of the Binh Duong plant and more importantly enhanced our manufacturing capabilities and efficiency. Consistent with our efforts to move up the value of its products, the modernised finishing line will enable us to take on higher range products which cwill contribute more meaningfully to the Group’s bottom-line from FY2017 onwards.


Table 1: Pohuat's last 8 quarterly results


Chart 1: Pohuat's last 39 quarterly results

Valuation

Pohuat (closed at RM1.53 yesterday) is now trading at a trailing gross PER of 7.4 times (based on last 4 quarters' EPS of 20.55 sen). At this PER, the stock is fairly attractive. In addition, the stock pays a decent dividend of 8 sen last 4 quarter which translates to a Dividend Yield of 5.2%.

Technical Outlook

Pohuat's uptrend, SS accelerated into S1-S1 in late 2014. That accelerated uptrend line broke in Mar 2016 and is now acting a resistance to any rally. Meanwhile a rising line, AB is acting as a support for the stock. Thus, Pohuat has support from the line, AB at RM1.50 & its rebound is capped by the old uptrend line, S1-S1 at RM1.80.


Chart 2: Pohuat's weekly chart as at Sep 26, 2016 (Source: Chartnexus) 

Conclusion

Based on good financial performance and fairly attractive valuation, Pohuat is a good stock for medium-term investment.

Note:

I hereby confirm that I do not have any direct interest in the security or securities mentioned in this post. However, I could have an indirect interest in the security or securities mentioned as some of my clients may have an interest in the acquisition or disposal of the aforementioned security or securities. As investor, you should fully research any security before making an investment decision.

Monday, September 26, 2016

Steel: Any More Upside?

Last week, our Government announced provisional safeguard measures for imported steel coils and reinforced bars at a duty rate of 13.9% and 13.4% respectively. This move will likely to benefit producers of long steel products, such as Annjoo, SSteel & Masteel as it will boost the ASPs of their steel coils and reinforced bars.

In addition, the threat of lower steel prices coming from China is likely to subside due to (i) China’s depleting steel inventory indicating rising domestic demand there, (ii) closure of loss-making steel mills in China, and (iii) China governments’ strong commitment in reducing steel production capacity through consolidation of steel groups coupled with financial support of RMB100b for worker retrenchment schemes. This is based on the daily report from Kenanga Research.

The timeline of the positive developments for the long steel products sector this year is as follows:
  •  From March to middle April, steel prices recovered in China
  •  Late April to May, steel prices corrected in China
  •  From June onward, steel prices have been rising in China   
  •  Last week, our Government imposed additional duty on steel coils and reinforced bars on top of the existing 5% duty
The slew of good news has propelled the steel stocks to swing up. With strong momentum, these stocks were able to break above their respective long-term downtrend line. This is a significant point and it bears repeating: Steel stocks are now above their LONG-TERM DOWNTREND LINES. However, the sharp price run-up is ahead of earnings and correction may kick in any time. Those who have not gotten in, my recommendation is to sit tight. If the stocks correct and the price pulled back to the long-term downtrend breakout price, that would be a good level to slowly gain your entry.

 
Chart 1: Annjoo's monthly chart as at Sep 26, 2014_12.30 (Source: Shareinvestor.com)


Chart 2: Masteel's monthly chart as at Sep 26, 2014_12.30 (Source: Shareinvestor.com)


Chart 3: SSteel's monthly chart as at Sep 26, 2014_12.30 (Source: Shareinvestor.com)

Meanwhile, the flat steel products players are also doing quite well. They are having a pretty good run after Megasteel closed down. Megasteel used to produced HRC- the raw material for making flat steel products- at higher prices than imported HRC. Thus, the closure of Megasteel will enable flat steel producers, such as Mycron, to source for cheaper HRC and improve their bottom-line.


Chart 4: Mycron's monthly chart as at Sep 26, 2014_12.30 (Source: Shareinvestor.com)


Chart 5: Melewar's monthly chart as at Sep 26, 2014_12.30 (Source: Shareinvestor.com)

Like long products players, flat products players have had a very strong rally. You may want to wait for price pullback before gaining your entry. For bigger bites, you can consider Melewar, the 71.5%-owner of Mycron, and SSteel, the laggard & poorer performer.

Note:

I hereby confirm that I do not have any direct interest in the security or securities mentioned in this post. However, I could have an indirect interest in the security or securities mentioned as some of my clients may have an interest in the acquisition or disposal of the aforementioned security or securities. As investor, you should fully research any security before making an investment decision.

Thursday, September 22, 2016

GENM: A Failed Upside Breakout (AMENDED)


Yesterday, we saw GENM rose 19 sen to close at RM4.70. In the process, GENM broke above the strong resistance from the horizontal line at RM4.60. This resistance has capped its upside for a period of 15 months. This morning, it started off with a mild correction which saw the prices pulling back to RM4.65-4.67. Unfortunately at 11:30am, the share prices dropped sharply to just below the breakout level at RM4.60. The selling intensified in the afternoon. At 2:55pm, it hit the low at RM4.47 before mild recovery set in. At 3:40pm, it was trading at RM4.51-4.52.


Chart 1: GENM's weekly chart as at Sep 22, 2014 (Source: Chartnexus)

Had the upside breakout sustained, GENM could continue to rise within its larger upward channels (see the green lines). This would see GENM slowly rising to the upper channel line at RM5.50-5.80.


Chart 2; GENM's monthly chart as at Sep 22, 2014 (Source: Chartnexus)

These are the potential reasons for the start of the next upleg for GENM:

1) Good financial performance

In last quarter (QE30/6/2016), GENM's net profit rose 195% q-o-q or 106% y-oy- to RM476 million while revenue rose 1% q-o-q or 13% y-o-y to RM2.234 billion. The q-o-q increase in net profit was due to foreign exchange gains of RM46.1 million; higher adjusted EBITDA by RM28.6 million from the leisure and hospitality business in US and Bahamas mainly contributed by lower operating loss from Bimini operations in 2Q 2016 and lower operating cost for RWNYC operations; and, higher adjusted EBITDA by RM20.6 million from leisure and hospitality business in Malaysia mainly contributed by higher revenue.


Table: GENM's last 8 quarterly results


Chart 3: GENM's last 41 quarterly results

2) Opening of a new theme park in Genting Highland

GENM is building a new theme park, the 20th Century Fox World Genting theme park in Genting Highland. The theme park is expected to be opened end of 2016. The theme will feature around 25 thrill rides and attractions based on films and franchises from popular movies and cartoons. 

Conclusion

As it stands, the failure of GENM to stay above the RM4.60 mark negates any call for a trading BUY for the stock following the upside breakout. However, the stock is worth tracking. If the next breakout can sustain, you should consider getting into GENM.

Note:

I hereby confirm that I do not have any direct interest in the security or securities mentioned in this post. However, I could have an indirect interest in the security or securities mentioned as some of my clients may have an interest in the acquisition or disposal of the aforementioned security or securities. As investor, you should fully research any security before making an investment decision.

HAIO: Earnings Weakened

Results Update

For QE31/7/2016, Haio's net profit dropped by 13% q-o-q but rose 47% y-o-y to RM9.7 million while revenue dropped by 11% q-o-q but rose 42% y-o-y to RM79 million. Revenue dropped q-o-q for all three divisions: for the MLM division due to the Ramadan season and promotional sales in the previous quarter; for the wholesale division due to lower sales in Chinese medicated tonic and cooking wine which more than offset the additional contribution from one-off re-export sale of RM 2 million; and for the retail division due to year-end grand members’ sales campaign in the previous quarter. As a result of the lower revenue, MLM & retail divisions suffered a drop in PBT which more than offset the increased PBT in the wholesale division, which was due to lower operating expenses incurred in current  quarter and higher contribution from inter-segment sales.  


Table: Haio's last 8 quarterly results


Chart 1: Haio's last 46 quarterly results

Valuation

Haio (closed at RM3.41 yesterday) is now trading at a trailing PE of 17 times (based on last 4 quarters' EPS of 20.39 sen). At this PER, Haio is deemed fully valued.

Techncial Outlook

Haio is in an upward channel, with support at RM2.30 and the resistance at RM3.50. Last week it touched the resistance after a strong rally following the previous strong quarterly result. This latest quarterly result should be a cold shower to the players. A retracement within the channel is likely.


Chart 2: Haio's monthly chart as at Sep 21, 2014 (Source: Shareinvestor.com)

Conclusion

Based on weaker financial performance & full valuation, I believe some profit-taking activities may set in for Haio. You should consider doing the same and aim to buyback at RM3.00 or lower.

Note:

I hereby confirm that I do not have any direct interest in the security or securities mentioned in this post. However, I could have an indirect interest in the security or securities mentioned as some of my clients may have an interest in the acquisition or disposal of the aforementioned security or securities. As investor, you should fully research any security before making an investment decision.

Wednesday, September 21, 2016

KESM: Earnings Rose Srquentially


Results Update

For QE31/7/2016, KESM's net profit rose by 6% q-o-q but dropped 23% y-o-y to RM8.0 million while revenue rose 5% q-o-q or 8% y-o-y to RM74.5 million. Revenue rose y-o-y due to higher demand for burn-in and test services. Despite the increased revenue, Profit before tax dropped y-o-y due to the drop in Other incomes as a result of the absence of an exchange gain of RM1.1 million and absence of reversal of sundry payables of RM0.7 million; increase in employee benefits expense RM4.2 million as a result of higher wage rates and staff compensation to support increased revenue, which had more than offset the decline in raw  materials and consumables used and changes in work-in-progress of RM2.0 million as a result of lower sales from electronic manufacturing services.


Table 1: KESM's last 8 quarterly results


Chart 1: KESM's last 46 quarterly results 

As mentioned in the previous post, KESM's profit is extremely small compared to its capex. For the past 11 years, it expended RM509 million on capex in order to made net profits totaling RM168 million. Due to high depreciation totaling RM538 million, fixed assets only rose from RM112 million to RM169 million (Note: While I did not attempt to reconcile the numbers, the rough figures seem to tally). The low profits explained why the company's returns on assets & equity are so abysmal, except for periods of peak demand (like 2007/2008 and probably today).


Table 2: KESM's last 11 years' Capex, Depreciation, Net Profit, ROE & ROA


Chart 2: KESM's last 11 years' Capex, Depreciation, Net Profit, ROE & ROA

Industrial Outlook

KESM is dependent on the semiconductor sector, which is expected to be weaker in 2016 due to weak demand for PCs.  However, KESM is now focusing on the chips for the automotive sector. Kenanga had issued a report in early August which highlighted this new area of growth. To wit:

KESM is well positioned to benefit from two salient trends; (1) rising global automotive sales (expected to exceed 100m units in 2017 from 91m in 2015), and (2) increased electronic chips content in cars. The value content of electronics in a car is expected to grow from USD284 to USD330 from 2014 to 2019. The automotive segment represents an area of high growth potential and has enabled the Group to diversify into a segment that offers longer product life cycle and higher margin.
The new demand for automotive chips could be the driving force that propelled the Philadelphia Semiconductor Index (SOX) to break into a new high in late July.


Chart 3: SOX's monthly chart as at Jau 13, 2016 (Source: Yahoo Finance)

Valuation

KESM (closed at RM8.00 yesterday) is now trading at a PE of 11.2 times (based on last 4 quarters' EPS of 71.40 sen). At this PER, we would in the past consider the stock to be fully valued. The big question is whether KESM - like any other stocks in or servicing the semiconductor sector - is now in peak earning. If it is, then there is a good chance that forward earning will drop. However, the automotive sector demand for chip could be something structural, which may extend the earning growth for a while. In the August report, Kenanga valued KESM at RM7.90.

Technical Outlook

KESM is now trading at all-time high. As we have seen in 2000, the steep rise in price is a set-up for a steep correction. Thus we have to be careful trading or investing in KESM.
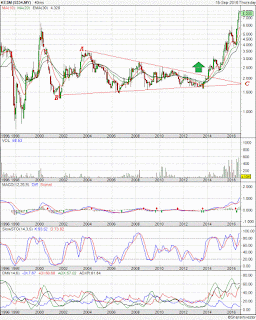

Chart 4: KESM's monthly chart as at Sep 20, 2016 (Source: ShareInvestor.com)

The weekly chart shows immediate support is at the January 2016 high of RM6.00.


Chart 5: KESM's weekly chart as at Sep 20, 2016 (Source: ShareInvestor.com)

Conclusion

Based on good financial performance & exciting prospect, I consider KESM to be a good stock for long-term investment. However, I believe KESM is good for some profit-taking due to its sharp price run-up.

Note:

I hereby confirm that I do not have any direct interest in the security or securities mentioned in this post. However, I could have an indirect interest in the security or securities mentioned as some of my clients may have an interest in the acquisition or disposal of the aforementioned security or securities. As investor, you should fully research any security before making an investment decision.

Monday, September 19, 2016

MAGNI: Earnings Rebounded

Results Update

For QE31/7/2016, Magni's net profit rose 25% q-o-q or 51% y-o-y to RM23.5 million while revenue rose 40% q-o-q or 40% y-o-y to RM271 million. Revenue increased q-o-q due to 48%-increase in sales for garment segment but a slight 2%-drop in sales for packaging segment. PBT increased by 29% q-o-q due to 33%-increase PBT for Garment which was mainly due to higher revenue and higher currency exchange gain, partially weighed down by higher operating expenses while PBT for Packaging dipped by 14.3% which was mainly due to the cumulative effect of lower revenue and higher operating expenses.


Table: Magni's last 8 quarterly results


Chart 1: Magni's last 30 quarterly results

Valuation

Magni (trading at RM4.15 last Thursday) has a trailing PE of 7.5 times (based on last 4 quarters' EPS of 55.35 sen). Its last 2 years' earning CAGR was at 45%; giving the stock a PEG ratio of 0.2x. At this PEG ratio, Magni's valuation is still very attractive. 

Technical Outlook

Magni is in a long-term uptrend. There are negative technical reading; MACD has just crossed below its MACD signal line and ADX has hooked down. Both are signaling a possible correction in the near term.


Chart 2: Magni's monthly chart as at Sep 15 2016 (Source: ShareInvestor.com)

The weekly chart shows that Magni is moving in a gradual downward channel, with support at RM3.80 & resistance at RM4.40. MACD looks poised to cross above the MACD signal line. 


Chart 3: Magni's daily chart as at Sep 15 2016 (Source: ShareInvestor.com)

Conclusion

Based on good financial performance and attractive valuation, Magni remains a good stock for long-term investment.

Note:

I hereby confirm that I do not have any direct interest in the security or securities mentioned in this post. However, I could have an indirect interest in the security or securities mentioned as some of my clients may have an interest in the acquisition or disposal of the aforementioned security or securities. As investor, you should fully research any security before making an investment decision.