Wednesday, October 10, 2012

Amedia- another sharp drop!

In March, Amedia dropped 19% in one day and we haven't learned why that happened (here). After a 4 months sideway movement, the stock broke above the March high of RM0.45 and rallied all the way to RM1.15 on September 27. On October 3, it broke below the RM1.00 mark and the return trip began.

Despite the announcement of a generous Bonus Issue of shares of 1-for-1 plus an equally generous Bonus Issue of warrants of 1-for-1 on October 5, the stock continued to decline. In just 7 days, the stock lost 63% of its value. Bursa has issued a Unusual Market Activity (UMA) query to the company today. I would not expect much from the query.

From the chart, the stock is now testing the horizontal line at RM0.43. If this is violated, it would probably test the next horizontal line at RM0.33. The financial results, if they are accurate, show a company that is doing reasonably well. The only thing one can say about the account is that there have been a number of amendments to both the quarterly results as well as the annual reports (both FY2011 & FY2010). It will be interesting to learn what's caused a drop of such magnitude.

A stock, with a generous capital exercise, a planned transfer from ACE Board to Main Board and seemingly good financial performance (albeit messy accounting record-keeping), that drops with fierce intensity for days on end, is a stock to be avoided. (Note: Amedia closed at RM0.42).


Chart: Amedia's daily chart as at Oct 10, 2012_4.15pm (Source: Quickcharts)

Note:
In addition to the disclaimer in the preamble to my blog, I hereby confirm that I do not have any relevant interest in, or any interest in the acquisition or disposal of, Amedia.

Scomimr- the gem in the Scomi group

Scomi group has been in the headline for the past few days after IJM took a stake in Scomi. As you may know. Scomi is undergoing an internal reorganization which will see Scomi Marine ('Scomimr') emerging as an integrated oil and gas marine and drilling services provider. As part of the exercise, there will be a reverse take-over (RTO) exercise where Scomi's eastern hemisphere oilfield services will be injected into Scomimr; thus enlarging the latter's current business of offshore support services. Scomi's stake in Scomimr will be increased from 43% to 66%. Interestingly, IJM will subscribe for RM110 million of Scomi Redeemable Convertible Secured Bonds, where the security provided is Scomimr shares.

Look like the focus for the Scomi group as well as the reason why IJM bought into Scomi is the Oil & Gas sector. Since this business will be parked in Scomimr, this company is where we should concentrate our attention.

Chartwise, we can see that Scomimr has just broken above the intermediate downtrend line (AB) at RM0.35 yesterday and the strong horizontal resistance at RM0.38 this morning. See Chart 1.


Chart 1: Scomimr's daily chart as at Oct 9, 2012 (Source: Quiccharts)

If you look at the ling-term monthly chart, plotted on semi log scale (Chart 2), you will see that the stock had broken above its long-term downtrend line in 2010. Despite that breakout, the stock did not rally but instead moved sideway for 2 years in the form of an irregular pennant/frag formation (ABCD). The last time this stock was in a similar formation was in 2002-2005 (OPQR). In early 2006, Scomimr broke above that formation at RM0.40 and rallied to a high of RM1.80. Today, the stock appears to be breaking above the current formation. 

Based on the exciting prospects of Scomimr (following its restructuring & new shareholders) and the mildly bullish outlook, Scomimr could be a good stock to consider for long-term investment.


Chart 2: Scomimr's monthly chart as at Oct 8, 2012 (Source: Tradesignum)

Note:
In addition to the disclaimer in the preamble to my blog, I hereby confirm that I do not have any relevant interest in, or any interest in the acquisition or disposal of, Scomi & Scomimr.

Monday, October 08, 2012

Perisai may have a bullish breakout


There is a report by UOB Kay Hian Malaysia Research that Perisai may acquire a stake in Emas Offshore's (EOC) floating, production, storage and offloading (FPSO) vessel. EOC, which is 46.5%-owned by Ezra, was reported to have received a Letter Of Intent (LOI) to supply and operate a FPSO vessel to HESS for the Kamelia gas field.

The deal may have arisen because EOC needs to meet domestic content requirements for offshore projects, and it could complied with this requirement through Perisai's 40%-owned Larizz Petroleum [which is licensed to bid for local contracts].

UOB Kay Hian's estimate shows that by securing a 50% stake in the US$300mil FPSO vessel, Perisai's fair value would rise by RM300mil or 53 sen a share, assuming a project internal rate of return (IRR) of 15%, and enhance its earnings by RM38mil per annum. UOB Kay Hian valued Perisai at RM1.59. For more, go here.

The Edge reported that Perisai was valued at between RM1.20 (by Hwang DBS) to RM2.92 (by Hong Leong IB). For more, go here.

Chartwise, Perisai has broken above its recent high of RM1.04. See Chart 1 below. The stock could rise to a high of RM1.15-1.20 (as per the linear Chart 2) or it may shot up to RM1.50 (as per semi-log Chart 3).

Perisai has a bullish outlook based on technical breakout.


Chart 1: Perisai's daily chart as at Oct 8, 2012_3.00pm (Source: Quickcharts)


Chart 2: Perisai's monthly chart as at Oct 8, 2012_3.00pm_linear (Source: Quickcharts)


Chart 3: Perisai's monthly chart as at Oct 8, 2012_3.00pm_semilog (Source: Quickcharts)

Note:
In addition to the disclaimer in the preamble to my blog, I hereby confirm that I do not have any relevant interest in, or any interest in the acquisition or disposal of, Perisai.

CPO- a technical rebound for now

Recently, the Plantation Industries and Commodities Minister Tan Sri Bernard Dompok proposed a reduction in the export duties on CPO, from 23% to 8-10%. (For more, go here) There are a few reasons why the Minister made this proposal, chief among them are:
1. In response to an Indonesian move to levy export duty of about 13% on CPO. This Indonesian move resulted in a cross subsidy by its upstream producers to its downstream players. As a result, Indonesian refined products are more competitive via-a-vis the refined products from independent Malaysian producers. 
You may ask how did the Malaysian producers fail to compete when they have an indirect subsidy of 23%. The answer is simply because they can't get their hands on Malaysian CPO as most of it is exported under duty-free exemption. Malaysian currently produces 19 million tonnes of CPO, of which 12 million tonnes are consumed by refiners, 2 million tonnes used as cooking oil and the balance of 5 million tonnes are exported. Before the Indonesian move, independent Malaysian refiners can import in CPO from Indonesia and they can compete with the Indonesian refiners. Today, Malaysian refineries are reported to be suffering a negative margin of USD30-40 per tonne. (For more go here).
2. With CPO trading at below RM2500 per tonne, the government will not receive any windfall tax from plantation companies. This tax will only come into effect if CPO is above RM2500. The rate is 15% of any amount above RM2500 per tonne.
So the proposal to collect a lower 8-10% export duty coupled with the termination of duty-free export will lead to an export duty collection of RM1.125 billion (calculated as follows: 5 mil tonnes multiplied  by RM2500 per tonne and multiplied by 9%). Compared to the windfall tax of RM1.425 billion collectible if CPO were trading at RM3000 per tonne (calculated as follows: 19 mil tonnes multiplied  by RM500 per tonne and multiplied by 15%).
The proposed export duties reduction & termination of duty-free export should appease the refiners but it would come at the expense of upstream players. Among these are big plantation companies and small estate owners. With the election around the corner- where every vote counts- I doubt the government would move on the proposal any time soon.

There are two paragraphs in the recent newspaper article that I like to highlight:

1. Dompok also said the ministry would work on an incentive programme to encourage replanting of about 100,000 hectares of oil palm trees that were more than 35 years old. “This incentive will cut off about 300,000 tonnes of CPO in the market when the replanting scheme is put in place” he said.  
2. “We will also take a look back at the country's biofuel programme and will expedite the B5 programme to B10, doubling the biodiesel content utilised by the Government's agencies vehicles,” he added
These two points highlight the problem of oversupply of CPO, which was the essence of my earlier post. As such, the proposed export duties reduction in my opinion would not have any impact on CPO price for the medium-term. The CPO prices will be determined by the market forces and the market is wrestling with lower prices brought on by higher CPO output. 

Gold- a safehaven asset misused!


Over the past few days, we read many articles about the unfolding disaster in the gold investment scheme. The reports by the Star newspaper is unhelpful. The Star, which has no problem taking side in our domestic politics, adopted a 'balanced' approach when it comes to the gold investment scheme. If you read its articles, you may get the impression that the problem would not be a problem if Bank Negara hasn't intervened. The other part of the problem is the failure of Bank Negara to stay focused on the message. Avoid bringing up other issues that may confuse the public, such as tax evasion, money laundering, etc.

Let me tell you my first impression of this scheme, which happened two years ago. One of my customers came to me & sought my opinion on investing in a scheme with the following features:
1. You buy gold at market price and you can sell back at market price.
2. You earn interest at a rate of 2% per month. 
I immediately told her there is something not right about that scheme. I gave her an example. Assuming you invest in a dividend-paying stock, you enjoy the capital gain and dividend income. Example, if you have bought 1000 units of Nestle on Jan 1, 2011 (closing price RM43.30) and held it for 1 year, your gain is the capital gain of RM12.90 per share (since the stock moved up to RM56.20) and the dividend received of RM1.70 per share. In total, you would have made RM14,600.

Assuming you have invested in gold to the tone of RM43,300 on Jan 1,2011 which is equivalent to 10.2 oz of gold at a price of USD1376 per oz (cross rate of USD1=MYR3.10). As at Dec 31, 2011, gold traded at USD1635 or MYR5,150 (based on the cross rate of USD1=MYR3.15). Your investment would yield a return of RM9,017 (computed as follows: 10.2 oz multiplied by a gain of MYR884 an oz).

Now, ask yourself what is missing? Unlike investing in stock where you get a dividend income, if you invest in gold you do not get any income. That's why some pundits call gold is a barbarous relic because you cannot derive any income from holding gold. I do not subscribe to that opinion. To me, gold is a store of value. In the current economic environment where central banks are debasing our fiat currencies, gold is a defensive investment asset. Nevertheless, the sad truth is that it does not generate any income. Unless of course, if you consider lease rental of gold as an income. (Note: You can lease your gold to people who want to short gold). Even if you consider lease rental, the amount is next to negligible (less than 0.5% per annum). See the chart below. And, one more thing: To lease out your gold, you must hand over the possession of your gold to an investment firm. Sine you are keeping the gold, this source of income- however minuscule- is never in the equation.

From this simple analysis, you can ask the question- How can the gold investment scheme pay the handsome income of 2% per month? In addition, where would they get the money to pay handsome commission to the 'consultants'? If I were to assume that the consultants received a small commission of 5%, the management company incurred administrative expenses of 5% and let's factored in a small profit of 5%, the total expenses of these scheme would be 39%. Who pays for these expenses?

The same problem confronted the Roman Empire just before it collapsed. The solution was to debase their silver coinage, which means that you would get less silver than what was promised (here). The alternative is that you take from subsequent investors to reward the earlier investors & to cover the other operating expenses. So, many of the gold investment scheme are either cheating cases or Ponzi Schemes. That's the sad truth.

For those who like to invest in gold, my advice is buy physical gold from a commercial bank. Avoid exotic gold coins or get into a gold investment scheme. Stick to the well-established names like Canadian Gold Maple Leaf, Australian Kangaroo Gold Nugget, Swiss Kinebar & Singapore Lion Gold Coin. 


Chart: Gold Lease Rate for the past 1 year (Source: Kitco)

Thursday, October 04, 2012

Tenaga breaking above the resistance of RM7.10

Tenaga has just broken above the strong horizontal resistance of RM7.10. If this breakout can recruit sufficient support, it may continue to rise to the next resistance at RM7.70 (see Chart 1). And, if it can break above the RM7.70 resistance, it may revisit the high of February 2007 of RM9.63.

Based on this upside breakout, Tenaga has a bullish outlook.


Chart 1: Tenaga's weekly chart as at Oct 4, 2012_3.00pm (Source: Tradesignum)


Chart 2: Tenaga's monthly chart as at Oct 4, 2012_3.00pm (Source: Tradesignum)

Note:
In addition to the disclaimer in the preamble to my blog, I hereby confirm that I do not have any relevant interest in, or any interest in the acquisition or disposal of, Tenaga.

LMCemnt- uptrend to continue


LMCemnt broke above its recent high of RM9.00. With this breakout, its uptrend should continue. Target for the current move could easily be RM10.00.


Chart: LMCemnt's daily chart as at Oct 4, 2012_2.45pm (Source: Quickcharts)

Note:
In addition to the disclaimer in the preamble to my blog, I hereby confirm that I do not have any relevant interest in, or any interest in the acquisition or disposal of, LMCemnt.

Packaging industry in the spotlight

The news of Scientx's acquiring GWPlast points the way forward for those who like to stay invested in the consumer sector. As mentioned before, many consumer stocks are trading at lofty valuation and investors are inclined to get into the feeder industries that serve the consumer sector. One such industry would be the packaging industry.

We can see from Chart 1 the strong move in GWPlast. This chart is for display only as it is too late to get into this stock.


Chart 1: GWPlast's weekly chart as at Oct 4, 2012_11.00am (Source: Quickcharts)

Chart 2 shows the chart of Daiboci. As the stock has broken above its recent high at RM2.28, it can continue to rise.


Chart 2: Daiboci's weekly chart as at Oct 4, 2012_11.00am (Source: Quickcharts)

Finally, Tomypak! This stock is capped by its recent high at RM1.13. If it can surpass that level, it may revisit its high of July 2010 of RM1.34. Can that happen? We will have to wait & see.


Chart 3: Tomypakt's weekly chart as at Oct 4, 2012_11.00am (Source: Quickcharts) 

Note:
In addition to the disclaimer in the preamble to my blog, I hereby confirm that I do not have any relevant interest in, or any interest in the acquisition or disposal of, GWPlast, Daiboci & Tomypak.

Scientx- a good stock for long-term investment

Background


Scientex Bhd ('Sceintx') is involved in two main businesses: property development (mainly, residential and commercial properties), and manufacturing various packaging products and materials for automotive industry. 

The property segment contributes 28% of revenue but a whopping 66% of pre-tax profit.

Latest Development

Scientx has just announced that it will be acquiring Great Wall Plastic Industries Bhd and GW Packaging Sdn Bhd to increase its annual production capacity for cast stretch film from 120,000 tonnes to 154,000 tonnes. For more, go here.
 
Recent Financial Results

For QE31/7/2012, Scientx's net profit increased by 19% q-o-q or 13% y-o-y to RM23.4 million while revenue was unchanged q-o-q but increased by 10% y-o-y to RM226 million. Both manufacturing & property segments experienced increased revenue but the improved bottom-line came from sales of higher margin products by the property segment.


Table 1: Scientx's last 8 quarterly results


Chart 1: Scientx's last 28 quarterly results

Financial Position

Scientx's financial position is deemed satisfactory. as at 31/7/2012, its current ratio stood at 1.4 times while gearing ratio stood at only 0.1 time. Debtors' collection and Inventory turnover were satisfactory.

Valuation

Scientx (traded at RM2.56 as at 11.30am) has a PE of 6.6 times (based on last 4 quarters' EPS of 39.03 sen). At this PE multiple, Scientx is deemed inexpensive.

Technical Outlook

Scientx is in an intermediate uptrend line, with support at RM2.35. If it can break above the 'horizontal' line at RM2.60, the stock may continue with its prior uptrend.


Chart 2: Scientx's weekly chart as at Oct 4, 2012_11.00am (Source: Quickcharts)

Conclusion

Based on good financial performance & position, inexpensive valuation and positive technical outlook, Scientx could be a good stock for long-term investment.

Note:
In addition to the disclaimer in the preamble to my blog, I hereby confirm that I do not have any relevant interest in, or any interest in the acquisition or disposal of, Scientx.

Market Outlooks as at October 4, 2012

FBMKLCI rebounded strongly with recovery in the plantation stocks on reports that the government may consider a proposal to lower export duty on crude palm oil from 23% now to 8-10%. For more, go here. The impact of this reduction (when approved) would allow export to sell more of their products as compared to the Indonesian exporters which is currently subject to a lower export duties of 13.5%. This proposal may or may not have any impact on the price of CPO. Currently, the Malaysian CPO is stuck on shore and this is a drag on plantation companies & downstream players. By lowering the duties & freeing up the stocks for export, the international market will be affected.

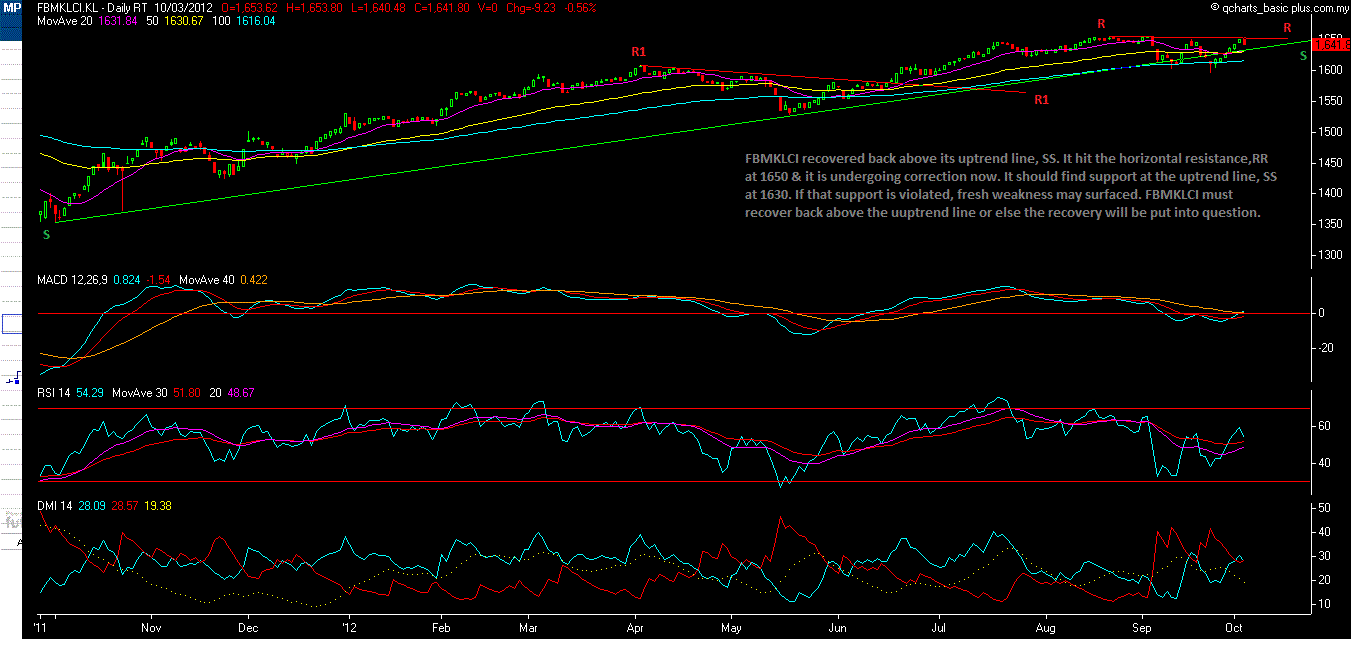
This morning, FBMKLCI jumped 11 points to 1661 as at 11.00am. This means that FBMKLCI has broken above the recent high of 1650. This breakout means that the index will likely to continue its uptrend.


Chart: FBMKLCI's daily chart as at October 4, 2012_11.00am (Source: Quickcharts)

Wednesday, October 03, 2012

Market Outlook as at October 3, 2012

FBMKLCI underwent correction after it tested the horizontal resistance at 1650. This correction could send the index to the medium-term uptrend line at 1630 (coinciding with the 20 & 50-day EMA line). If this support can hold up the index, the market would continue its gradual uptrend. If this support failed, the index may retest the psychological 1600 level again. A quick trip to the 1600 mark and a rebound would not invalidate the on-going market recovery. What the index must avoid is a convincing break of the 1600 mark, with follow through selling. 


Chart: FBMKLCI's daily chart as at October 3, 2012_12.00pm (Source: Quickcharts)


CPO approaching the psychological RM2000 mark!


This morning, we saw a sudden drop in the share price for Sime and the only news is that one of its indirect subsidiaries is going into voluntary liquidation. In the normal course of doing business, some companies are liquidated because the business is no longer viable or rewarding to justify its existence. Voluntary liquidation is nothing to fret about but when Sime's share price dropped, investors quickly joined the sell-off. The real reason for the drop in Sime's share price is simply because CPO prices have been dropping. This may come as news to some investors who they read in the Star newspaper that CPO plunged by 8.4%. I have posted that CPO downtrend may accelerated (here) after it broke its long-term uptrend. I have also posted on the economic rationale for a prolonged price adjustment (here). I believe CPO (closed at RM2083 per tonne yesterday) should find support at the horizontal-cum-psychological support of RM2000. This may not be the final stop for the current downtrend. If the RM2000 mark is violated, the next support levels are RM1700-1800 and then RM1400-1500.


 Chart 1: CPO's daily chart as at Oct 2, 2012 (Source: iFS.marketcenter.com)

As for the Plantation index, the weekly chart shows that the index is still in a long-term uptrend line. The support from that uptrend line is at 7500- about 10% below the Plantation index of 8260 yesterday. If CPO can stage a rebound from RM2000 mark, the Plantation index should hold above the long-term uptrend line. Conversely, a breakdown of the RM2000 mark by CPO would likely be followed by a similar breakdown of the uptrend line by the Plantation index. The technical indicators for the Plantation index are mildly negative, with MACD entering the negative territory; RSI trending down; and, -DMI & ADX rising while +DMI dropping. With negative technical indicators present in the Plantation index, a breakdown of the uptrend line could easily trigger a sell-off similar to what happened in 2008.


Chart 2: Plantation index's weekly chart as at Oct 3. 2012_10.30am (Source: Quickcharts)

Based on the above, one should use the opportunity presented in any rebound to reduce his position in the Plantation sector. Avoid buying into the Plantation sector in the present weakness.

Tuesday, October 02, 2012

Innity- an internet play!


Background

Innity Corporation Bhd (Innity) is involved in the provision of online advertising solutions. To learn more about how this company uses the internet to grow beyond boundaries, go here.

The Trend is Your Friend

In a recent article in Business Insider, we learn that Online Advertising has been rising while traditional Offline Advertising has been sliding. From Chart 1 below, we can see the share of Online Advertising has increased from 23% of Total Media Advertising in 2006 to 38% in 2011 while Offline Advertising has declined from 77% to 62%.


Chart 1: US's Online & Offline Advertising trend for the past 5 years

During the same period, the traditional Offline Advertising which had declined are print (55%), outdoor (50%) and radio (36%). TV advertising remains steady at 41-42%. (Note: This data may explain why the Star newspaper has pushed aggressively into the online space.)


Chart 2: US's Media Advertising trend for the past 5 years

Recent Financial results

Since its listing, Innity's top-line has been on the rise. While its bottom-line has been rather erratic, the noticeable trend is upward. For QE30/6/2012, its net profit rose 550% q-o-q or 67% y-o-y to RM1.1 million while revenue rose 46% q-o-q or 47% y-o-y to RM12 million. The sharp rise in top-line & bottom-line could be attributable to the build-up to the Olympic but even without this big event, I believe the upward trend will still be positive.


Table 1: Innity's last 8 quarterly results


Chart 3: Innity's last 17 quarterly results

Financial Position

As at 30/6/2012, Inniti's financial position is deemed healthy. Current ratio stood at 2.5 times while gearing ratio is negligible at 0.02 time. Its cash reserve stood at RM7.0 million or 5 sen per share.

Valuation

Innity (closed at RM0.46 yesterday) is now trading at a PE of 17 times (based on last 4 quarters' EPS of 2.75 sen). Based on CAGR for the top-line of 50% for the past 2 years, I would rate the PE multiple for Innity is acceptable for a growth stock.

Technical outlook

Innity broke above the strong horizontal resistance of RM0.30 in early part of the year. Its immediate resistance is the horizontal line at RM0.50. Its MACD has hooked down- signaling near-term weakness. If this weakness continued, the share price may slide back to RM0.30-0.35.


Chart 4: Innity's weekly chart as at October 1, 2012 (Source: Tradesignum)

Conclusion

Based on the favorable advertising trend, satisfactory financial performance and strong financial position, Innnity is a stock worth investing for long-term. However, its technical weakness could mean that the stock could consolidate its recent gain and a pause in its strong rise in the past 18 months. This could present a good opportunity to get into the stock.

Note:
In addition to the disclaimer in the preamble to my blog, I hereby confirm that I do not have any relevant interest in, or any interest in the acquisition or disposal of, Innity.

Astro- the case for strong growth looks dicey

There is an interesting article in Business Insider that dealt with the state of the internet. This article, presented by Henry Blodget, the CEO of Business Insider, talks about the state of & the impact of commercial internet. One of the slides shows the decline of pay TV subscription in the US. See Chart 1 below.


 Chart 1: US Pay TV Subscription (Source: Business Insider)

 On the other hand, over-the-top video (such as Netflix & Youtube) is on the rise. See Chart 2 below. The question to ask is whether the decline in Pay TV subscription was due the economic condition in the US or consumers' preference. If it is the latter, then we can expect the same phenomenon to happen in Malaysia.

This development could raise doubts about the assumption made by some research houses about the strong growth for Astro in order to justify the high PE multiple for its IPO. While Astro is venturing into IPTV (like Unifi), that business model is no different from its existing satellite TV. Over-the-top video works well with the new generation of smart TVs which enables consumers to access the internet for video directly.


Chart 2: Growth of Over-the-top video (Source: Business Insider)

Monday, October 01, 2012

Apollo- a rocket with wet powder


Background

Apollo Food Holdings Berhad ('Apollo') is engaged in the manufacturing and trading in compound chocolates and chocolate confectionery products and cakes, and the distribution and marketing of compound chocolates and chocolate confectionery products and cakes.


Recent Financial results

For QE31/7/2012, its net profit dropped 8.3% q-o-q but rose 151% y-o-y to RM8.0 million while revenue increased by 4.6% q-o-q or 18.0% y-o-y to RM58.8 million. Apollo's net profit benefited from increased revenue, which in turn is due to higher sales from domestic & export markets as well as the fall in the prices of certain raw material.


Table 1: Apollo's last 8 quarterly results


Chart 1: Apollo's last 20 quarterly results

Financial Position

Apollo's financial position is deemed very healthy. As at 31/7/2012, its current ratio stood at 12.4 times. Not only it did not have any borrowing, it has cash reserves of RM59 million or 74 sen per share.

Valuation

Apollo (closed at RM3.23 on Friday) is trading at a PE of 9.7 times (based on last 4 quarters' EPS of 33.21 sen).It also traded at a Price to Book of 1.2 times or a dividend yield of 6.2%. As such, Apollo is a good income stock that trades at reasonable PE & PB multiples.

(Note: The entitlement date for the final dividend of 20 sen will be  on December 10).

Technical Outlook

Apollo is in a gradual upward channel.


Chart 2: Apollo's monthly chart as at Sept 28, 2012 (Source: Tradesignum)

However, its immediate resistance is likely to be about RM3.40-3.50. On weakness, it may drop back to the support of RM3.10.


Chart 3: Apollo's weekly chart as at Sept 28, 2012 (Source: Tradesignum)

Conclusion

Based on good financial performance, strong financial position, reasonable valuation & mildly positive, albeit unexciting technical outlook, Apollo could be a good stock for long-term investment.

Note:
In addition to the disclaimer in the preamble to my blog, I hereby confirm that I do not have any relevant interest in, or any interest in the acquisition or disposal of, Apollo.

Thursday, September 27, 2012

Telcos are poised to move higher

Digi has broken above its recent high of RM5.05 yesterday to close at RM5.12. At the close of the morning session, it gained RM0.13 to close at RM5.25.


Chart 1: Digi's daily chart as at September 27, 2012_12.30pm (Source: quickcharts)

The second telco that has a breakout is Axiata. It broke above its recent high of RM6.30-6.32. It is up only 2 sen now (trading at RM6.36).


Chart 1: Digi's daily chart as at September 27, 2012_12.30pm (Source: quickcharts)

TM has yet to break above its recent high of RM6.08.


Chart 1: Digi's daily chart as at September 27, 2012_12.30pm (Source: quickcharts)

Maxis is still in a short-term downtrend line with resistance at RM6.90. At the end of the morning session, it gained 7 sen to close at RM6.87.


Chart 1: Digi's daily chart as at September 27, 2012_12.30pm (Source: quickcharts)

Based on the overall strength of the telcos (in a poor market), I believe that the breakout in Digi & Axiata is a signal that this sector is due for a move to the upside.

Note:
In addition to the disclaimer in the preamble to my blog, I hereby confirm that I do not have any relevant interest in, or any interest in the acquisition or disposal of, Axiata, Digi, Maxis & TM.

Wednesday, September 26, 2012

Astro IPO priced at a demanding multiple!

Astro Malaysia Holdings Bhd (‘Astro’) will be relisted on our exchange soon. This IPO will involve the listing of 5.248 billion Astro shares on October 19. On Page 244 of the Prospectus, we can see the Financial Information for the company.

You will see the following financial data:
1) Astro’s 1Q2013 revenue increased by 8.6% to RM986 million as compared to RM908 million. Gross Profit increased from RM386 million to RM401 million but Pre-tax profit declined from RM263 million to RM172 million. Proft after Tax had similarly dropped from RM196 million to RM123 million.
2) EBITDA margin, Pre-tax Profit margin & Net Profit margin all declined. EBITDA margin dropped from 39.2% to 34.7%; Pre-tax Profit margin dropped from 29.0% to 17.4%; & Net Profit margin dropped from 21.6% to 12.5%.
3) Astro’s FY2012 revenue increased by 6.1% to RM3889 million as compared to RM3664 million. Gross Profit dropped marginally from RM1664 million to RM1652 million. Pre-tax profit declined from RM1091 million to RM864 million. Profit after Tax had similarly dropped from RM827 million to RM630 million.
4) EBITDA margin, Pre-tax Profit margin & Net Profit margin all declined. EBITDA margin dropped from 37.4% to 36.4%; Pre-tax Profit margin dropped from 29.8% to 22.2%; & Net Profit margin dropped from 22.6% to 16.2%.
5) The Annualized Basic & Diluted EPS for FY2013 are 10.4 & 9.3 sen, respectively.
As such, Astro IPO priced at RM3.00 apiece is valuing the stock at a PE of 32 times. That is very demanding valuation and the only way that you can justify that is if the company can grow at a very fast pace, say 20% or higher. We will have to see whether that is achievable.

When I studied the Maxis relisting in 2009, one of the areas that I looked at was how much higher is the new company (Maxis 2009) being priced at via-a-vis the value of the company when it was delisted (Maxis 2007). In the case of Maxis, we learned that “Maxis 2009 is valued at 18.5% higher than Maxis 2007”. If we do the same comparison for Astro, we would have Astro 2010 valued at RM8.5 billion (here) as compared to Astro 2012 valued at RM15.744 billion- a whopping 85%-increase in value!

As John Hussman has stated many times, if you buy a stock that is trading at high PE, then that investment will give you a poor return. In the case of Maxis, growth has picked up after its listing. Will the same happen for Astro?

HWGB- a light-bulb moment?

On September 24, Ho Wah Genting Bhd ('HWGB') proposed to acquire a 51%-stake in Myled Opto Technology Sdn Bhd from three individuals, for RM1 million. Myled Opto's business principally is in the manufacturing of solid state lightings (SSL) and light-emitting diodes (LED) lightings. For more, go here.


Today & barely two days later, HWGB announced that MyLed Opto has secured contracts valued at RM800 million from Japan's Kirutorisu Tech and Atotis Co Ltd, marking the company's venture into the Japanese vending machine market. For more, go here.  

My initial thoughts/questions on the above news are:
1) What is the connection between solid state lightings (SSL) and light-emitting diodes (LED) lightings on the one hand and vending machines on the other hand? True, many electrical appliances require lightings, why not vending machines! Nevertheless, two contracts valued at RM800 million must be a coup!

2)  Why would two Japanese companies rush to give the contracts to Myled Opto? The most plausible explanation is that HWGB is very well-connected; thus, it can land these contracts (unlike the previous management of Myled Opto). However, if you look at the existing businesses of HWGB- trading, manufacturing of wires & cables and tin mining- and its financial performance todate, it is difficult to see where this skill set lies in the company.
3) Assuming Myled Opto is manufacturing the lightings to fulfill the contract, the fact that HWGB paid only RM1 million for  a 51%-stake in Myled Opto would suggest that the acquired company is in a financial weak company. Any manufacturing concern with factory & production equipment cannot be worth so little. The big question then would be how HWGB can mobilize the resources to complete these two contracts. For that. let's look at the accounts.
 Based on HWGB's financial statements for QE30/6/2012 (here), we can see that HWGB's current ratio was slightly below 1 time. Its cash reserves was quite large at RM13 million but so is its short-term borrowings which stood at RM59 million. Its gearing ratio stood at 0.75 time. 

For the 6-month ended 30/6/2012, HWGB incurred a net loss of RM7 million on a revenue of RM106 million. Of its three divisions, two (Manufacturing & Mining) lost money while the last one (Trading) made a small profit of RM304,000 for QE30/6/2012.

Based on the above, I have serious doubt as to the above news items. I am glad to note that the market shares my sentiment on these news & reacted appropriately. HWGB rose to a high of RM0.34 in early trading, has since retreated back to RM0.33 (a gain of only RM0.005). I feel strongly that HWGB should be AVOIDED.


Chart: HWGB's monthly chart as at Sep 25, 2012 (Source: Quickcharts)

Note:
In addition to the disclaimer in the preamble to my blog, I hereby confirm that I do not have any relevant interest in, or any interest in the acquisition or disposal of, HWGB.

Tuesday, September 25, 2012

Scomi- no longer an ugly duckling

Two Suitors?

Scomi has just announced that it will do a private placement of some 10% of its paid-up capital would be made to IJM. In addition, IJM will subscribe for RM110 million worth of zero coupon 3-year Redeemable Convertible Secured Bond to be issued by Scomi. This news came hot on the heal of the news that Abu Sahid of the Maju Group has emerged as a substantial shareholder in Scomi with a 8.75%-stake. News of Abu Sahid's interest in Scomi first surfaced in early September when the market learned that Siew Mun Chuang had amassed a 5.3%-interest in Scomi. Siew is closely linked to Abu Sahid. How will Abu Sahid & IJM work together with the existing major shareholder, Shah Hakim Zain? Abu Sahid, with interests in steel production & mining (including a stake in Australia-listed Avalon Mineral Ltd), could be keen in Scomi's Oil & Gas business while IJM could be interested in Scomi's subsidiary, Scomi Engineering Bhd. Are they going to work together or are they going to carve up the group?

Scomi's Restructuring

In February, Scomi announced a corporate restructuring, which would see its oilfield services businesses and those of Scomi Marine merged under a new, full-fledged integrated oil and gas marine and drilling services provider. When merger has been completed, Scomi will make an Offer for Sale of its Scomi Marine shares. The proceed from that sale will be used to pare down the group’s debts. As at 30/6/2012, the group has short-term borrowings of RM711 million & long-term debt commitment of RM387 million.  

Scomi venturing into Oil and Gas Exploration and Production 

Scomi is believed to be the front runner for two risk-service contracts (RSCs) to be awarded by Petronas for the Tembikai and Cenang marginal fields off Peninsular Malaysia. These two fields with contracts valued at between US$200mil (RM620mil) to US$400mil (RM1.2bil) each. It is said to be partnering an Australian company, Cue Energy Resources Ltd, for this bid. Cue Energy is an oil and gas exploration and production company with a presence in South-East Asia and Australasia. 

Technical Outlook

Scomi has finally put in a decent rebound after declining continuously since May 2009. Its immediate resistance is at RM0.40 and thereafter at RM0.45 & RM0.55. Its immediate support is at RM0.30.


Chart 1: Scomi's monthly chart as at September 25, 2012_3.30pm (Source: Quickcharts)

IJM's Possible Angle

I believe IJM's interest in Scomi is to get a slice of the action in the monorail market. For more on the monorail project, go here. Combining that with its strong engineering background, IJM can offer a complete solution to the transportation problem faced by many cities in the developing & emerging nations.

IJM- A Patient Chess Player

While I see potential in a tie-up between IJM & Scomi, the fruit of this marriage may not happen immediately. That's because IJM is a patient mover. If the management team in IJM & Scomi can work well together, things can happen very quickly. If not, IJM will bid its time. A clear example is how IJM bought a 25%-stake in KEuro at 28 sen apiece for RM33.1 million in 2005. IJM Corp said at the time the purchase was influenced by its interest in KEuro’s concessions to build the West Coast Expressway (a highway stretches for 316km from Banting, Selangor to Taiping, Perak) and its 50%-stake in the Canal City, a 1,900-acre development near Kota Kemuning in Shah Alam. 

Today, the West Coast Expressway project & the Canal City development are about to kick off. IJM's shareholders will thank their management for their strategic move to take a stake in the troubled KEuro seven years earlier for a token sum of RM33.1 million.


Chart 2: KEuro's monthly chart as at September 25, 2012_3.30pm (Source: Quickcharts)


Chart 3: IJM's monthly chart as at September 25, 2012_3.30pm (Source: Quickcharts)

Which is a Better Bet?

Looking at the chart of KEuro & IJM, there is no doubt that one would have been better rewarded if he/she had bought into KEuro in 2005, instead of IJM. On the same basis, it would be better to invest in Scomi & wait patiently for the full potential of the group to be realized.

Monday, September 24, 2012

CPO prices may remain depresssed for a long while


One of the basic principles of economic model is that the market functions well in determining price by matching supply and demand for any good or service so that the supply of and the demand for the good or service will be in equilibrium. This is illustrated by a simple chart (Chart 1), where the demand curve is red while the supply curve is green. The logic behind the demand curve is simply this: as the price increases, the demand drops. At the same time that the price increases, the supply increases. However, there is a limit to the increase or decline in demand or supply. No matter how high is the price of rice, we still need to consume rice as it is a staple diet. No matter how high is the shipping rate, we still have to charter a ship to transport our export. Conversely, no matter how high is the price of rice, the farmer cannot increase that supply significantly until next year when he would plant more paddy. The same goes for the shipping companies as the number of ships available is limited at that moment in time. They could order more ships to fill the demand but there will be a time lag.


Chart 1: Supply & demand curve in equilibrium

In 2007, the demand curve for CPO shifted to the right [see Chart 2] due to increased demand for CPO for use in biodiesel fuel and also from increased demand by consumers in China & India (a result of improved living standard). As supply curve remained stationary, CPO prices shot up and broke above the USD600 (or equivalent to RM2000) per tonne [see Chart 3].


Chart 2: Demand curve shifted to the right 


Chart 3: CPO Prices, in USD per tonne (Source: Mongabay)

The period of super-normal profit induced many plantation companies to open up new land for cultivation of palm oil. Due to time lag, where oil palm trees can only start to produce FFB after 3-4 years (while the more productive age is above 7 years old), the increase in oil palm estate land did not make a dent in the price of CPO for the past few years.

However, as the tree begins to reach the age of 7th year, the FFB output should increase significantly in the next few years. This increase will result in the supply curve shifting to the right. This shifting of the supply curve will result in a new price equilibrium with prices dropping back.


Chart 3: Supply curve shifted to the right

Some may argue that the demand by consumers in China & India are still strong. And, so is the demand for use in biodiesel. However, this additional demand has been factored into the demand curve and the increase (if any) will be marginal and this would not represent a shift in the demand curve. As such, I do not foresee CPO going back to the heyday of RM4000 per tonne. In fact, I believe there is greater likelihood of CPO dropping further to possibly RM2000 per tonne.

In fact, if you read analysts' reports, one of the argument made to buy a plantation stock is that more oil palm estate will be reaching maturity or reaching the more productive phase over the next few years. When this event happens- and there are many companies that are poised to enjoy increased output- wouldn't the increased supply of CPO result in lower prices. My experience in rubber glove sector in late 2010 (here) and the shipping sector in late 2007 (here) taught me something- when everybody increased their capacity to benefit from super-normal profit, that sector will eventually suffer a sharp drop in prices and abysmal profit. I believe that we will see this in plantation sector. The best way to profit from this peak price scenario is to sell off the productive assets. Maybulk sold off most its ship in 2007-2008. CBIP sold off its plantation assets or investment in early part of the year.