Wednesday, October 31, 2012

Gtronic- bottom-line improved due to exceptional gain

Results Update

For QE30/9/2012, Gtronic's net profit rose by 46% q-o-q or 84% y-o-y to RM14.2 million while revenue increased by 13% q-o-q or 11% y-o-y to RM78.3 million. The increased revenue is attributed to higher loadings from its customers while increased net profit was attributed to better product mix, economy of scale & an exceptional gain of RM4.5 million on disposal of land & building in Jitra. If the exceptional gain is excluded, Gtronic's net profit would be RM9.7 million- unchanged when compared to the immediate preceding quarter (QE30/6/2012).


Table 1: Gtronic's last 8 quarterly results


Chart 1: Gtronic's last 22 quarterly results

Valuation

Gtronic (closed at RM1.50 yesterday) is now trading at a PE of 11.5 times (based on last 4 quarters' EPS of 13.1 sen). If the exceptional gain from the disposal of the Jitra property is excluded, the last 4 quarters' EPS would drop to 11.4 sen and the trailing PE would rise to 13.2 times. At this PE, Gtronic is deemed fairly valued.

Technical Outlook

Gtronic is in an intermediate uptrend since the beginning of the year. It has performed better than its bigger competitors- Unisem & MPI- both in term of financial performance as well as share price performance. The stock's immediate resistance is at the horizontal line at RM1.50 while its immediate support is at the horizontal line at RM1.35.


Chart 2: Gtronics weekly chart as at Oct 30, 2012 (Source: Quickcharts)

Conclusion

Based on good financial performance, Gtronic is a good stock for long-term investment. However, the valuation is no longer cheap and the stock's upside is capped by the horizontal resistance at RM1.50. As such, I would rate this stock a HOLD for now.

Note: 
In addition to the disclaimer in the preamble to my blog, I hereby confirm that I do not have any relevant interest in, or any interest in the acquisition or disposal of, Gtronic.

Tuesday, October 30, 2012

GAB & Carlsbg broke above their recent high

Both GAB & Carlsbg have broken above their strong horizontal resistance in the past few days. GAB broke its resistance at RM16.00 & could potentially hit a target of RM17.00 (arrived at by adding the distance between the recent low of RM15.00 & breakout level of RM16.00 to the breakout level).

Carlsbg broke its resistance at RM12.60 & could potentially hit a target of RM14.20 (arrived at by adding the distance between the recent low of RM11.00 & breakout level of RM12.60 to the breakout level).

Based on the bullish breakout, both stocks could be trading BUY.


Chart 1: GAB's daily chart as at Oct 30, 2012_3.00pm (Source: Quickcharts)


Chart 2: Carlsbg's daily chart as at Oct 30, 2012_3.00pm (Source: Quickcharts)

Note: 
In addition to the disclaimer in the preamble to my blog, I hereby confirm that I do not have any relevant interest in, or any interest in the acquisition or disposal of, GAB & Carlsbg.

Monday, October 29, 2012

Armada- time to set sail

Armada has broken above the strong horizontal resistance at RM3.80 today. This follows the upside breakout of its intermediate downtrend line at RM3.70 on October 24. With these double breakout, the stock is set for its next upleg. Its next resistance would be at RM4.06.


Chart: Armada's daily chart as at October 25, 2012 (Source: quickcharts)

The catalyst for a re-rating of the stock could be due to the recent news that Armada has taken delivery of its fifth FPSO, Armada Sterling which will serve the India-based Oil and Natural Gas Corporation Ltd (ONGC) at the D-1 field, 200km offshore from Mumbai. Armada is reported to be on the lookout for more prospect in India. For Armada's list of FPSOs, go here.

Based on the bullish breakout, Armada could be a good stock for a trading BUY.

Note: 
In addition to the disclaimer in the preamble to my blog, I hereby confirm that I do not have any relevant interest in, or any interest in the acquisition or disposal of, Armada.

Tomypak- a proxy to the consumer play

Background

Tomypak Holdings Bhd ('Tomypak') is one of the leading converter for flexible food packaging materials in Malaysia. 
Recent Financial Results

Based on its last 4 years result, Tomypak's financial performance is deemed satisfactory. For QE30/6/2012, Tomypak's net profit increased by 55% q-o-q or 98% y-o-y to RM5.5 million while its revenue rose 7% q-o-q or 2% y-o-y to RM56 million. The sharply higher bottom-line was attributed to better sales mix.


Table 1: Tomypak's last 8 quarterly results


Chart 2: Tomypak's last 19 quarterly results

Financial Position

As at 30/6/2012, Tomypak's financial position is deemed satisfactory. Current ratio stood at 2.2 times while gearing ratio stood at 0.25 time.

Valuation

Tomypak (closed at RM1.21 last Friday) is now trading at a PE of 9 times (based on last 4 quarters' EPS of 13.43 sen). Its dividend yield is quite attractive at 5.4%. At these multiples, Tomypak is deemed fairly valued.

Technical Outlook

Tomypak has been moving sideway for slightly more than 2 years. The stock may surge & test its high of RM1.34 recorded in July 2010. On weakness, it may pullback to its 20-week EMA line at RM1.05. This is a stock which one can buy on weakness or on breakout.


Chart 3: Tomypak's weekly chart as at Oct 25, 2012 (Source: Quickcharts)

Conclusion

Based on good financial performance & reasonable valuation, Tomypak is another good proxy to gather a foothold in the consumer sector.

Note: 
In addition to the disclaimer in the preamble to my blog, I hereby confirm that I do not have any relevant interest in, or any interest in the acquisition or disposal of, Tomypak.

Daiboci- bottom-line increased despite lower top-line

Results Update

For QE30/9/2012, Daiboci's net profit increased by 8% q-o-q or 52% y-o-y to RM6.9 million while revenue declined by 7% q-o-q or 3% y-o-y to RM65.7 million. The decline in revenue was attributed to the phasing out of the property business (see Chart 1).


Table 1: Daiboci's last 8 quarterly results


Chart 1: Daiboci's last 6 quarterly segmental performacne

Bottom-line improved due to better waste control for packaging segment while there is no contribution from property segment, which was being phased out


Chart 2: Daiboci's last 20 quarterly results

Valuation

Daiboci (closed at RM2.62 on Friday) is trading at a PE of 12 times (based on last 4 quarters' EPS of 21.65 sen). Daiboci's dividend yield is quite attractive at 4.8%. At these multiples, Daiboci is deemed fairly valued.

Techncial Outlook

Daiboci surpassed its February 2010 high of RM2.28 in early October. The current upleg could possibly send the stock to a high of RM3.00.


Chart 3: Daiboci's weekly chart as at Oct 25, 2012 (Source: Quickcharts)

Conclusion

Based on good financial performance & bullish technical outlook, Daiboci is a good proxy to gather a foothold in the consumer sector.

Note: 
In addition to the disclaimer in the preamble to my blog, I hereby confirm that I do not have any relevant interest in, or any interest in the acquisition or disposal of, Daiboci.

Wednesday, October 24, 2012

Market Outlook as at October 24, 2012

DJIA had a big drop yesterday. That's because it has broken its intermediate uptrend line, SS at 13500 on last Friday. DJIA's strong support is at the horizontal lines at 12900 & 12800 and later at the longer term uptrend line, S1-S2 at 12700.

 
Chart 1: DJIA's daily chart as at Oct 23, 2012 (Source: Stockcharts)

Nasdaq has similarly broken its intermediate uptrend line, SS at 3050 last Friday. Its strong support is at the horizontal line cum uptrend line at 2950.

 
 Chart 2: Nasdaq's daily chart as at Oct 23, 2012 (Source: Stockcharts)

DAX may soon test its intermediate uptrend line, SS at 7050. If the uptrend line is violated, the next support is the horizontal line at 7000.

 
Chart 3; DAX's daily chart as at Oct 23, 2012 (Source: Stockcharts) 

Asian markets- like the US & European markets- have risen substantially in the past 4 months. It is interesting to note that some of the Asian markets had broken above their intermediate downtrend line in the past 3 months (July for BSE, August for STI & September for HSI). The only exception is SSEC but even that index has broken above its medium-term downtrend line. All in all, I see good potential for many Asian markets, possibly putting in a gain of 10-15% over the next 3-6 months.


Chart 4: BSE's daily chart as at Oct 23, 2012 (Source: Stockcharts)


Chart 5: HSI's daily chart as at Oct 23, 2012 (Source: Stockcharts) 


Chart 6: STI's daily chart as at Oct 23, 2012 (Source: Stockcharts)


Chart 7: SSEC's daily chart as at Oct 23, 2012 (Source: Stockcharts)

This observation is consistent with the positive outlook for our local stock market.

Tuesday, October 23, 2012

TAS- a shipbuilder with a positive technical outlook

TAS Offshore Bhd ('TAS') is a small company involved in shipbuilding & ship repair. Its main markets are Malaysia and Singapore. For QE31/82012, it reported a net profit of RM2.7 million on a revenue of RM17.8 million (go here for more). Its annualized EPS would be about 6.2 sen. At RM0.485, the stock is trading at a PE of 8 times, which is relatively expensive for a small cap.Its Price to Book is about 0.6 time (based on NTA of RM0.80 as at 31/8/2012) & it has a dividend yield of 3%.

Chartwise, the stock seems to have broken above its bottoming phase last week when it broke above the horizontal resistance at RM0.45. With this breakout, the stock can slowly climb to test its next few resistance at RM0.55, RM0.60 & RM0.70.

Based on technical consideration, TAS could be a good stock for a medium-term investment/trade. A good entry level is at RM0.45.


Chart: TAS's weekly chart as at Oct 23, 2012_3.00pm (Source: Quickcharts)

Note: 
In addition to the disclaimer in the preamble to my blog, I hereby confirm that I do not have any relevant interest in, or any interest in the acquisition or disposal of, TAS.

CPO- forming a base


CPO has rebounded after traded below RM2200. The major catalyst for a more positive outlook for CPO is the recent reduction in the export duties of CPO from the current 22-23% to 4.5-8.5% in January 2013 (for more, go here).

From the Chart 1, we can see that CPO is trading around RM2300-2400 for the past 2 weeks. Yesterday, it broke above that range & tested the RM2500 horizontal resistance. If CPO can successful breakout above the RM2500 mark, the current rebound can turn into a mini rally, sending CPO prices to first, close the gap at RM2700 (a resistance) and then, possibly test the strong horizontal resistance at RM2830 (also, look at Chart 2). I would consider the mini rally to be the optimistic scenario, while a successful breakout above RM2830 to be a low probability event. After all, CPO has broken the long-term uptrend line that stretched back to October 2008 (see Chart 3). 


Chart 1: CPO's daily price as at Oct 22, 2012 (Source: iFSmarketcenter.com)


Chart 2: CPO's weekly price as at Oct 22, 2012 (Source: iFSmarketcenter.com)


Chart 3: CPO's weekly price as at Oct 22, 2012 (Source: iFSmarketcenter.com)

Based on the above, I would still maintain the negative outlook for CPO and the plantation sector.

PPB- tested its intermediate downtrend line

Like TWS, PPB has also staged a strong rebound. Early this morning, the stock rose to an intra-day high of RM13.58. This means that the stock has tested its intermediate downtrend line cum horizontal line at RM13.50. A breakout above this level will be positive for the stock as this may signal the change from a downtrend to either a sideway movement or even an uptrend (not very likely). I am however inclined to believe that the first attempt at the downtrend line will not succeed as those, who had bought into the stock at RM12, will take profit, while others may use the opportunity to simply reduce their position.

The rise of PPB reflects the recovery of CPO prices over the past two weeks. Is the worst over for CPO? I will look at that at the next post.


Chart: PPB's daily chart as at Oct 23, 2012_11.00am (Source: Quickcharts)

Friday, October 19, 2012

TWS- a strong rebound

TWS's rebound continued today. The stock has gained 25% from its low of RM6.34 to the intra-day high of RM7.90 a few minutes ago.

TWS has just surpassed the strong horizontal resistance at RM7.80. It is now pressing against the intermediate downtrend line cum 100-day EMA line at RM7.90. While a breakout above the RM7.90 level would be a very positive technical sign, I think the stock has run up sufficiently to warrant some profit-taking for those who had bought into the stock earlier.


Chart: TWS's daily chart as at October 19, 2012 (Source: Quickcharts)

Thursday, October 18, 2012

Pantech- poised to move higher?

Background

Pantech Group Holdings Bhd ('Pantech') is involved in the manufacturing of stainless steel, carbon steel & duplex pipes and pipe fittings (such as valves, induction bends, forged flanges, etc) as well trading. Its products are intended mainly for the Oil & Gas sector.

Recent Financial Results

For QE31/8/2012, Pantech's net profit increased by 15% q-o-q or 98% y-o-y to RM14.3 million while its revenue increased by 13% q-o-q or 63% y-o-y to RM164 million. The improved performance was due to better demand from the O&G sector as well as better demand from overseas.


Table: Pantech's last 8 quarterly results


Chart 1: Pantech's last 21 quarterly results

Financial Position

Pantech's financial position is deemed mixed. As at 31/8/2012, its current ratio stood at 1.9 times while its gearing ratio stood at an elevated 0.7 time. While current ratio is satisfactory, its inventory level appears high with inventory turnover of 162 days. Debtors' turnover is probably within industry's standard at 64 days.

Valuation

Pantech (closed at RM0.68 yesterday) is now trading at a PE of 6.4 times (based on last 4 quarters' EPS of 10.56 sen). At this PE multiple, Pantech is deemed inexpensive.

Technical Outlook

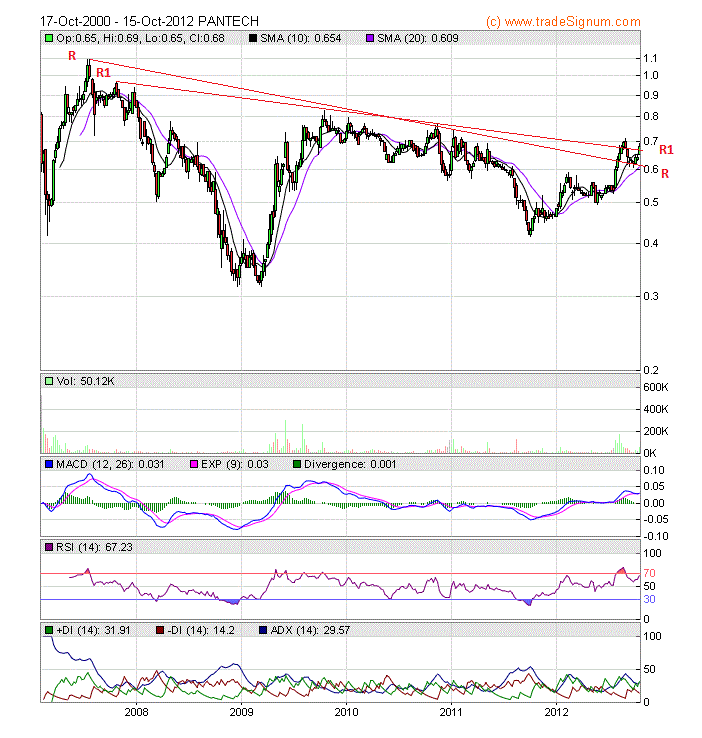
Pantech is trying to break above its intermediate downtrend line, RR or R1-R1. If this breakout is successful, the stock could rally to its strong horizontal resistance at RM0.75-0.80.
 
Chart 2: Pantech's weekly chart as at Oct 17, 2012 (Source: Tradesignum) 

Conclusion

Based on good financial performance, inexpensive valuation & potentially bullish technical outlook, Pantech could be a good stock for medium-term investment. However, the company's financial position is mixed and the company needs to address its high gearing as well as its high inventory. 

Note: 
In addition to the disclaimer in the preamble to my blog, I hereby confirm that I do not have any relevant interest in, or any interest in the acquisition or disposal of, Pantech.

Huayang- reported another good quarter!

Results Update

For QE30/9/2012, Huayang's net profit increased by 3.6% q-o-q or 22.8% y-o-y to RM17.1 million while revenue increased by 6% q-o-q or 36% y-o-y to RM104 million. The improvement was attributed to steady construction progress recognition for its apartment projects in Klang Valley (One South) and its on-going projects in Taman Pulai Tasek at Johor Bahru and Bandar Universiti Seri Iskandar in Perak.


Table: Huayang's last 8 quarterly results

 
Chart 1: Huayang's last 17 quarterly results

Valuation

Huayang (closed at RM1.61 yesterday) is now trading at a PE of 3.8 times (based on last 4 quarters' EPS of 41.91 sen). At that multiple, Huayang is deemed very attractive.

Technical Outlook

The stock is still in an uptrend, with support at the 50-day EMA line at RM1.49 & 100-day EMA line at RM1.41. Since the stock has broken above the recent high of RM1.60, there is a fairly high chance that it is about to move to the next level, possibly RM1.80.


Chart 2: Huaynag's daily chart as at Oct 17, 2012 (Source: Quickcharts)

Conclusion

Based on good financial performance, attractive valuation & positive technical outlook, Huayang is a good stock for long-term investment.

Note:
In addition to the disclaimer in the preamble to my blog, I hereby confirm that I do not have any relevant interest in, or any interest in the acquisition or disposal of, Huayang.

Wednesday, October 17, 2012

Property stocks starting to stir?


Today, we saw a strong rally by Mahsing, which gained 20 sen to close at RM2.40. From Chart 1, we can see that Mahsing is in its uptrend line, S1-S1 and it has broken above its intermediate downtrend line, R1-R1 in late July. Is this the start of a strong rally in Mahsing?


Chart 1: Mahsing's weekly chart as at Oct 17, 2012_4.00pm (Source: Quickcharts)

In early July, IJMLand also broke above its intermediate downtrend line but that that rally did not sustain. In mid-September, IJMLand gave back all its gain & dropped back below the downtrend line, only to be supported by its long-term uptrend line.


Chart 2: IJMland's weekly chart as at Oct 17, 2012_4.00pm (Source: Quickcharts)

The reason for the cautious price movement for IJMLand - which is also witnessed in SPSetia (see Chart 3) - is simply due to the uncertain outlook for the property sector. All these three companies have accumulated substantial landbank and the market is simply worried that they would fare poorly if the property market suffers due to various measures taken by the government to dampen speculative buying.


Chart 3: SPSetia's weekly chart as at Oct 17, 2012_4.00pm (Source: Quickcharts)

This is clearly reflected in the Property Index, which is still capped by the overhead intermediate downtrend line. See Chart 4 below.


Chart 4: Property's weekly chart as at Oct 17, 2012_4.00pm (Source: Quickcharts)

The market may take comfort that the demand for affordable housing is still fairly strong and the demand for speculative buying may return once the restrictive measures are removed. We can see that the demand for properties in neighboring countries, such as Singapore is still very strong despite months of aggressive measures to curbs speculative. Other than genuine demand for housing, the other factor that drives the property sector is the need to hedge against inflation due to aggressive monetary easing in the US, Eurozone and Japan. It looks like a matter of time when the government will roll back the restriction and the party in the property sector will start again. When that happens, many property stocks would continue to rally.

If you agree with this observation, you may take advantage of the recent correction in property stocks and position for their recovery.

Note:
In addition to the disclaimer in the preamble to my blog, I hereby confirm that I do not have any relevant interest in, or any interest in the acquisition or disposal of, Mahsing, IJMLand & SPSetia.

Monday, October 15, 2012

Return on Investment or Return of Investment

With interest rate on FDs at 3%, many savers are forced to invest their saving somewhere in order to hedge against inflation. In an effort to elevate their return, investors are tempted to take a leap of faith into the unknown & 'invest' based on tips in the stock market. Today, we saw one stock, Linear de-listed from our exchange and another, SAAG suffered a sharp drop as it was classified under PN1. I have written about these two stocks in 2010 & 2011 (here & here). Their fall is a sad reminder that we have to be very careful investing in penny stocks.


Chart 1: SAAG's weekly chart as at Oct 15, 2012_12.30pm (Source: quickcharts)


Chart 2: Linear's weekly chart as at Oct 12, 2012 (Source: quickcharts)

To avoid the madness of the market, some investors have gotten themselves into a bigger trouble by investing in gold trading schemes. That is not the only investment traps out there. This morning, I received an email from a reader asking about two oil palm schemes, Country Height Growers Scheme (CHGS) & Golden Palm Growers Berhad (GPGB). Some of the information was made available by a weblog named Palm Oil The Cash Crop. The schemes pay an annual income from Year 1 after your investment. For RM100k investment, the CHGS scheme pays an annual income of RM8k for year 1-3 and RM12k for Year 4-23. For a similar investment, the GPGB scheme pays an annual income of RM6k for Year 1-6; a gradually rising annual income of RM15k-21k for Year 7-17; and a gradually declining annual income of RM20-15k for Year 18-20.

My reply to him is as follows:

1. Any investment scheme where there is an income stream before the business can generate income should be treated with caution. This is how CHGS or GPGB are structured. The purpose of this structure is to induce people to buy into the schemes. This can lead to a ponzi effect where more money is collected and the sponsor is tempted to flee with the money. If you choose to be generous & kind to the sponsor, you may argue that the sponsor is a listed company & they won't do such thing. I am not sure.

2. This is an unlisted vehicle where if you want to liquidate, you have to abide by terms & conditions laid down by the management company. To me, this is more than a hassle. It is a serious setback that is seldom appreciated by investors who value the false security of an investment that is not subject to the vagaries of the market more than the restriction set by the management company.

3. If you can overcome the mental block described in (2) above, then you will see that there is a vehicle in Bursa that is almost  the same as CHGS or GPGB. That vehicle is called BSDReit, which gives a 6% yield. You may say CHGS or GPGB gives a better return, which may or may not be true.

Notwithstanding the above, you have to ask yourself - should I get into the oil palm sector? The words of the Minister seem to be very negative for CPO going forward and yet many simply regard it as an inconvenience or a short-term setback. I hope I am wrong & the Minister was exaggerating. 

My further thoughts:

Like a bank financing a house buyer, your investment in the oil palm scheme is a long-term financing for a long-term investment. Just as a bank cannot withdraw a housing loan once disbursed, you cannot withdraw from the above scheme once you have participated in it. To withdraw, you need to find a buyer who is willing to buy out your investment. Alternatively, the management company may buyback your investment at a steep discount with a view to reselling it. While this scheme may be genuine investment vehicle, you must consider your investment time horizon. If you need the fund within the next 3-5 years, you should avoid investing in the oil palm scheme because the payback time is 20 years.

It is important to note that I didn't say that CHGS or GPGB are ponzi schemes. The truth is I am not sure what they are. However, both schemes have one feature that is common in many Ponzi Schemes - the payment of income to the investors which is likely to come from the capital contributed by subsequent investors. One would come to this conclusion by asking a simple question: where would the business (of the oil palm estate) get the money to pay the income to the investors during the first three years of operation when it has not generated any income? One way to work around this is to argue that the income actually come from investor's initial capital. For example, when you invest RM100k in this scheme, a certain percentage (RM24k in the case of CHGS or RM18k in the case of GPGB) would be set aside to pay your income for the first 3 years. If you are prepared to accept this explanation, then you have to agree that the sales pitch includes at least one misrepresentation (by omission) which is the income for the first three years is actually from the investor's capital. This explanation will only be offered at the last resort because investors who had invested in this scheme would look pretty stupid when they are told that their income is simply from their own capital.

Whatever is their modus operandi, I hope that oil palm scheme will be self-sustaining despite my misgivings. It is not impossible that the scheme can be self-sustaining (if the estates are well-run & the 'bleeding' is confined to the 3-year of income payment). Nevertheless, I do not believe the return will be as exciting as promised. My main concern is that the scheme will be so successful that the sponsors or management companies would be deluged with cash to the point that they would be tempted to abscond with the money. I hope that the sponsors or management companies have set up  trusts to hold the funds as well as to regulate the receipt & disbursement of the funds. Trustee arrangement has worked very well in the unit trusts industry and it can work even in other investment scheme, such as the oil palm scheme.

Finally, if you are a busy person with loads of work & a hectic family life, I would advise you to invest in unit trust. Split your investment between an equity fund (try AMB Dividend Trust or Kenanga Growth) and a bond fund (try AmDynamic Bond & KAF Bond). You may also want to put 20% in property trusts and 10% in precious metals. A good place to get your unit trusts at a very low cost is Fund Supermart (here). Whatever you decide, be sure to consider the return of your investment as much as the return on your investment.

Friday, October 12, 2012

Redtone- a promising data & broadband play

Background

Redtone International Bhd ('Redtone') is involved in the provision of specialized broadband, data & managed network services to government, corporate and SME clients. In FY31/5/2012, Redtone has divested its three loss-making non-core businesses- Redtone Multimedia, Redtone Softwarre & Redtone Mobile- and repositioned itself in the data & broadband services.

Recent Financial Results

For FYE31/3/2012, Redtone returned to profitability with a net profit of RM2.5 million while revenue was RM107 million. A big part of that recovery was due to the deconsolidation gain of RM3.4 million arising from the divestment of its 80%-stake in Redtone Multimedia, which is involved in the provision of internet television. I have not tabulated the last 8 quarters' results because the performance of the company going forward will be substantially different from the past performance. For details of the results for FYE31/5/2012, go here.

Future Performance

Inet Research has prepared a report incorporating the latest Redtone's network sharing & alliance agreement with Maxis on its 2600 Mhz spectrum which is expected to drive its earning in 2013 onwards. The report gives a projected net profit for FY2013 & FY2014 of RM20.0 million & RM24.4 million, respectively. This translates to an EPS for FY2013 & FY2014 of 4.3 & 5.1 sen, respectively. For more, go here.

Valuation

Inet Research valued Redtone at RM0.43 based on 5.5 times the forward FY2013 EV/Ebitda.

Technical Outlook

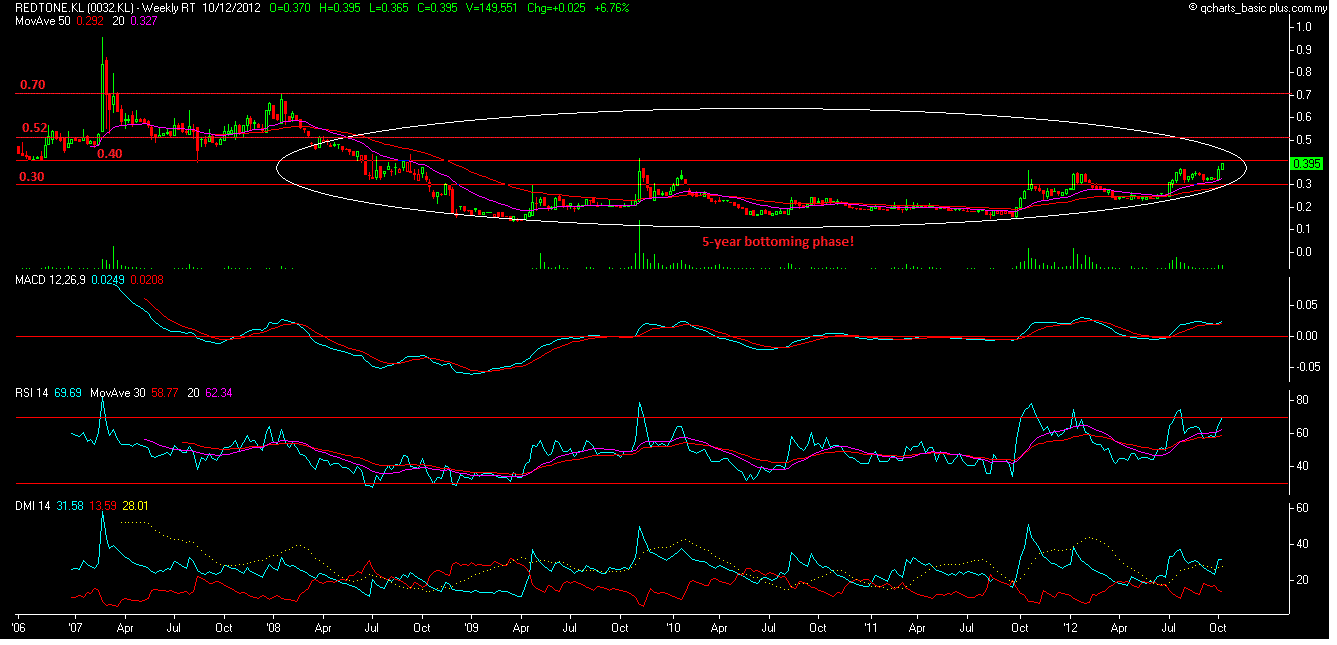
Redtone has formed a broad base in the past 5 years. An upside breakout of the resistance at either RM0.37 or RM0.40 could signal the beginning of the upleg for this stock (see Chart 2).


Chart 2: Redtone's weekily chart as at Oct 12, 2012_10.00am (Source: Quickcharts)

From the monthly chart (Chart 3), we can see that Redtone has broken above its long-term downtrend line, RR in 2011. If it can break above the resistance at RM0.37/0.40, the stock could begin its upleg. The 4 SMA lines have all reversed upward, indicating the underlying bullish tone for the stock.


Chart 3: Redtone's monthly chart as at Oct 11, 2012 (Source: Quickcharts)

Conclusion

Based on the restructuring undertaken by Redtone and the potential bullish reversal, Redtone is definitely a stock worth close tracking. An upside breakout of the last hurdle (at RM0.40) could be the trigger for the upleg for the stock.

Note:
In addition to the disclaimer in the preamble to my blog, I hereby confirm that I do not have any relevant interest in, or any interest in the acquisition or disposal of, Redtone.

Thursday, October 11, 2012

LBS- uptrend to continue

LBS is likely to continue with its uptrend after breaking above its recent high of RM0.89. In the past, this stock will rally in the same fashion after breaking its recent high (in December 2009 & June 2011). Its target is probably the line connecting the previous peaks (at about RM1.05).

LBS is a profitable property developer, which reported a net profit of RM19.5 million on revenue of RM239 million for 1H2012 ended 30/6/2012. Its annualized EPS for FY2012 is about 10 sen, Thus the stock is trading at PE of about 10 times. as such, the stock is deemed fully valued.

Despite the full valuation, LBS looks promising after its bullish breakout.


Chart: LBS's daily chart as at Oct 11, 2012_4.50pm (Source: Quickcharts)

Note:
In addition to the disclaimer in the preamble to my blog, I hereby confirm that I do not have any relevant interest in, or any interest in the acquisition or disposal of, LBS.


Topglov- Top-line & bottom-line continued to rise

Results Update

For QE31/8/2012, Topglov's net profit increased by 18% q-o-q or 144% y-o-y to RM63.5 million while revenue increased by 1% q-o-q or 12% y-o-y to RM607 million.


Table 1: Topglov's last 8 quarterly results


Chart 1: Topglov's last 25 quarterly results

The improvement in Topglov's profit margin coincided with the decline in rubber price. See Chart 2 below.


Chart 2: Rubber price as at Oct 10, 2012 (Source: Rubbernet)

Valuation

Topglov (closed at RM5.20 yesterday) is now trading at a PE of 15.9 times (based on last 4 quarters' EPS of 32.7 sen). At this multiple, Topglov is deemed fully valued.

Technical Outlook

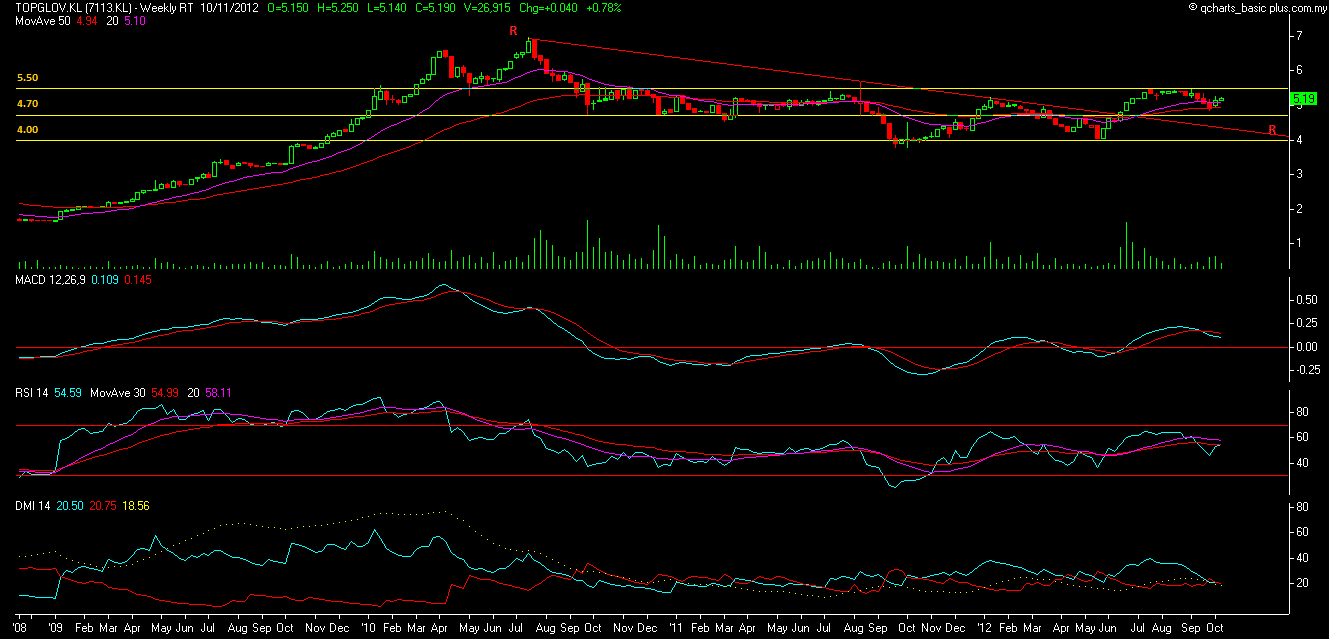
Topglov has been still moving sideway for nearly two years. Its immediate support & resistance is at RM4.70 & RM5.50, respectively.


Chart 3: Topglov''s weekly chart as at Oct 11, 2012_3.00pm (Source: Quickcharts)

Conclusion

Despite improving financial performance, Topglov is rated a HOLD due to demanding valuation. However, if the share price can break above the resistance of RM5.50, the stock could commence on its next upleg. When that happens, the rating of the stock may be revised to a BUY.

Note:
In addition to the disclaimer in the preamble to my blog, I hereby confirm that I do not have any relevant interest in, or any interest in the acquisition or disposal of, Topglov.

Wednesday, October 10, 2012

Amedia- another sharp drop!

In March, Amedia dropped 19% in one day and we haven't learned why that happened (here). After a 4 months sideway movement, the stock broke above the March high of RM0.45 and rallied all the way to RM1.15 on September 27. On October 3, it broke below the RM1.00 mark and the return trip began.

Despite the announcement of a generous Bonus Issue of shares of 1-for-1 plus an equally generous Bonus Issue of warrants of 1-for-1 on October 5, the stock continued to decline. In just 7 days, the stock lost 63% of its value. Bursa has issued a Unusual Market Activity (UMA) query to the company today. I would not expect much from the query.

From the chart, the stock is now testing the horizontal line at RM0.43. If this is violated, it would probably test the next horizontal line at RM0.33. The financial results, if they are accurate, show a company that is doing reasonably well. The only thing one can say about the account is that there have been a number of amendments to both the quarterly results as well as the annual reports (both FY2011 & FY2010). It will be interesting to learn what's caused a drop of such magnitude.

A stock, with a generous capital exercise, a planned transfer from ACE Board to Main Board and seemingly good financial performance (albeit messy accounting record-keeping), that drops with fierce intensity for days on end, is a stock to be avoided. (Note: Amedia closed at RM0.42).


Chart: Amedia's daily chart as at Oct 10, 2012_4.15pm (Source: Quickcharts)

Note:
In addition to the disclaimer in the preamble to my blog, I hereby confirm that I do not have any relevant interest in, or any interest in the acquisition or disposal of, Amedia.

Scomimr- the gem in the Scomi group

Scomi group has been in the headline for the past few days after IJM took a stake in Scomi. As you may know. Scomi is undergoing an internal reorganization which will see Scomi Marine ('Scomimr') emerging as an integrated oil and gas marine and drilling services provider. As part of the exercise, there will be a reverse take-over (RTO) exercise where Scomi's eastern hemisphere oilfield services will be injected into Scomimr; thus enlarging the latter's current business of offshore support services. Scomi's stake in Scomimr will be increased from 43% to 66%. Interestingly, IJM will subscribe for RM110 million of Scomi Redeemable Convertible Secured Bonds, where the security provided is Scomimr shares.

Look like the focus for the Scomi group as well as the reason why IJM bought into Scomi is the Oil & Gas sector. Since this business will be parked in Scomimr, this company is where we should concentrate our attention.

Chartwise, we can see that Scomimr has just broken above the intermediate downtrend line (AB) at RM0.35 yesterday and the strong horizontal resistance at RM0.38 this morning. See Chart 1.


Chart 1: Scomimr's daily chart as at Oct 9, 2012 (Source: Quiccharts)

If you look at the ling-term monthly chart, plotted on semi log scale (Chart 2), you will see that the stock had broken above its long-term downtrend line in 2010. Despite that breakout, the stock did not rally but instead moved sideway for 2 years in the form of an irregular pennant/frag formation (ABCD). The last time this stock was in a similar formation was in 2002-2005 (OPQR). In early 2006, Scomimr broke above that formation at RM0.40 and rallied to a high of RM1.80. Today, the stock appears to be breaking above the current formation. 

Based on the exciting prospects of Scomimr (following its restructuring & new shareholders) and the mildly bullish outlook, Scomimr could be a good stock to consider for long-term investment.


Chart 2: Scomimr's monthly chart as at Oct 8, 2012 (Source: Tradesignum)

Note:
In addition to the disclaimer in the preamble to my blog, I hereby confirm that I do not have any relevant interest in, or any interest in the acquisition or disposal of, Scomi & Scomimr.

Monday, October 08, 2012

Perisai may have a bullish breakout


There is a report by UOB Kay Hian Malaysia Research that Perisai may acquire a stake in Emas Offshore's (EOC) floating, production, storage and offloading (FPSO) vessel. EOC, which is 46.5%-owned by Ezra, was reported to have received a Letter Of Intent (LOI) to supply and operate a FPSO vessel to HESS for the Kamelia gas field.

The deal may have arisen because EOC needs to meet domestic content requirements for offshore projects, and it could complied with this requirement through Perisai's 40%-owned Larizz Petroleum [which is licensed to bid for local contracts].

UOB Kay Hian's estimate shows that by securing a 50% stake in the US$300mil FPSO vessel, Perisai's fair value would rise by RM300mil or 53 sen a share, assuming a project internal rate of return (IRR) of 15%, and enhance its earnings by RM38mil per annum. UOB Kay Hian valued Perisai at RM1.59. For more, go here.

The Edge reported that Perisai was valued at between RM1.20 (by Hwang DBS) to RM2.92 (by Hong Leong IB). For more, go here.

Chartwise, Perisai has broken above its recent high of RM1.04. See Chart 1 below. The stock could rise to a high of RM1.15-1.20 (as per the linear Chart 2) or it may shot up to RM1.50 (as per semi-log Chart 3).

Perisai has a bullish outlook based on technical breakout.


Chart 1: Perisai's daily chart as at Oct 8, 2012_3.00pm (Source: Quickcharts)


Chart 2: Perisai's monthly chart as at Oct 8, 2012_3.00pm_linear (Source: Quickcharts)


Chart 3: Perisai's monthly chart as at Oct 8, 2012_3.00pm_semilog (Source: Quickcharts)

Note:
In addition to the disclaimer in the preamble to my blog, I hereby confirm that I do not have any relevant interest in, or any interest in the acquisition or disposal of, Perisai.

CPO- a technical rebound for now

Recently, the Plantation Industries and Commodities Minister Tan Sri Bernard Dompok proposed a reduction in the export duties on CPO, from 23% to 8-10%. (For more, go here) There are a few reasons why the Minister made this proposal, chief among them are:
1. In response to an Indonesian move to levy export duty of about 13% on CPO. This Indonesian move resulted in a cross subsidy by its upstream producers to its downstream players. As a result, Indonesian refined products are more competitive via-a-vis the refined products from independent Malaysian producers. 
You may ask how did the Malaysian producers fail to compete when they have an indirect subsidy of 23%. The answer is simply because they can't get their hands on Malaysian CPO as most of it is exported under duty-free exemption. Malaysian currently produces 19 million tonnes of CPO, of which 12 million tonnes are consumed by refiners, 2 million tonnes used as cooking oil and the balance of 5 million tonnes are exported. Before the Indonesian move, independent Malaysian refiners can import in CPO from Indonesia and they can compete with the Indonesian refiners. Today, Malaysian refineries are reported to be suffering a negative margin of USD30-40 per tonne. (For more go here).
2. With CPO trading at below RM2500 per tonne, the government will not receive any windfall tax from plantation companies. This tax will only come into effect if CPO is above RM2500. The rate is 15% of any amount above RM2500 per tonne.
So the proposal to collect a lower 8-10% export duty coupled with the termination of duty-free export will lead to an export duty collection of RM1.125 billion (calculated as follows: 5 mil tonnes multiplied  by RM2500 per tonne and multiplied by 9%). Compared to the windfall tax of RM1.425 billion collectible if CPO were trading at RM3000 per tonne (calculated as follows: 19 mil tonnes multiplied  by RM500 per tonne and multiplied by 15%).
The proposed export duties reduction & termination of duty-free export should appease the refiners but it would come at the expense of upstream players. Among these are big plantation companies and small estate owners. With the election around the corner- where every vote counts- I doubt the government would move on the proposal any time soon.

There are two paragraphs in the recent newspaper article that I like to highlight:

1. Dompok also said the ministry would work on an incentive programme to encourage replanting of about 100,000 hectares of oil palm trees that were more than 35 years old. “This incentive will cut off about 300,000 tonnes of CPO in the market when the replanting scheme is put in place” he said.  
2. “We will also take a look back at the country's biofuel programme and will expedite the B5 programme to B10, doubling the biodiesel content utilised by the Government's agencies vehicles,” he added
These two points highlight the problem of oversupply of CPO, which was the essence of my earlier post. As such, the proposed export duties reduction in my opinion would not have any impact on CPO price for the medium-term. The CPO prices will be determined by the market forces and the market is wrestling with lower prices brought on by higher CPO output.