Wednesday, March 06, 2013

GASMSIA & IHH making new high

GASMSIA & IHH have both broken above their recent high of RM2.75 & RM3.48, respectively. The breakout for GASMSIA is more convincing since the share price is now at RM2.82- a good 7 sen above the previous high. IHH (at RM3.50) is only 2 sen above the previous high.

Based on these breakout, both GASMSIA & IHH could be trading BUY.


Chart 1: GASMSIA's daily chart as at Mar 6, 2013_4pm (Source: Quickcharts)


Chart 2: IHH's daily chart as at Mar 6, 2013_4pm (Source: Quickcharts)

Note:
In addition to the disclaimer in the preamble to my blog, I hereby confirm that I do not have any relevant interest in, or any interest in the acquisition or disposal of, GASMSIA & IHH.

Fitters- profit from property development starts to roll in

Results Update

For QE31/12/2012, Fitters's net profit rose 117% q-o-q or 43% y-o-y to RM10 million while revenue rose by 15% q-o-q or 6% y-o-y to RM114 million. The improved bottom-line was due to increase in sales of the LOFT service apartment in Zetapark, Setapak which was launched in November 2011.


Table 1: Fitters's last 8 quarterly results

From Table 2 below, we can see that Construction, Engineering & Property segment is the most important segment in the group, accounting for 83% of its pre-tax profit & 41% of its revenue. The bulk of the recent increased revenue & pre-tax profit came from its Zetapark project in Setapak where the estimated GDV is about RM600 million. For more on this, go here.

It is doubtful whether Fitters will be able to repeat this strong performance after the completion of the Zetapark project as it does not have any significant landbank besides the Setapak land. The only undeveloped land it has is a 20-acre agricultural land in Cameron Highland. Hopefully it can replenish its landbank during the interim period or its investment in renewal energy projects starts to show good results.


Table 2: Fitters''s Segmental Results for the past 4 years


Chart 1: Fitters's last 18 quarterly results

Financial Position

Fitters' financial position as at 31/12/2012 is deemed satisfactory. Its current ratio stood at 2.33 times while gearing ratio is low at 0.15 time. Cash in hand amounted to RM41 million.

Valuation

Fitters (closed at RM0.565 yesterday) is now trading at a PE of 4.4 times (based on last 4 quarters' EPS of 12.7 sen). At this PE, Fitters is deemed fairly attractive.

Technical Outlook

Fitters has been sliding for the past 18 months, dropping from a high of RM1.15 to the current price of about RM0.56-0.57. It has gone below the horizontal support of RM0.58, which happens to be the long-term uptrend line. Its technical outlook is negative.


Chart 2: Fitters's weekly chart as at Mar 6, 2013_12pm (Source: Quickcharts)

Conclusion

Based on good financial financial performance and attractive valuation, Fitters could be a stock for long-term investment. Despite these positive factors, Fitters may not attract much interest as the technical outlook is negative. However, for those who are stuck in this stock due to my earlier call, a slow accumulation at the present price may be a good idea.

Note:
In addition to the disclaimer in the preamble to my blog, I hereby confirm that I do not have any relevant interest in, or any interest in the acquisition or disposal of, Fitters.

Genting- breaks above the RM10 mark

Result Update

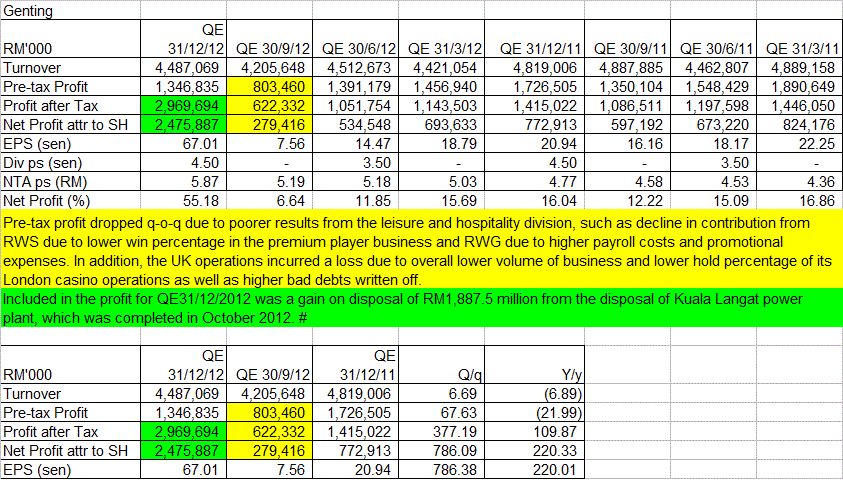
For QE31/12/2012, Genting's net profit rose nearly 8-fold q-o-q or more than 2-fold y-o-y to RM2.48 billion due to the exception gain of RM1.89 billion from the sale of the Kuala Langat power plant in October 2012. Pre-tax profit was however mixed- rose 68% q-o-q but dropped 22% y-o-y to RM1.35 billion. Revenue was similar mixed- rose 7% q-o-q but declined 7% y-o-y to RM4.49 billion.

Pre-tax profit dropped q-o-q due to poorer results from the leisure and hospitality division, such as decline in contribution from RWS due to lower win percentage in the premium player business and RWG due to higher payroll costs and promotional expenses. In addition, the UK operations incurred a loss due to overall lower volume of business and lower hold percentage of its London casino operations as well as higher bad debts written off.


Table: Genting's last 8 quarterly results


Chart 1: Genting's last 27quarterly results

Valuation

Genting (at RM10.00 as at 10.30am this morning) is trading at a PE of 17.5 times its adjusted full-year EPS of 57 sen (after excluding the exceptional gain from the sale of the Kuala Langat power plant). At this PE, Genting is deemed fully valued.

Technical Outlook

From Chart 2 below, Genting tested the resistance of RM9.90 posed by the line connecting its recent high. With  Genting currently at RM10.00, the stock has achieved an upside breakout that could signal the start of its recovery. If the stock can just stay above the RM10 mark, the previous bearish outlook for Genting (here) would have to be revised.


Chart 2: Genting's daily chart as at Mar 5, 2013 (Source: Tradesignum)


Chart 3: Genting's monthly chart as at Mar 5, 2013 (Source: Tradesignum)

Conclusion

Despite the challenging environment (with rampant proliferation of casinos everywhere), poorer financial results and demanding valuation, Genting is a stock for those with longer time horizon. Its technical outlook has improved and that may warrant a change in the rating for the stock from bearish to neutral. Further upgrade would depend on better financial performance and share price performance.

Note:
In addition to the disclaimer in the preamble to my blog, I hereby confirm that I do not have any relevant interest in, or any interest in the acquisition or disposal of, Genting.

JOBST- bottom-line dipped

Results Update

For QE31/12/2012, Jobst's revenue dropped q-o-q as a result of lower sales from JobStreet Essential due to seasonality factors. Pre-tax profit contracted by 15.4% q-o-q mainly due to the impact of lower sales from JobStreet Essential, higher marketing expenses, lower share of profits from associated companies and a lower increase in the fair value of the Group’s investments. The comparison of profitability between the two successive quarters will have to take into account significant one-off items such as the reversal of impairment loss on investment in an associate of RM4.1 million in QE31/12/2012 and the gain on dilution of interest in an associate of RM969k in QE30/9/2012.


Table: JOBST's last 8 quarterly results


Chart 1: JOBST's last 27 quarterly results

Valuation

JOBST (closed at RM2.58 yesterday) is now trading at a PE of 14 times (based on last 4 quarters' EPS of 18.25 sen). For a stock that has been growing at an CAGR of 25%, JOBST has a PEG ratio of 0.5 time, which is very attractive.

Can JOBST maintain its strong growth rate? From the article entitled "Jobstreet well positioned for regional growth" in the Edge this week, we learned that JOBST is now present in six of the largest markets in S.E.A. namely Malaysia, Singapore, the Philippines, Indonesia, Thailand & Vietnam. Besides Malaysia, it is the market leader in Singapore, Indonesia & the Philippines. With a population of 600 million and the rapid economic growth, ASEAN will be the focus of JOBST's regional expansion plan. As such, I feel strongly that JOBST will be able to maintain its strong growth.

Technical Outlook

JOBST broke above its horizontal resistance at RM2.40. It is now pressing against its next resistance at RM2.60.


Chart 2: JOBST's weekly chart as at Mar 4, 2013 (Source: Quickcharts)

Conclusion

Based on good financial performance (albeit a small decline in the past two quarters), attractive valuation & positive technical outlook, JOBST remains a good stock for long-term investment.

Note:
In addition to the disclaimer in the preamble to my blog, I hereby confirm that I do not have any relevant interest in, or any interest in the acquisition or disposal of, CCM.

Deleum- an attractive O&G stock poised to go

Background
Deleum Bhd is involved in the following business:


- Power and Machinery
- Oilfield Services
- Maintenance, Repair and Overhaul

Power and Machinery segment contributed 94% & 80% of the group's pre-tax profit & revenue, respectively for FY2012.


Recent Financial Results

For QE31/12/2012, Deleum's net profit increased by 11% q-o-q or 87% y-o-y to RM13.5 million while its revenue rose by 25% q-o-q or 46% y-o-y to RM155 million. Bottom-line improved due to Power and Machinery segment recording a RM6.5 million increase in pre-tax profit to RM21.3 million. This is due mainly to retrofit projects and higher dispatch of valves and regulators during the currentquarter on the back of increased exploration and production activities.

The improved results for Power and Machinery segment had more than offset the losses incurred by the Oilfield Services segment of RM1.5 million & by Maintenance, Repair and Overhaul segment of RM0.6 million.


Table: Deleum's last 8 quarterly results


Chart 1: Deleum's last 25 quarterly results

Financial Position

Deleum's financial position is deemed satisfactory as at 31/12/2012. Its current ratio stood at 1.7 times while gearing ratio was negligible at 0.08 time. Cash reserves stood at RM81 million or cash per share of 54 sen.

Valuation

Deleum (closed at RM2.04 yesterday) is now trading at a PE of 6.8 times (based on EPS of 29.8 sen for FY2012). At this PE, Deleum is deemed attractive.

Technical Outlook

deleum has just broken above the horizontal-cum-psychological resistance of RM2.00. While this breakout, the stock may march to its next resistance at RM2.25.


Chart 2: DEleum's weekly chart as at Mar 4, 2013 (Source: Quickcharts)

Conclusion

Based on good financial performance & position, attractive valuation & positive technical outlook, Deleum is good stock for trading BUy or long-term investment.

Note:
In addition to the disclaimer in the preamble to my blog, I hereby confirm that I do not have any relevant interest in, or any interest in the acquisition or disposal of, Deleum.

Tuesday, March 05, 2013

CCM- a nascent recovery play?


Results Update

For QE31/12/2012, CCM's net profit increased by 120% q-o-q or 91% y-o-y to RM18 million while revenue was mixed - rose 1% q-o-q but dropped 6% y-o-y - to RM378 million. Revenue dropped q-o-q due to lower revenue contribution from the Chemicals and Fertilizers Divisions. Bottom-line improved due to due to improvement in gross profit margins across the Divisions; operational cost reduction in Chemicals and Fertilizers Divisions; and recognition of change in fair value of investment properties of RM7.4 million.

The management continues to remain cautious and expect the challenging operating environment ahead.


Table: CCM's last 8 quarterly results


Chart 1: CCM's last 28 quarterly results

Valuation

CCM (closed at RM1.02 today) is now trading at a PE of 11.5 times (based on last 4 quarters' EPS of 8.9 sen). At this PE multiple, CCM is deemed fairly valued.

Technical Outlook

CCM's long years in the wilderness was noted in my previous post entitled CCM- a 6-year decline!. From the chart below, we can see that irregular downward channel (Rx-Rx, Sx-Sx) which guided the share price lower. In its deeply oversold position, the stock could stage a rebound that could recoup some of its lost ground. It is too hopeful to expect the share price to rise up to Rx-Rx but a recovery to R1-R1 is not too far-fetch.


Chart 2: CCM's weekly chart as at Mar 4, 2013 (Source: Tradesignum)

Conclusion

Based on challenging operating environment & unexciting financial performance, the only argument to but CCM is that it is deeply oversold.

Note:
In addition to the disclaimer in the preamble to my blog, I hereby confirm that I do not have any relevant interest in, or any interest in the acquisition or disposal of, CCM.

Property index may have a breakout

Shanghai's SSEC dropped 3% yesterday on announcement of new measures by Chinese authority to curb property speculation (here). This followed similar measures announced by Hong Kong in February (here) and in Singapore in January (here). With no new measure being introduced, property speculators will set their sight on Malaysia (here). Already, we have seen numerous deals announced in Johor (especially around Iskandar Waterfront). Slowly but surely, Malaysian property scene is coming back to live.

From the chart below, we can see that the Property index has just broken above the horizontal resistance at 1100 and it is set to test its January 2011 high of 1159. The upside breakout of the Property index means that property stocks could be good trading BUY. These include stocks with exposure in Iskandar & Nusantara, such as UEMLand and Tebrau, as well as those with landbank in Pengerang, such as MPHB. The Property theme play may spread to other property counters, such as Sunway & IJMland (which had a successful launch over the weekend in its latest township project, Rimbayu).


Chart 1: Property index's weekly chart as at Mar 5, 2013_3pm (Source: Quickcharts)

The other lagging sector on our exchange - Construction - may also benefit from the pick-up in Property sector as well as more large scale construction projects in the pipeline, such as the high-speed train connecting KL-Singapore, West Coast highway, more power plants and another 2 MRT tracks. However, from the chart below, we can see that the Construction index is still in a downtrend and until it has achieved a breakout, we cannot expect a broad-based rally among Construction stocks. For those with long-term investment horizon and who can stomach sharp drop in share price, some construction stocks to consider are Gamuda, Mudajaya & MRCB.


Chart 2: Construction index's weekly chart as at Mar 5, 2013_3pm (Source: Quickcharts)

Monday, March 04, 2013

MBSB- uptrend to continue

MBSB broke above its horizontal resistance at RM2.48 today. With this upside breakout, the stock may continue its uptrend. Its next target could be RM2.75-2.80.

As such, MBSB could be a good trading BUY.


Chart: MBSB's daily chart as at March 4, 2013_12.15pm (Source: quickcharts)

For more on MBSB, go here.

Note: 
In addition to the disclaimer in the preamble to my blog, I hereby confirm that I do not have any relevant interest in, or any interest in the acquisition or disposal of, MBSB.

Friday, March 01, 2013

Sunway- an attractive construction-based group

 Background

Sunway Bhd is involved in the following businesses:
- Integrated Properties
- Construction
- Trading & Manufacturing
- Quarrying
- Building material
- Healthcare
It is the result of the merger between Sunway Holdings Inc. Bhd & Sunway City Bhd which was completed in early 2011.

Recent Financial Results

For QE31/12/2012, Sunway's net profit increased by 133% q-o-q or 55% y-o-y to RM219 million while revenue increased by 38% q-o-q or 30% y-o-y to RM1.2 billion. Its running net profit & revenue for the past 4 quarter to QE31/12/2012 amounted to RM532 million & RM3.88 billion, respectively. This compared favorably with the preceding 4-quarter net profit & revenue of RM388 million & RM3.69 billion,, respectively.


Table 1: Sunway's last 8 quarterly results


Chart 1: Sunway's last 8 quarterly results

Financial Position

Sunway's financial position as at 31/12/2012 is deemed fair, with current ratio at 1.58 times and gearing ratio at 0.82 time.

Valuation

Sunway (at RM2.57) is trading at a PE of 6.25 times (when compared to the last 4 quarters' EPS of 41.14 sen). This compared favorably to construction-based groups such as Gamuda, IJM & WCT. If you look at the table below, you will see that only WCT with a such a low PE. The reason for WCT's low PE is that its recent net profit was boosted by a fair value gain of RM218 million. If this exceptional item is excluded, WCT's 4-quarters' EPS was dropped to 14.7 sen & its PE ratio would rise up to 15.2 times. Thus, Sunway looks fairly attractive.


Table 2: Sunway & other construction stocks compared

Technical Outlook

Sunway has broken above its strong horizontal resistance at RM2.46 a few days ago. It is now testing its next resistance at RM2.57.


Chart 2: Sunway's weekly chart as at Mar 1, 2013_12.20pm (Source: quickcharts)

Conclusion

Based on good financial performance, reasonably healthy financial position, attractive valuation & positive technical outlook, Sunway is rated a good stock for long-term investment.

Note: 
In addition to the disclaimer in the preamble to my blog, I hereby confirm that I do not have any relevant interest in, or any interest in the acquisition or disposal of, Sunway.

Tuesday, February 26, 2013

Willow- exciting times ahead?


Background

Willowglen MSC Bhd ("Willow") is involved in the research, development & supply of computer-based control systems (aka SCADA). Its systems can cater for a wide range of applications in key areas such as water management industry, oil & gas pipeline systems public utility systems & integrated monitoring systems. Its main market continues to be Singapore and Malaysia while its Indonesia operations are at development stage where it focuses in providing SCADA and security solutions to the data centers, utilities and building facilities industries. 

Recent Financial Results

For QE31/12/2012, Willow's net profit increased by 44% q-o-q or 63% y-o-y to RM6.0 million while revenue increased by 22% q-o-q or 74% y-o-y to RM27 million. It expects sales to improve further in FY2013 due to the growing demand for SCADA and security solutions in the transportation, oil and gas, water and waste-water industries and security of buildings and high end condominiums.


Table: Willow's last 8 quarterly results


Chart 1: Willlow's last 29 quarterly results

Financial Position

Willow's financial position as at 31/12/2012 is deemed satisfactory. It has no bank borrowings but instead it had cash in hand of RM31 million (or, 12 sen per share). The bulk of its assets are tied down in debtors (comprising amount owing by contract customers of RM26 million and trade debtors of RM17 million). While compared to its annual revenue of RM83 million, the debtors collection period is rather high at 189 days. Since the bulk of this receivable is due to contract customers, the high collection period could be the industrial practice which the company has to abide to.

Valuation

Willow (closed at RM0.37) is now trading at a PE of 5.9 times (based on last 4 quarters' EPS of 6.32 sen). At this PE multiple, Willow is deemed fairly valued for a small cap, with potential for sales growth in the future.

Technical Outlook

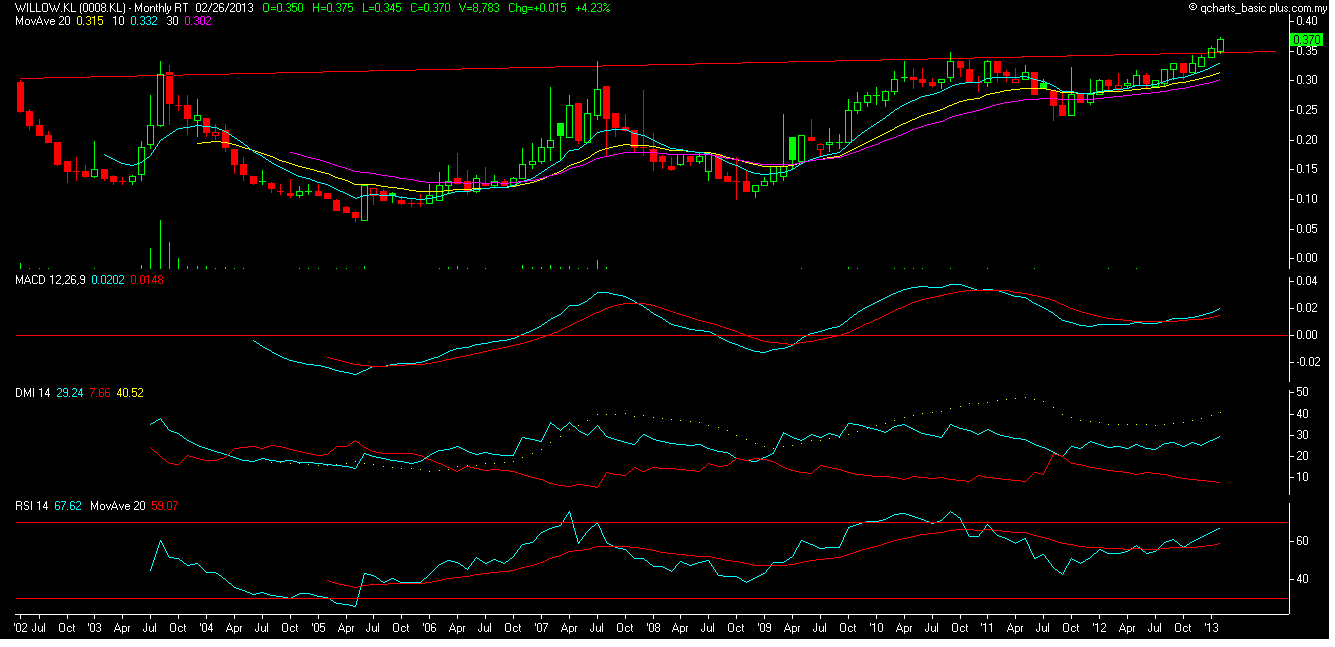
Willow seems to have broken above the resistance posed by the line connecting its peaks over the past 10 years. This upside breakout could signal the beginning of the next upleg for the stock.


Chart 2: Willow's monthly chart as at Feb 26, 2013_11am (Source: quickcharts)

Conclusion

Based on good financial performance, positive future sales growth outlook, satisfactory financial position & positive technical outlook, Willow could be a good stock for long-term investment.

Note: 
In addition to the disclaimer in the preamble to my blog, I hereby confirm that I do not have any relevant interest in, or any interest in the acquisition or disposal of, Willow.

Monday, February 25, 2013

QL's net profit declined q-o-q

Results Update

For QE31/12/2012, QL's net profit dropped 14% q-o-q or 8% y-o-y to RM31.5 million while revenue was mixed- dropped 3% q-o-q but rose 8% y-o-y to RM537 million. The q-o-q decline in bottom-line was due to poorer results from the Integrated Livestock segment where revenue dropped RM31 million while pre-tax profit dropped by RM9 million. This had more than off-set the increase in revenue & pre-tax profit from the Palm Oil segment of RM15 million & RM2 million, respectively.


Table: QL's last 8 quarterly results


Chart 1: QL's last 19 quarterly results

Valuation

QL (closed at RM3.00 this morning) is now trading at a PE of 19 times (based on last 4 quarters' EPS of 15.83 sen). Based on this PE multiple, QL is deemed overvalued.

Technical Outlook

QL is now trading sideway, with horizontal support at RM3.00. Overhead resistance is at RM3.25.


Chart 2: QL's weekly chart as at Feb 22, 2013 (Source: quickcharts)

Conclusion

Based on weaker financial performance, unattractive valuation & unexciting technical outlook, QL is rated a REDUCE.

Note: 
In addition to the disclaimer in the preamble to my blog, I hereby confirm that I do not have any relevant interest in, or any interest in the acquisition or disposal of, QL.

Tuesday, February 19, 2013

Market Outlook as at February 19, 2013

FBMKLCI tested its long-term uptrend line, S-S2 two weeks ago. In its current weak state, I won't be surprised if it were to re-test this uptrend again soon. While the index will have good support at the long-term uptrend line, S-S2 (at 1605) as well as the strong horizontal support of 1600, there is little catalyst for a rebound. In fact, this market rally which began in early 2009 is approaching its 4-year mark. With an impending general election around the corner, more & more investors chose to reduce their exposure in the market.

If the selling persists and FBMKLCI breaks below the 1600 mark, it could easily go down to the 1500 mark. When FBMKLCI broke its then long-term uptrend line, S-S1 was in July 2011, the index lost 16% from the breakdown level of 1565 to the low of 1310. A similar 16%-drop today would translate to a low of 1350! I have appended the weekly chart of FBMKLCI and the close-up below.


Chart 1: FBMKLCI's weekly chart as at Feb 19, 2013_3.00pm (Source: Quickcharts)


Chart 1: FBMKLCI's weekly chart as at Feb 19, 2013_a close-up (Source: Quickcharts)

Based on the above, it is prudent to stay on the sideline until the dust has settled or until lower prices are offered.

Monday, February 18, 2013

CPO prices likely to stay weak

CPO slid last week on reports that a smaller-than-expected decline in stockpile (go here and here). From the chart, I expect CPO prices to test the support from the long-term downtrend line, R-R1 which coincides with the support from the medium-term uptrend line, S2-S2, at RM2400. A rebound from this support level is expected, though the rebound may be muted (probably falling short of the psychological RM2500 level). A break below RM2400 level (whether on first test or subsequent test) would send CPO prices to the recent low of RM2300. We will have to wait & see whether CPO prices can find support at this level; thus, forming a base for this commodity.

Despite the seasonally lower output, reduction in export duties for CPO and proposed Biodiesel 10% blend in 2014, CPO prices are still adrift. This is a sign that the supply of CPO is more than its demand and the market forces at work seeks to find an equilibrium at a lower clearing price. I expect this weak prices for CPO to persist for a while.


Chart: CPO's weekly price as at Feb 15, 2013 (Source: iFSmarketcenter.com)

Friday, February 08, 2013

Happy New Year!

Wish all my Chinese readers a Happy New Year! GONG XI FA CAI!


(Source: Creativity Window)

Thursday, February 07, 2013

Digi- Bottom-line slid further


Results Update

For QE31/12/2012, Digi's net profit dropped by 22% q-o-q or 37% y-o-y to RM246 million while revenue increased by 3% q-o-q or 5% y-o-y to RM1.63 billion. The decline in net profit q-o-q basis was attributed to higher accelerated depreciation from network modernization, which was partially off-set by lower operating costs incurred from the Group’s continued cost optimization focus.


Table: Digi's last 8 quarterly results

However, if you look at Chart 1 below, we can see that Digi's bottom-line has been flattish for 5 years. This is due to a steady slide in its profit margin- with pre-tax profit margin dropping from 33% to 22% & net profit margin sliding from 25% to 15% from QE31/12/2007 to QE31/12/2012.


Chart 1: Digi's last 21 quarterly results

Valuation

Digi (closed at RM4.66 yesterday) is now trading at a PE of 30 times (based on last 4 quarters' EPS of 15.51 sen). At this multiple, Digi is deemed overvalued.

Technical Outlook

From the chart below, it seems that Digi has made a temporary top. Its immediate support is at the horizontal line at RM4.60. The next support is at the horizontal line at RM4.00.


Chart 2: Digi's weekly chart as at Feb 6, 2013 (Source: quickcharts)

Conclusion

Based on the decline in its financial performance, unattractive valuation & negative technical outlook, Digi is rated a SELL.

Note: 
In addition to the disclaimer in the preamble to my blog, I hereby confirm that I do not have any relevant interest in, or any interest in the acquisition or disposal of, Digi.

Market Outlook as at February 6, 2013

FBMKLCI is testing the important psychological 1600 mark. This level is also the support of the uptrend line, S-S2. If the index breaks below this critical support, it may see a drop similar to July 2011 with FBMKLCI possibly traveling down as far as the rising "horizontal" line AB, presently at 1400.


Chart 1: FBMKLCI's weekly chart as at February 6, 2013 (Source: Quickcharts)

The same pattern is seen in the FBMEmas chart. Here the index has marginally broken below the important psychological 11000 mark which happens to be the uptrend line, S-S2. If there is no recovery in FBMEmas, this index may travel down to test the rising "horizontal" line, AB at 10000.


Chart 1: FBMEmas's weekly chart as at February 6, 2013 (Source: Quickcharts)


This is a critical juncture in the market, which has been weighed down by the fear of an impending General Election and aggravated by the upcoming 2-day break for the Chinese New Year. Can the FBMKLCI stay above the 1600 (or the FBMEmas stays above the 11000 mark? To paraphrase Thomas Paine, these are the days that try the investors' souls (for the original article, go here or here).

Monday, February 04, 2013

PWRoot- pre-tax profit & revenue inched higher

Results Update

For QE30/11/2012, PWRoot's net profit dropped 7% q-o-q but rose 84% y-o-y to RM8.5 million while revenue increased by 12% q-o-q or 26% y-o-y to RM70 million. The decline in net profit q-o-q was due to a deferred tax charge of RM2.1 million. Notwithstanding the drop in net profit, it is encouraging to note that pre-tax profit increased by 11% q-o-q or 108% y-o-y to RM12.6 million (despite a smaller gain of sale of property of RM1.3 million as compared to RM2.1 million in QE31/8/2012). The improved pre-tax profit was due to increased revenue (from increased sales, domestically & overseas).


Table: PWRoot's last 8 quarterly results


Chart 1: PWRoot's last 23 quarterly results

Financial Position

PWRoot's financial position as at 30/11/2012 is deemed healthy. Its current ratio stood at 2.9 times while gearing is negligible at 0.06 time. A look at the current assets revealed that it has receivables of RM100 million or a receivable turnover of 135 days (compared to revenue of RM203 million for the 9-month ended 30/11/2012). This is compared to a receivable turnover of 135 days experienced by Oldtown (where its receivable as at 30/9/2012 stood at RM48 million while revenue from Beverage operation for 9-month period amounted to RM98 million). As such, I believe PWRoot's receivable is within industrial average & its financial position is deemed satisfactory.

Valuation

PWRoot (closed at RM1.20 last Thursday) is now trading at a PE of 12 times (based on last 4 quarters' EPS of  9.90 sen). If the gain from property disposal of RM3.4 million is excluded, the PE would be about 13 times. Previously, I have rated PWRoot as fairly valued (go here).

However, if we take into account its strong earning growth of about 70% (even after excluding gain from property disposal), PWRoot's  PEG ratio is about 0.2 time. If the strong growth tapered off (say, to 25%), the PEG ratio will still be fairly comfortable (at about 0.5 time). As such, I like to revise my previous take on its valuation to be under valued.

Technical outlook

PWRoot is in an uptrend, with immediate horizontal support at  RM1.05.


Chart 2: PWRoot's weekly chart as at Jan 31, 2013 (Source: quickcharts)

Conclusion

Based on good financial performance, attractive valuation & positive technical outlook, PWRoot remains a good stock for long-term investment.

Note: 
In addition to the disclaimer in the preamble to my blog, I hereby confirm that I do not have any relevant interest in, or any interest in the acquisition or disposal of, PWRoot.

Spritzr- bottom-line crept higher

Results Update

For QE30/11/2012, Spritzr's net profit increased by 63% q-o-q or 54% y-o-y to RM5.1 million while revenue was mixed- dropped 2% q-o-q but rose 4% y-o-y to RM47 million. Despite 2%-drop in revenue, bottom-line improved due to the reduction in packaging material prices as well as selling and distribution expenses.


Table: Spritzr's last 8 quarterly results


Chart 1: Spritzr's last 26 quarterly results

Valuation

Spritzr (closed at RM1.00 on last Thursday) is now trading at a PE of 9.3 times (based on last 4 quarters' EPS of 10.69 sen). For a stable consumer stock, Spritzr's valuation is deemed quite attractive.

Technical Outlook

Spritzr seems to have broken above its downtrend line at RM0.90 in December 2012. With this breakout, the stock could continue with its prior uptrend and retest its previous high at RM1.20-1.30.


Chart 2: Spritzr's monthly chart as at Jan 31, 2013 (Source: Tradesignum)

Conclusion

Based on good financial performance, attractive valuation & positive technical outlook, Spritzr is a good stock for ling-term investment.

Note: 
In addition to the disclaimer in the preamble to my blog, I hereby confirm that I do not have any relevant interest in, or any interest in the acquisition or disposal of, Spritzr.

MBSB- bottom-line soared

Results Update

For QE31/12/2012, MBSB's net profit increased by 104% q-o-q or 119% y-o-y to RM184 million while revenue was mixed- dropped by 6% q-o-q but rose by 40% y-o-y- to RM487 million. Pre-tax profit increased q-o-q due to higher income from Islamic banking operations, higher other operating income & lower allowance for impairment losses on loans, advances & financing. This was partially offset by higher other operating expenses. Net Profit jumped q-o-q due to over-provision for taxation for prior years of RM21.9 million. Interestingly, MBSB provided for under-provision for taxation for prior years of RM22.3 million for QE30/9/2012.


Table: MBSB's last 8 quarterly results


Chart 1: MBSB's last 34 quarterly results

Valuation

MBSB (closed at RM2.26 last Thursday) is trading at a gross PE of 6.2 times (based on gross EPS for the last 4 quarters of 36.74 sen). After including the 503 million warrants outstanding, the net EPS would be about 26 sen. This would give us a net PE of 8.7 times. Overall, MBSB is deemed quite attractive.

Technical Outlook

The stock is still in an uptrend. It is resting on the 40-week EMA line & horizontal line at RM2.20.


Chart 2: MBSB's weekly chart as at Jan 31, 2013 (Source: quickcharts)

Conclusion

Based on good financial performance, attractive valuation & positive technical outlook, MBSB is rated a good stock for long-term investment.

Note: 
In addition to the disclaimer in the preamble to my blog, I hereby confirm that I do not have any relevant interest in, or any interest in the acquisition or disposal of, MBSB.