Yesterday, Takaful broke above its recent high of RM6.33 (see Chart 1). It gained 55 sen to close at RM6.97. With this breakout above its all-time high, Takaful is expected to continue with its uptrend. However, when you look at the long-term chart of Takaful (see Chart 2), you can see that the share price had risen by more than four-fold in the past 2 years, from RM1.50 to RM6.97 yesterday. Can this rally sustain?
Takaful's financial performance has improved sharply in
FY2012. Its net profit rose from RM77 million to RM101 million while revenue soared to RM1.61 billion from RM1.35 billion previously. Its EPS increased from 47 sen to 62 sen. [Note: Takaful's net profit for FY2010 was RM61 million while its revenue was RM1.73 billion.]
At the close of RM6.97, Takaful is now trading at a PE of 11 times, which is fairly attractively. Its Price to Book is relatively high at 2.3 times (based on Net Assets p.s. of RM3.07 as at 31/12/2012) but can be justified due to strong earning growth. OSK has a report on Takaful which placed the target price for the stock at RM8.00 (via
i3investor.com).
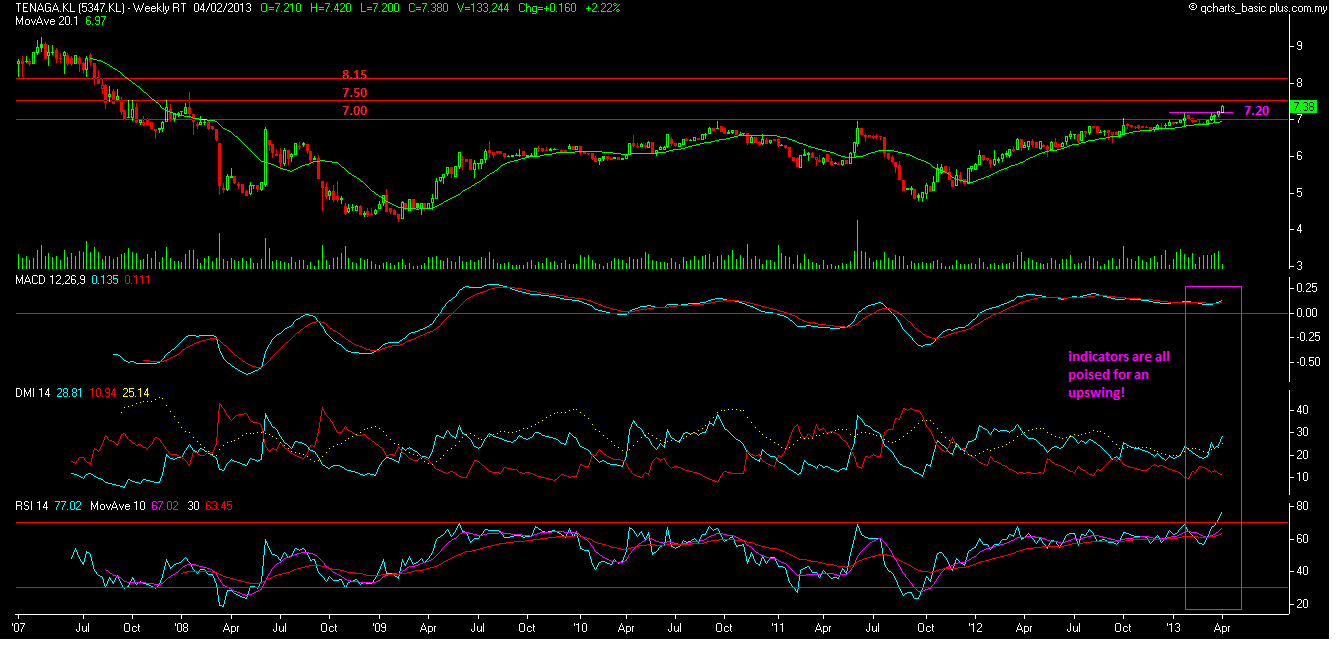
 Chart 1: Takaful's weekly chart as at Mar 19, 2013 (Source: Quickcharts)
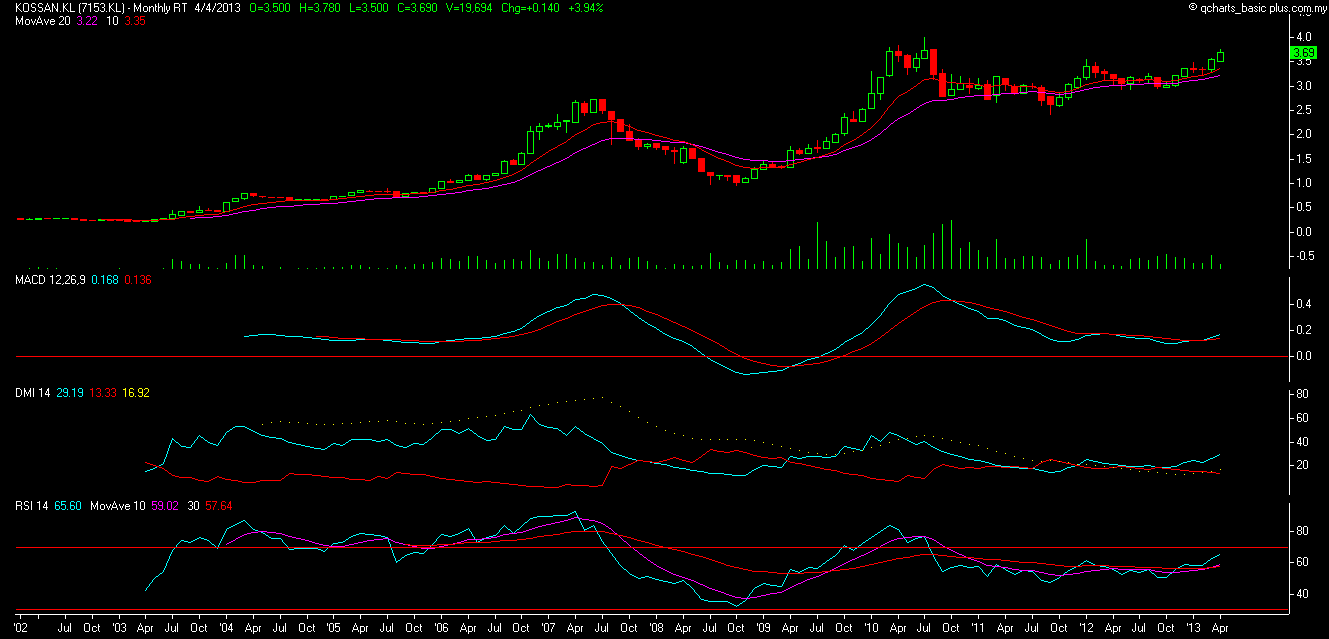
 Chart 2: Takaful's monthly chart as at Mar 18, 2013 (Source: Tradesignum)
The alternative to Takaful- a relatively small stock with outstanding share issue of 162.8 million shares-
is its holding company, BIMB. BIMB -with an outstanding share issue of 1.07
billion shares- tends to follows in the same trajectory as Takaful. As
noted previously, the time lag between an upside move for Takaful & a
similar move by BIMB is about 1.5 months. This time lag may have
widened to 2 months.
BIMB's financial performance has also improved over the past few years. For FY2012, BIMB's net profit rose from RM212 million to RM251 million while revenue rose from RM2.04 billion to RM2.52 billion. For more, go
here.
At a close of RM3.31 yesterday, BIMB is now trading at a PE of 14 times (based on FY2012 EPS of 23.5 sen) or at a Price to Book of 1.8 times (based on Net Assets p.s. of RM1.89 as at 31/12/2012). While BIMB's PB ratio is lower than Takaful's, its PE ratio is higher. Its earning growth is slower than Takaful's.
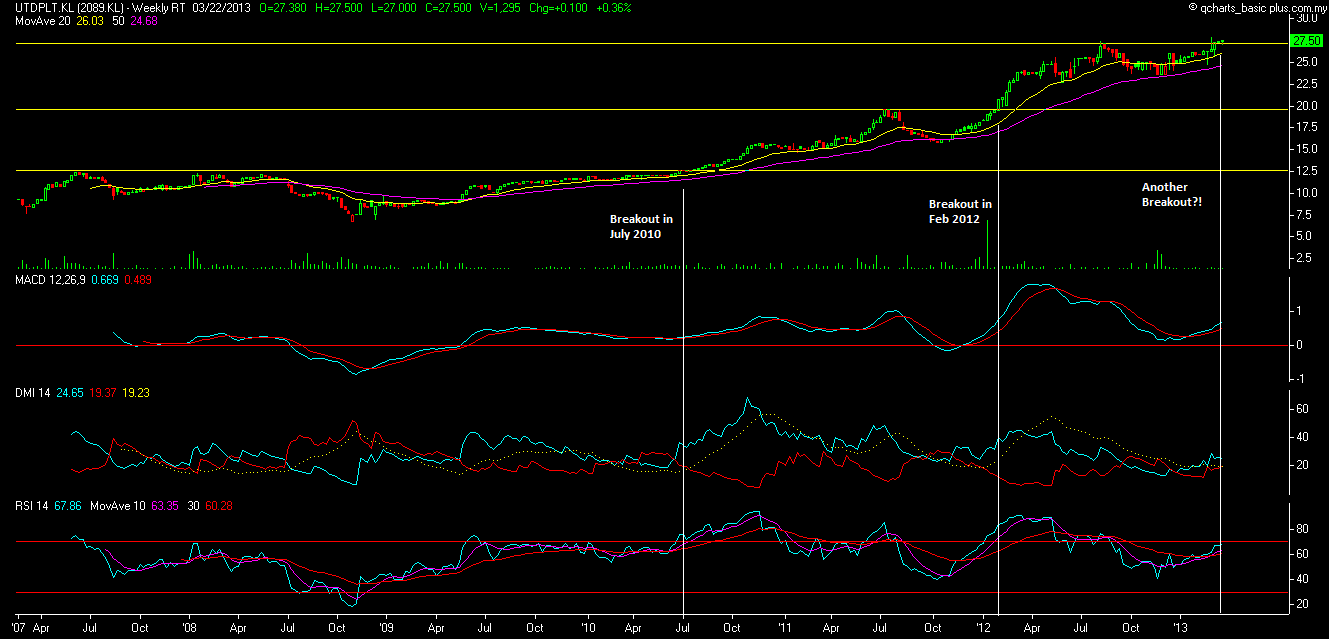
 Chart 3: Takaful & BIMB''s weekly chart as at Mar 19, 2013 (Source: Quickcharts)
Based on the above, Takaful could be a good trading BUY. For those with lower risk tolerance, you may consider BIMB which may follow in the upside move after a short delay.
Note:
In
addition to the disclaimer in the preamble to my blog, I hereby confirm
that I do not have any relevant interest in, or any interest in
the acquisition or disposal of, Takaful & BIMB.