Thursday, April 18, 2013

Market Outlook as at April 18, 2013

FBMKLCI has managed to stay above the 1700 level for the past few days (see Chart 1). If FBMKLCI can stay above its previous all-time high, then the market may continue its uptrend. In July 2011, FBMKLCI broke above its then all-time high of 1573 (denoted as 'A' on Chart 2) but it failed to stay above its breakout level and succumbed to profit-taking.


Chart 1: FBMKLCI's daily chart as at Apr 18, 2012_3.30pm (Source: Quickcharts)


Chart 2: FBMKLCI's weekly chart as at Apr 18, 2012_3.30pm (Source: Quickcharts)

Besides the Property index, three other sectoral indices have broken above their previous all-time high. These indices are Trading Services (due in part to a strong move by Tenaga), Finance and Consumer. I am encouraged that the upside breakout in FBMKLCI is accompanied by similar breakout in Trading Services and Finance indices. We will have to wait for a short while longer to see whether the market can continue its uptrend.


Chart 3: Trad Serv's weekly chart as at Apr 17, 2012  (Source: Quickcharts)


Chart 4: Finance's weekly chart as at Apr 17, 2012  (Source: Quickcharts)


Chart 5: Consumers weekly chart as at Apr 17, 2012  (Source: Quickcharts)

The consumer sector has continued to rise, driven by rising income & consumption. However, many of the blue chips in that sector are trading at high PE multiples. The recent profit-taking in the consumer sector in the US is a sign that smart moneys are not impervious to taking some chips off the table when stocks trade at high PE multiples. A report in Clusterstock noted that Buffet, Paulson & Soros had reduced their exposure to consumer stocks, probably betting that US consumers may not have the spending power to drive earning higher. Would the same thing happen to Malaysian consumers? Among the Malaysian consumer stocks, I prefer YeeLee (or, Spritzr).

Finally, I like to note that the ability of our index to stay above the 1700 mark is quite commendable, given the uncertainty in the upcoming General Election as well as the developing risk-off trade which has sent many equity market swooning as well as flooring almost the entire commodity asset class. In view of the increased volatility (and more to come), we should exercise careful discretion in this market.

CPO- downtrend to continue

CPO broke below its strong horizontal support of RM2370. With the Bollinger Band expanding, CPO is expected to drop further. The next support would be RM2200 & then the psychological RM2000 mark.


Chart 1: CPO's weekly chart as at April 17, 2013 (Source: ifs.marketcenter)

The decline in CPO is in line with the drop in the prices of commodities in general. The Reuters/Jefferies CRB index has breached its strong horizontal support at 292 and it is now at 280. It may revisit its 2012 low of 267.


Chart 2: CRB index's weekly chart as at April 17, 2013 (Source: Stockcharts)

Crude Oil prices (as per WTIC) has similarly broken to the downside of its "symmetrical triangle" this week.


Chart 3: WTIC index's weekly chart as at April 17, 2013 (Source: Stockcharts)

Based on the above, I expect further weakness ahead for CPO prices and plantation stocks.

Tuesday, April 16, 2013

SBC- broke above its strong resistance at RM1.20

SBC has just broken above its strong resistance at RM1.20. Its potential target is RM1.50-1.60. Based on technical breakout, SBC could be a good trading BUY.


Chart: SBC's weekly chart as at April 16, 2013_3.50pm (Source: quickcharts)

Please exercise careful discretion in all your trades given the increased volatility that comes with the present tense political situation as well as recent sharp drop in commodities that might migrate to other asset classes.

Note:
In addition to the disclaimer in the preamble to my blog, I hereby confirm that I do not have any relevant interest in, or any interest in the acquisition or disposal of, SBC.

Monday, April 15, 2013

Gold broke its strong support

Gold broke below its strong horizontal support at USD1530-1550 last Friday. With this breakdown, gold has turned bearish. Its next support would be the parallel line to the current downtrend line at USD1450- coinciding with the horizontal support at USD1440.


Chart 1: Gold's daily chart as at April 12, 2013 (Source: Stockcharts)


Chart 2: Gold's weekly chart as at April 12, 2013 (Source: Stockcharts)

The other precious metal, Silver also dropped last Friday but it managed to stay above the strong horizontal support of USD25.


Chart 3: Silver's weekly chart as at April 12, 2013 (Source: Stockcharts)

The decline in the price of precious metal is in line with the decline in the prices of commodities in general (see the Reuters/Jefferies CRB index below). What happens to the idea of gold as a safe haven asset in a world of easy money? I guess we will have to wait & see.


Chart 4: CRB's weekly chart as at April 12, 2013 (Source: Stockcharts)

Friday, April 12, 2013

Market Outlook as at April 12, 2013

FBMKLCI has broken above the all-time high of 1700 recorded in January. As noted before, FBMKLCI is moving within an expanding triangle (ABCD), with immediate resistance at 1730.


Chart 1: FBMKLCI's daily chart as at April 12, 2013_9.30am (Source: Qucickharts)

From the weekly chart, we can see that FBMKLCI is in a long-term uptrend, SS while its upside for the past 2 years have been capped by the line connecting its peaks, RR. That line is likely to again act as a cap for the current rally by limiting the upside to 1720-1730. A breakout of the 1730 could free the index for a steep trajectory.


Chart 2: FBMKLCI's weekly chart as at April 12, 2013_9.30am (Source: Qucickharts)

Thursday, April 11, 2013

OSK may have a bullish breakout

OSK has just broken above its strong horizontal resistance at RM1.50 (see the daily chart). This level is also the resistance of its intermediate downtrend line (see weekly chart). With this breakout, OSK could rise to test its next resistance at either RM1.65 or RM1.70.

Based on technical breakout, OSK could be a good trading BUY.


Chart 1: OSK's daily chart as at Apr 11, 2013_12.15pm (Source: Quickcharts)


Chart 2: OSK's weekly chart as at Apr 11, 2013_12.15pm (Source: Quickcharts)

Note:
In addition to the disclaimer in the preamble to my blog, I hereby confirm that I do not have any relevant interest in, or any interest in the acquisition or disposal of, OSK.


Multico broke above its horizontal line RM1.60

Technical Breakout

Multico just broke above its horizontal line at RM1.60. With this breakout, it may revisit its high in 2007 of RM1.78.


Chart 1: Multico's daily chart as at Apr 11, 2013_12.20pm (Source: Quickcharts)


Chart 2: Multico's weekly chart as at Apr 11, 2013_12.20pm (Source: Quickcharts)

Background

Multico is involved in the manufacturing of electronics parts and accessories for the automotive industries.For more on this company, go here.

Recent Financial Result

Multico's financial performance is satisfactory in the past 3 quarters. For QE31/1/2013, Multico's net profit increased by 8% q-o-q or 56% y-o-y to RM3.4 million while revenue was mixed- down 9% q-o-q but increased by 7% y-o-y to RM27 million.


Table: Multico's last 8 quarterly results


Chart 3: Multico's last 22 quarterly results

Valuation

At RM1.67, Multico is trading at a PE of 6 times (based on last 4-quarter's EPS of 27.6 sen. For a smallcap, Multico is deemed fairly valued.

Conclusion

Based on good financial performance, reasonable valuation & bullish technical bbreakout, Multico could be a good trading BUY.

Note:
In addition to the disclaimer in the preamble to my blog, I hereby confirm that I do not have any relevant interest in, or any interest in the acquisition or disposal of, Multico.

Wednesday, April 10, 2013

MAS- taking flight?


MAS has broken above its intermediate downtrend line at RM0.75 a few days ago. It has now surpassed its horizontal resistance at RM0.78-0.80. With these double breakouts, it is poised to test its next resistance at the psychological RM1.00 mark.


Chart 1: MAS's daily chart as at April 10, 2013_9.30am (Source: Quickcharts)

Is this an uptrend as reported by the Star this morning? I am afraid it is too early to call for an uptrend. MAS is still in a long-term downtrend and the current move is a 'corrective' move within a long-term downtrend.


Chart 2: MAS's weekly chart as at April 10, 2013_9.30am (Source: Quickcharts)

Based on the above, you may choose to trade on this stock. Do exercise careful discretion in term of trading position and always maintain a protective stop. A break below RM0.78 should be a good protective stop.

Note:
In addition to the disclaimer in the preamble to my blog, I hereby confirm that I do not have any relevant interest in, or any interest in the acquisition or disposal of, MAS.

Bitcoin or Gold?

The recent bail-in in Cyrus- where bank depositors were required to shoulder losses incurred by the banks- had enraged & frightened many depositors in Europe (here). No longer are depositors being subjected to mere stealthy losses in the form of constant under-measured inflation, they are now being robbed in the broad daylight.

One of the surprising outcome of that sad episode (or, was it just a coincidence?) is the sudden flight of depositors' money to a virtual currency, Bitcoin. Now, I know many readers may not be familiar with this modern invention. In fact, no one knows who invented Bitcoin. To read up on it, go here.

Henry Blodget, the Editor-in-chief of Clusterstock, half-jokingly put a price target of USD400 for a bitcoin (closed at USD191 as at April 8). He explained that it is entirely possible why Bitcoin to be a perfect bubble because it has four 'good' attributes, namely:


  • A good underlying story.
  • A sexy "new-ness" that requires some work to understand.
  • A small and finite supply. A fundamental "value" that is highly subjective and, therefore, justifiable at almost any level.
  • A high level of risk and excitement associated with trading it.


  • Timothy B. Lee- a contributor to Forbes & an associate writer to ars technica - feels that Bitcoin is worth studying.  To wit:

    As Adam Ozimek points out Bitcoin has so far largely been greeted with eye-rolling by professional economists. One reason is that the cryptocurrency’s most enthusiastic advocates tend to subscribe to a hard-money, end-the-Fed worldview that is unpopular among elites. That has caused the latter to reflexively take the opposite view, treating Bitcoin as primarily a monetary policy experiment and predicting its doom.

    My sympathies are with the pros here. Fiat currency isn’t perfect, but I think alternatives like the gold standard would be worse. But Bitcoin is a more than a gold standard for the Internet age. It’s the world’s first fully decentralized payment system, combining the irreversibility of cash with the convenience of electronic payment. There’s never been anything quite like it before, and as a result it poses a number of interesting intellectual puzzles. Here are four examples.


  • Monetary economics
  • Political philosophy
  • Economies of scale and competition policy
  • Data


  • Will Bitcoin morph into an alternative currency? Or, is it just a perfect bubble- in the same league as the Tulip mania- that would grow & grow until it goes bust? Only time will tell.


    Chart 1: Bitcoin's weekly price chart as at April 8, 2013 (Source: Bitcoincharts.com)

    If you believe that Bitcoin is a search for an alternative currency, surely there is a good enough alternative right in front of us - Gold. Strangely, Gold has been consolidating in a descending triangle (see Chart 2 below) while Bitcoin has been rising exponentially (see Chart 1 above). In a world flooded with money, Gold - like any other hard assets that cannot be duplicated- must increase in value. If that premise holds true, then Gold price should not break below the current strong horizontal support at USD1530-1550. It could eventually break to the upside of the triangle (at USD1750) and continue its uptrend.

     Again, only time will tell whether this will pan out or not.


    Chart 2: Gold's weekly price chart as at April 8, 2013 (Source: Stockcharts)

    Note:
    In addition to the disclaimer in the preamble to my blog, I hereby confirm that I do not have any relevant interest in, or any interest in the acquisition or disposal of, Bitcoin.

    Tuesday, April 09, 2013

    Market Outlook as at April 9, 2013

    Since the announcement of the dissolution of Parliament, our market has performed like a man transformed. The fear of a messy election that hung over our head like the Sword of Damoncles, causing the market to drop to the 1600 psychological level in late January & February. Why did the market react so positively on the announcement of the dissolution of Parliament when the outcome of the election is still unknown? If investors were so wrong in January & February by being so negative, could they be wring again now by being so positive?

    Looking at the chart, I am inclined to believe that FBMKLCI will have a difficult time breaking above the 1700 psychological level. The blue ships that led the market higher are now coming under selling pressure. While I am anticipate an immediate correction, I believe taking some chips off the table would be a prudent move for now.


    Chart: FBMKLCI's daily chart as at April 9, 2013 (Source: Quickcharts)

    LPI- a good stock with a high price tag

    Results Update

    For QE31/3/2013, LPI's net profit dropped 11% q-o-q but rose 34% y-o-y to RM42 million while revenue dropped 5% q-o-q but rose 5% y-o-y. Bottom-line dropped q-o-q due to lower net earned premium and higher claims incurred.


    Table 2: LPIs last 8 quarterly results


    Chart 1: LPI's last 29 quarterly results

    Valuation

    LPI (at RM13.70 as at 4.00pm) is trading at a PE of 17 times (based on last 4 quarters' EPS of 80.6 sen). At this PE multiple, LPI is nearly fully valued. It may command a PE of 18 times; thus giving a small upside of 80 sen.

    Technical Outlook

    LPi is still in an uptrend line with support at RM13.50. Its next support is the horizontal line at RM13.40. Its immediate resistance would be the high of RM14.40 recorded in January.

     
    Chart 2: LPI's weekly chart as at Apr 9, 2013_2.40pm (Source: Quickcharts)

    Conclusion

    Based on good financial performance & still-positive technical outlook, LPI is rated a HOLD. However, the stock is trading at fairly high valuation and a strategy of selling into strength may be warranted.

    Note:
    In addition to the disclaimer in the preamble to my blog, I hereby confirm that I do not have any relevant interest in, or any interest in the acquisition or disposal of, LPI.

    YeeLee- an attractive consumer stock

    Background

    Yee Lee Corporation Bhd ('YeeLee') is essentially a consumer stock that is involved in the manufacture & sale of the following products:


    Food Products
    Beverages
    Cooking Oil and Vegetable Fats
    Instant Noodles
    Household Products
    Bleach
    Dishwashing Paste and Liquid
    Laundry Detergent
    Praying Oil 
    Industrial
    Oral Care
    Toothbrush
    Toothpaste


    Recent Financial Results

    For QE31/12/2012, YeeLee's net profit increased by 32% q-o-q but dropped 4% y-o-y to RM7.9 million. Revenue declined by 8.4% q-o-q but increased by 8.6% y-o-y to RM164 million. The improvement in the net profit q-o-q was attributable to better performance in aerosol can and trading divisions arising from increase in aerosol can sales and sales of higher product margin portfolio in trading division coupled with lower advertisement and promotion expense. The palm oil refinery and associated company, Spritzer Bhd continued to perform better in this quarter. Palm oil mill had also turnaround in this quarter with increase in oil extraction rate.


     Table 2: YeeLee's last 8 quarterly results


    Chart 1: YeeLee's last 27 quarterly results

    Financial Position

    As at 31/12/201, YeeLee's financial position is deemed satisfactory, with current ratio at 1.1 times and gearing ratio at 0.4 time.

    Valuation

    YeeLee (at RM0.91 as at 3.00pm) is trading at a PE of 7.5 times (based on last 4 quarters' EPS of 12.5 sen). For a consumer stock, YeeLee is deemed fairly attractive.

    Technical Outlook

    YeeLee is range-bound between RM0.78 & RM0.92 for the past 20 months. A breakout of the range would point the way forward for the stock. An upside breakout could send the stock to revisit its 2010 high of RM1.24.


     Chart 2: YeeLee's weekly chart as at Apr 9, 2013_2.40pm (Source: Quickcharts)

    Conclusion

    Based on good financial performance, reasonably satisfactory financial position and attractive valuation, YeeLee is a good stock for long-term investment. If the stock can surpass the RM0.92 level, it may rally to revisit its 2010 high of RM1.24.

    Note:
    In addition to the disclaimer in the preamble to my blog, I hereby confirm that I do not have any relevant interest in, or any interest in the acquisition or disposal of, YeeLee.

    Spritzr- uptrend to continue

    Spritzr is poised to continue with its uptrend after it surpassed its recent high of RM1.13. Based on technical breakout, Spritzr could be a good trading BUY.


    Chart: Spritzr's weekly chart as at Apr 9, 2013_2.40Pm (Source: Quickcharts)

    Note:
    In addition to the disclaimer in the preamble to my blog, I hereby confirm that I do not have any relevant interest in, or any interest in the acquisition or disposal of, Spritzr.

    Monday, April 08, 2013

    Puncak- the beginning of a recovery?

    Puncak broke above its long-term downtrend line, RR at RM1.30 in early March. Last week, Puncak broke above its strong horizontal resistance at RM1.60. It is set to test its next resistance at the psychological RM2.00 mark.

    Puncak's future is closely tied with the outcome of the General Election as its major shareholder, Rozali is considered to be an UMNO man. If BN can recapture Selangor from Pakatan, investors would expect a better deal for Puncak. If the state government remained in the hands of Pakatan, the valuation of the stock would lower. OSK valued Puncak in early March at RM2.00 (here).

    Based on technical breakout, Puncak can be an interesting trading BUY.


    Chart 1: Puncak's weekly chart as at April 8, 2013_10.00am (Source: Quickcharts)


    Chart 2: Puncak's monthly chart as at April 5, 2013  (Source: Quickcharts)

    Note:
    In addition to the disclaimer in the preamble to my blog, I hereby confirm that I do not have any relevant interest in, or any interest in the acquisition or disposal of, Puncak.

    Ken- another property stock hitching a ride on the Iskandar property play

    Ken has broken above its strong horizontal resistance at RM1.30. Its immediate resistance would be the high recorded in 2007, which is either RM1.52. 


    Chart 1: Ken's weekly chart as at April 5, 2013 (Source: Quickcharts)

    If you looked at the chart from Tradesignum (unadjusted for dividend as compared to the chart from Quickcharts  which is adjusted for dividend), you would notice that the 2007 high is RM1.80 (with an intermediate horizontal resistance at RM1.60). The Tradesignum also shows a breakout above the strong horizontal resistance at RM1.35-1.38. Which chart should we follow? For reason noted below, I am inclined to use the Tradesignum chart.


    Chart 2: Ken's weekly chart as at April 5, 2013 (Source: Tradesignum)


    Chart 3: Ken's monthly chart as at April 5, 2013 (Source: Tradesignum)

    KEN is a profitable small property developer, which aspires to get into the big league. It has a small piece of land in Johor Baru of 9.2 hectares with GDV of RM1.2 billion (here). For FY2012, its net profit dropped to RM16 million from RM23 million due to lower revenue of RM54 million (cf. RM87 million, previously). Its EPS for FY2012 was 18.3 sen as compared to 25.5 sen previously. At last week's close of RM1.39, Ken is trading at a PE of 7.6 times. At this PE multiple, Ken is deemed fairly valued.

    Based technical breakout, Ken could be a good trading BUY. The target for this play may be RM1.80.

    To adjust for dividend or not to adjust for dividend?

    In my opinion, adjustment for dividend should only be made when the dividend is lumpy & substantial. What is substantial is something for each investor to decide. A RM1.00 dividend for a high-priced stock like BAT may be insubstantial in percentage term but in absolute term, it may be eye-popping and investors may adjust the relevant high & low for the dividend paid out. On the other hand, a 5-sen dividend is substantial for a penny stock whether in absolute term or even in percentage term. While I would think that an investor should adjust for that dividend, investors who dabble in penny stocks seldom take note of dividend payout. In such cases, dividend payout may not matter.

    Note:
    In addition to the disclaimer in the preamble to my blog, I hereby confirm that I do not have any relevant interest in, or any interest in the acquisition or disposal of, KEN.

    Friday, April 05, 2013

    Harta may have a bullish breakout

    Harta broke above its recent high of RM5.10 this morning. See Chart 1. Harta-WA has similarly broken above its downtrend line at RM1.17. See Chart 2.


    Chart 1: Harta's daily chart as at Apr 5, 2012_10.30am (Source: Quickcharts)


    Chart 1: Harta-WA's daily chart as at Apr 5, 2012_12.30pm (Source: Quickcharts)

    Harta is the most profitable of the rubber glove manufacturers in Malaysia. It has a pre-tax profit margin of 28.8% while the other major manufacturers (such as Topglov, Supermx & Kossan) only enjoy pre-tax profit margin of 11-13%. One of the main reasons is that it produces nitrile gloves which command a better margin. Because of its better profit margin and a perception of superior manufacturing prowess, Harta can command a higher PE of 16.9 times as compared to the other manufacturers.


    Table: Rubber glove manufacturers' Profit margin, EPS & PE

    Harta, which manufactures mostly nitrile gloves, may have an advantage in term of its raw material cost. The other producers of rubber gloves are now experiencing steadily rising latex price while nitrile input has risen less. See the chart for rubber prices & WTIC below.


    Chart 3: Rubber price chart as at Apr 4, 2013 (Source: Rubbernet.com)


    Chart 4: WTIC's weekly price chart as at Apr 4, 2013 (Source: Stockcharts)

    Based on technical breakout, Harta could be a good trading BUY.

    Note:
    In addition to the disclaimer in the preamble to my blog, I hereby confirm that I do not have any relevant interest in, or any interest in the acquisition or disposal of, Harta & Harta-WA.

    LMCemnt- uptrend likely to continue

    LMCemnt has just broken above its horizontal resistance at RM10.15 at about 10:00 am this morning. See Chart 1. With this upside breakout of its all-time high (albeit on very thin volume), LMCemnt is poised to continue with its uptrend. I expect the upcoming move to be a relatively small move of about 10%. This gives a potential target of RM11.00.

    Based on technical breakout and positive outlook for the building material sector, LMCemnt could be a trading BUY.


    Chart 1: LMCemt's daily chart as at Apr 5, 2013_10.15am (Source: Quickcharts)

    Chart 2: LMCemt's monthly chart as at Apr 4, 2013 (Source: Tradesignum)

    Note:
    In addition to the disclaimer in the preamble to my blog, I hereby confirm that I do not have any relevant interest in, or any interest in the acquisition or disposal of, LMCemnt

    Thursday, April 04, 2013

    Bird Flu- making a return?

    A few hours ago, CNN reported that a third person has died in China from an unusual bird flu (aka avian influenza) strain which was not previously detected in humans (here). Todate, the total number of people infected is nine. This is however not the first time that the bird flu has re-surfaced. From an article in Wikipedia, we learned that "(w)hile its most highly pathogenic strain (H5N1) had been spreading throughout Asia since 2003, avian influenza reached Europe in 2005, and the Middle East, as well as Africa, the following year. On January 22, 2012, China reported its second human death due to bird flu in a month following other fatalities in Vietnam and Cambodia". We can only hope that this latest outbreak will be contained.

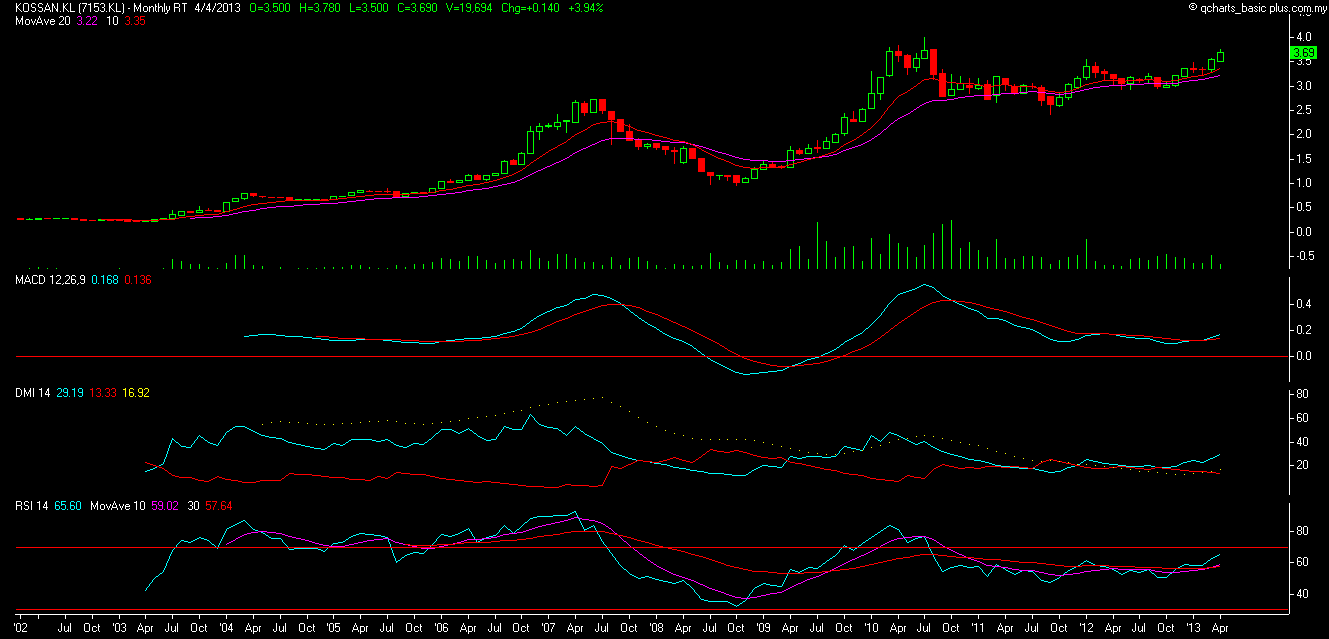
    If the bird flu were to spread, one industry that would benefit is the rubber glove industry. Below, I have appended the daily charts & monthly charts for Topglov & Kossan. If Topglov can surpass the RM5.75 level and similar if Kossan can surpass the RM3.75 level, both stocks may start on their upleg. Watch the news & these charts closely.


    Chart 1: Topglov's daily chart as at Apr 4, 2014 (Source: Quickcharts)


    Chart 2: Topglov's monthly chart as at Apr 4, 2014 (Source: Tradesignum)

    Chart 3: Kossan's daily chart as at Apr 4, 2014 (Source: Quickcharts)


    Chart 4: Kossan's monthly chart as at Apr 4, 2014 (Source: Tradesignum)

    Note:
    In addition to the disclaimer in the preamble to my blog, I hereby confirm that I do not have any relevant interest in, or any interest in the acquisition or disposal of, Topglov & Kossan.

    Wednesday, April 03, 2013

    Market Outlook as at April 3, 2013

    FBMKLCI started to slide at 9:30am this morning. The usual chatter about the dissolution of Parliament started all over again in the corridor & the water coolers. To be frank, I was pretty tired of the never-ending speculation of the upcoming election - an unproductive activity given the fact that it has to be announced soon or later. And, yet the market swooned and dropped a whopping 52 points when the news flashed on Malaysiakini! What a stunner! Who are those poor investors that were still waiting for the announcement to sell?!

    Anyway, my take on the market is simply that it has been pretty strong. You can see that from August last year until early January this year, FBMKLCI has been trending within an expanding triangle. What this means is that the bulls get more bullish while at the same time, the bears also get more bearish. If I may put a picture to the faceless bulls, it would professional fund managers putting their money to work in the market (courtesy of US Fed, Japanese Central Bank and ECB). The bears would be anyone who think that Malaysia would have a messy outcome in the General Election.

    This trend broke in late January 2013. The bears failed to push the index to the support of the expanding triangle. The index seems to have found its support at the psychological 1600 mark. After 3 failed attempts, the index rebounded and began to rise. This morning, the index came very close to the 1700 psychological resistance. Alas, we would never know whether the index could have surpassed the 1700 mark on its own momentum for the rally was cut short by the untimely announcement of the dissolution of our Parliament.

    For the next 2-3 weeks, I expect the index to be range-bound between 1600 & 1700. Our index- the barometer of our economy- might take on a new & unfamiliar role as the weather vane, showing the direction the political wind is blowing.


    Chart: FBMKLCI's daily chart as at April 3, 2013_12.10pm (Source: Quickcharts)

    Tuesday, April 02, 2013

    Tenaga- finally takes off...

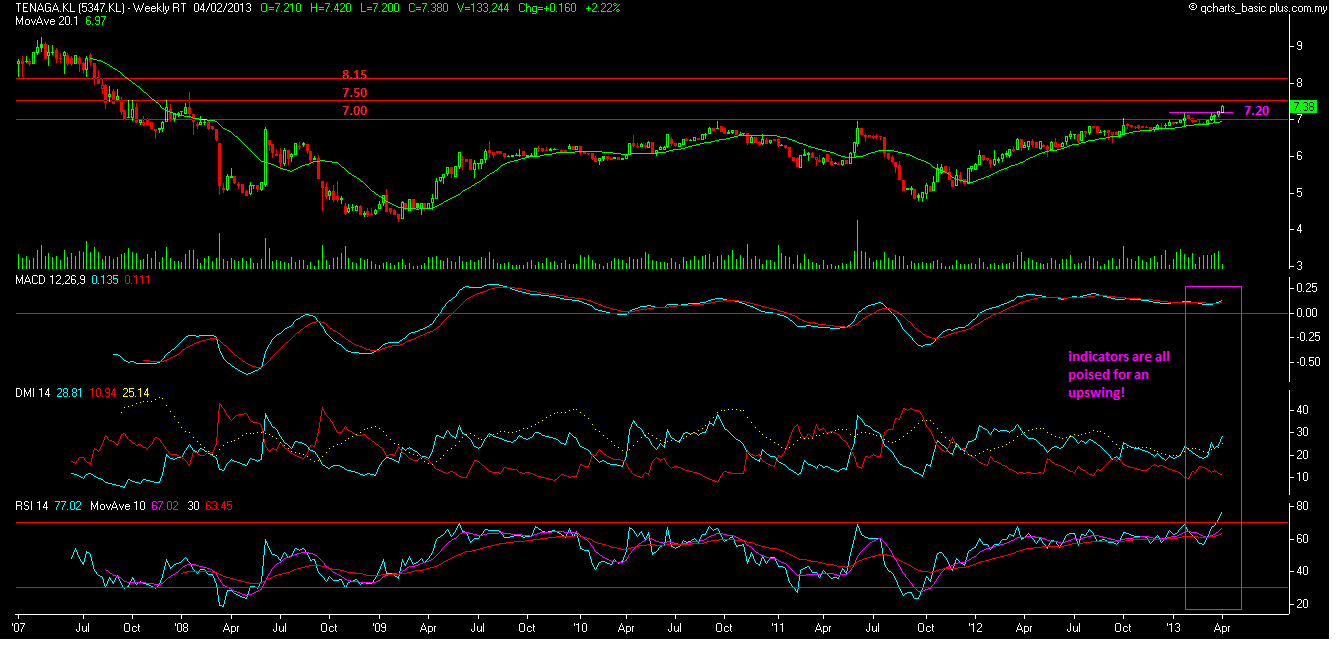
    Tenaga finally broke above the minor resistance at RM7.20 and flew. It even broke above the horizontal resistance at RM7.50. As at 3.45pm, it was trading at RM7.55. Its next resistance could be at RM8.00.


    Chart 1: Tenaga's weekly chart as at Apr 2, 2013_3.30pm (Source:Quickcharts)

    If we look at the monthly chart, Tenaga is testing its gradual upward channel. It managed to break above the upper boundary in December 2006 at RM8.40 & rose by about RM1.00 to the high of RM9.43. The current upper boundary is at RM7.60. If Tenaga can break above that mark, can it rise to RM8.60? We will have to wait & see.


    Chart 2: Tenaga's monthly chart as at Apr 2, 2013_3.45pm (Source:Quickcharts)


    If Tenaga can surpass the RM7.60, I think Tenaga may be good for a quick trading BUY. However, I must caution that Tenaga is a tricky stock and you should exercise careful discretion if you choose to speculate in it.


    Note:
    In addition to the disclaimer in the preamble to my blog, I hereby confirm that I do not have any relevant interest in, or any interest in the acquisition or disposal of, Tenaga.


    UOADev- uptrend could accelerate

    UOADev has just broken above its upward channel at RM2.15. With this breakout, UOADev's gradual uptrend could accelerate. Its next resistance will be its initial high of RM2.45 recorded on its listing date.

    Based on the technical breakout, UOADev could be a good trading BUY.


    Chart: UOADev's daily chart as at Apr 2, 2013_3:00pm (Source: Quickcharts)

    Note:
    In addition to the disclaimer in the preamble to my blog, I hereby confirm that I do not have any relevant interest in, or any interest in the acquisition or disposal of, UOADev.


    Timecom- breaks above its long-term downtrend line

    Timecom may have broken above its long-term downtrend line, RR at RM4.10. With this breakout, Timecom could begin its upleg. Its next resistance is the horizontal line at RM4.30.

    Based on technical breakout, Timecom could be a good trading BUY.


    Chart: Timecom's monthly chart as at April 1, 2013 (Source: Tradesignum)

    Note:
    In addition to the disclaimer in the preamble to my blog, I hereby confirm that I do not have any relevant interest in, or any interest in the acquisition or disposal of, Timecom.