Tuesday, October 29, 2013

Digi- earning set to rise


Result Update

For QE30/9/2013, DIGI's net profit rose 18% q-o-q or 42% y-o-y to RM449 million while revenue rose marginally by 3% q-o-q or 7% y-o-y to RM1.7 billion. The improved bottom-line on q-o-q basis was due to "a net result of higher service revenues coupled with lower accelerated depreciation in tandem with the tail end of the network modernization exercise, and was partially off-set by higher cost of handsets in line with higher take-up of device-bundled offerings during the current quarter".


Table: DIGI's last 8 quarterly results

We can see that the profit margin has picked up significantly over the past 2 quarters. With that improvement- a result of lower depreciation charges & higher revenue- the company's net profit has made a new high in QE30/9/2013.


Chart 1: DIGI's last 24 quarterly results

Valuation

DIGI (closed at RM4.93 yesterday) is now trading at a PE of 28 times (based on last 4 quarters' EPS of 18 sen). At this multiple, DIGI is deemed full-valued.

Technical Outlook

DIGI has been moving sideway for the past 1 year. However, the stock is still in a long-term uptrend and the signs are showing that it is poised to continue with the prior uptrend. This is reflected in the uptrend breakout of an intermediate downtrend line, RR at RM4.80 as well as all indicators rising upward.


Chart 2: DIGI's monthly chart as at Oct 28, 2013 (Source: quickcharts)

Conclusion

Based on improved financial performance & improving technical outlook, DIGI's rating is now revised from SELL to HOLD. To raise the recommendation again would require further improvement in its earning in order to justify paying a PE of 28 times for this stock.

Note: 
In addition to the disclaimer in the preamble to my blog, I hereby confirm that I do not have any relevant interest in, or any interest in the acquisition or disposal of, DIGI.

Thursday, October 24, 2013

Hiaptek- price recovery may have started


Hiap Teck Ventures Bhd ('Hiaptek') is involved in the manufacture, rental, and distribution of steel pipes, hollow sections, scaffolding equipment and accessories, and other steel products.

For FY2013, it reported a net profit of RM24.3 million in a revenue of RM1.11 billion. This is an improvement over last year result, where its net profit was RM16.6 million while revenue was RM1.12 billion. Its earning inched up from 3.1 sen in FY2012 to 3.4 sen in FY2013. For more, go here.

In May, the stock has broken above its long-term downtrend line and it has since been moving sideway. In the past 2-3 days, it was attempting to break above its recent high of RM0.66. The same movement was noted for the warrant but it has yet to even test its recent high of RM0.25. If the warrant can breach the RM0.25 mark, this stock and the warrant could begin its upleg.

Based on technical consideration, Hiaptek could be a good stock for trading BUY or even a medium-term investment if these securities can stay above their breakout level.


Chart 1: Hiapteck's weekly chart as at Oct 23, 2013_3.00pm (Source: Quickcharts)


Chart 2: Hiapteck-WA's weekly chart as at Oct 23, 2013_3.00pm (Source: Quickcharts)

As at 9.40 am, Hiapteck & Hiaptek-WA were trading at RM0.66 & RM0.255, respectively.

Note: 
In addition to the disclaimer in the preamble to my blog, I hereby confirm that I do not have any relevant interest in, or any interest in the acquisition or disposal of, Hiaptek.

Huayang- profit margin slid further


Results Update

For QE30/9/2013, Huayang's net profit remained unchanged at RM16.7 million when compared to the immediate preceding quarter (QE30/6/2013) but declined by 28% y-o-y from RM17.1 million. Revenue also declined by 2% y-o-y but rose 26% q-o-q to RM101 million. The decline in bottom-line y-o-y was due to slower construction progress.


Table: Huayang's last 8 quarterly results


Huaynag's bottom-line continued to slide as did its profit margin. If profitability for a developer that builds for the mass market is heading south, it is a sign that all is not well with the property sector. The competition is getting very stiff in the race to the bottom of the market (or more appropriately, the lower-to-medium-end of the market which Huayang is positioned) .


Chart 1: Huayang's last 21 quarterly results

Valuation

Huayang (at RM2.27 yesterday) is trading at a PE of 9.7 times (based on last 4 quarters' EPS of 23.3 sen). At this PE, Huayang is still deemed fairly valued, with limited upside.

Proposed Bonus Issue

Huayang has just proposed a 1-for-3 bonus issue on October 10. In the past 4 years, Huayang had carried 4 bonus issue. The past 3 bonus issues are 1-for-4 on Oct 11, 2012: 1-for-3 on Oct 25, 2011; and, 1-for-5 on Sep 24, 2010. There is a saying that too much of a good thing may not be good for you.

Technical Outlook

Huayang's uptrend seems to have hit the wall. Its immediate resistance is at the horizontal line at RM2.40 while its immediate support is at RM1.95-2.00.


Chart 2: Huayang's weekly chart as at Oct 23, 2013(Source: quickcharts)
 
Conclusion

Based on decline in financial performance, a less-than-cheap valuation and neutral-to-cautious technical outlook, I would rate the stock as a SELL INTO STRENGTH.

Note: 
In addition to the disclaimer in the preamble to my blog, I hereby confirm that I do not have any relevant interest in, or any interest in the acquisition or disposal of, Huayang.

Wednesday, October 23, 2013

Market Outlook as at October 23, 2013


FBMKLCI has just surpassed the "horizontal line", R1-R1 at 1805. This is a positive signal after the breakout above 1800 last week. However, this breakout is not confirmed by FBMEmas, which is still stuck at the "horizontal" resistance at 12600. If FBMEmas also surpassed that resistance and the market breadth & volume improved, our market would continue with its prior uptrend. The immediate target would be 1850.

 
Chart 1: FBMKLCI's daily chart as at Oct 23, 2013_10.30am (Source: Quickcharts)

 
Chart 2: FBMEmas's daily chart as at Oct 23, 2013_10.30am (Source: Quickcharts)

If the above scenario panned out, we may have a decent rally in the next few weeks. However, we should not be carried away by the rise in FBMKLCI, if it is not confirmed by FBMEmas or by an improvement in market breadth or volume. This could then be simply a short Budget play that could end in tears.

Good luck!

MBSB- bottom-line finally dipped!


Result Update

For QE30/9/2013, MBSB reported a net profit dropped 20% q-o-q but rose 48% y-o-y to RM133 million while its revenue rose 5% q-o-q or 24%  y-o-y to RM644 million. The q-o-q drop in net profit was mainly as a result of higher impairment losses on loans, advances and financing; and, operating expenses, which were partially set-off by the profit contribution from Islamic operations (which in turn is due to continuing growth of personal financing portfolio and higher other operating income).


Table: MBSB's last 8 quarterly results


Chart 1: MBSB's last 37 quarterly results

From Chart 1, we can see that the bottom-line has dropped after 4 years of strong growth. Is this a short break in the growth trend or is this the beginning of the steady decline due to poorer credit quality? Only time will tell.

Valuation

MBSB (at RM2.82 yesterday) is now trading at a current PE of 8.1 times (based on the annualized EPS of 34.84 sen, which is computed using the EPS for the last 2 quarters). At this PE, MBSN is still deemed reasonably priced to factor in the possible decline in earning for the next few quarters (due to concern about collection).

Technical Outlook

MBSB is in a steady uptrend since breaking above the strong horizontal line at RM0.85 in March 2011. Its immediate resistance is at the horizontal line, ef at RM3.20 while its immediate support is at the 40-week SMA line at RM2.74 & thereafter at the long-term uptrend line, ss at RM2.55.


Chart 2: MBSB's weekly chart as at Oct 22, 2013_on linear scale (Source: quickcharts)

If you look at the semi-log chart (Chart  3), you will see that MBSB has broken its long-term uptrend line, SS. For stocks that had a strong rally, the semi-log charts give a better reading whether the trend is still intact or at the very least, they give an early warning that the trend lines have been violated. As such, I am inclined to go with Chart 3 below- that MBSB has transitioned to a sideway trend for now.

  
Chart 3: MBSB's weekly chart as at Oct 22, 2013_on semi-log scale (Source: Tradesignum)
 
Conclusion

Based on poorer financial performance & mildly negative technical outlook, I believe it is advisable to take some profit on MBSB.

Note: 
In addition to the disclaimer in the preamble to my blog, I hereby confirm that I do not have any relevant interest in, or any interest in the acquisition or disposal of, MBSB.

Tuesday, October 22, 2013

Fibon- a cheap smallcap

Fibon Bhd ('Fibon') is involved in the formulation of polymer matrix fibre composites as well as in the manufacture and sales of electrical insulators, electrical enclosures, and meter boards.

Fibon reported a net profit of RM4.9 million for FYE31/5/2013 on a revenue of RM16.6 million. This compared with a net profit of RM4.5 million on a revenue of RM16.9 million last year. As at 31/5/2013, the company's financial position is deemed healthy with no borrowings; total liabilities of RM1.4 million versus shareholders' fund of RM31.8 million. Cash in hand is about RM20 million or RM0.20 per share.

Fibon is now trading at a PE of 10 times (based on FY2013 EPS of 5 sen & current price of RM0.52).

Fibon broke above its downtrend line at RM0.30 in mid-May. Since then, it has been moving sideway, with horizontal resistance at RM0.45. Yesterday, it broke above that resistance.

With this breakout, Fibon is expected to begin its upleg. Its next resistance is at RM0.70.


Chart: Fibon's weekly chart as at Oct 22, 2013_2.45pm (Source: Quickcharts)

Note:
In addition to the disclaimer in the preamble to my blog, I hereby confirm that I do not have any relevant interest in, or any interest in the acquisition or disposal of, Fibon.

Monday, October 21, 2013

Malton- poised for its next upleg

Last Thursday, Malton broke above its recent high of RM0.96 & hit a high of RM1.00 before retreating. Today, it is attempting the RM1.00 again. If it can surpass this mark, this stock can continue with its cautious uptrend.


Chart: Malton's weekly chart as at Oct 21, 2013_3.15pm (Source: Quickcharts)

The current rise in the stock coincided with a research report from RHB Investment Bank which valued the stock at RM1.80. The report highlighted an active pipeline of launches such as the Pavillion 2 project with GDV of RM3.88 billion in Bukit Jalil; RM3.88-billion joint venture in Batu Kawan, Penang for a 300-acre leasehold development; a RM480 million project on 200 acres of land in Pengerang, Johor; and a commercial redevelopment worth RM2-3 billion in Pusat Bandar Damansara. Other smaller projects are located in Pantai Dalam, Jalan Ipoh, Ukay Spring and Seri Kembangan. For more, go here & here.

Based on technical consideration, Malton could be a good stock for a trading BUY.

Note:
In addition to the disclaimer in the preamble to my blog, I hereby confirm that I do not have any relevant interest in, or any interest in the acquisition or disposal of, Malton.

AEONCR- profit margin began to narrow


Result Update

For QE20/8/2013, AEONCR's net profit increased by 4% q-o-q or 34% y-o-y to RM43 million while revenue increased by 13% q-o-q or 45% y-o-y to RM163 million. The smaller increase in the bottom-line q-o-q basis vis-a-vis the higher increase in revenue is likely due to increase funding cost. The increased funding cost must be quite severe that a 13%-increase in revenue only translated into a 4%-increase in net profit. If this trend continues, AEONCR's net profit may soon flatten out.


Table: Aeoncr's last 8 quarterly results

The dip in the profit margin is shown on Chart 1. If you look at Chart 2, we can see that the average quarterly change in top-line and bottom-line seems to diverge in the past 6-7 quarters, with top-line quarterly growth inching higher while bottom-line quarterly growth drifting lower.


Chart 1: Aeoncr's last 25 quarterly results


Chart 2: Aeoncr's average quarterly change in top-line & bottom-line for last 21 quarterly results 

Valuation

AEONCR (closed at RM15.80 last Friday) is now trading at a PE of 14.2 times (based on last 4 quarters' EPS of 111 sen). While the PE multiple indicates fair valuation, AEONCR's PEG ratio is still attractive at 0.4 time (arrived at by dividing PE with average CAGR of 40%).

As noted above, my concern is the flattening out of bottom-line due to a compressed profit margin, brought on by increased funding cost. If this happens, the above valuation will not apply. 

Technical Outlook

AEONCR is still in an uptrend but it is in a corrective phase which is likely to see the share price testing its 40-week SMA line at RM15.17 (or, RM15.00). As long as this level is not violated, the uptrend is still intact. A break of the RM15.00 mark could change the bullish technical outlook to a cautious outlook that would warrant a reduction in position in this stock.


Chart 3: Aeoncr's weekly chart as at Oct 18, 2013 (Source: Quickcharts)
 
Conclusion

Based on satisfactory financial performance, current attractive valuation & positive technical outlook, AEONCR is rated a HOLD. However, if the share price were to break below the RM15.00  mark or the net profit were to drop next quarter, the rating would be adjusted to REDUCE.

Note:
In addition to the disclaimer in the preamble to my blog, I hereby confirm that I do not have any relevant interest in, or any interest in the acquisition or disposal of, AEONCR.

Friday, October 18, 2013

Konsort- uptrend may accelerate


Konsort broke above its recent high of RM1.43-1.44. With this breakout, Konsort's uptrend may accelerate. Based on projection, its next target could be RM1.70-1.80.

Based on technical breakout, Konsort could be a good trading BUY.


Chart: Konsort's daily chart as at Oct 18, 2013_11.00am (Source: Quickcharts)

Note:
In addition to the disclaimer in the preamble to my blog, I hereby confirm that I do not have any relevant interest in, or any interest in the acquisition or disposal of, Konsort.

Tesla- the next Google?!

One of the great stock stories in the US stock markets in the past 6-7 months is the rise of TESLA. This company designs, manufactures and sells electric cars and electric vehicle powertrain components. You can check out its website (here).

TESLA is a start-up and it has yet to report any profit. In fact, it had incurred net losses of USD154 million & USD254 million & USD396 million in FY2010, FY2011 & FY2012- not surprising. But what is surprising is how the share price just zoomed up to nearly USD195 in end September after it broke above the USD40 horizontal resistance in April this year.


Chart: TSLA's daily chart as at Oct 17, 2013  (Source: Stockcharts)

Yesterday, one of the top fund managers in US, Jeff Gundlach commented that there is something wrong with how TESLA and Ford and GM seem to be all rallying higher. Surely the success of TESLA (if it happens) would eat into the market share of Ford or GM. He felt that TESLA is a stock that has benefited from its 'cultish aspect'. Without making a single cent of profit, the company is now worth USD300 billion. For more, go to here.

Looking at Chart 1, we can see that there are signs of weakness in the stock. Its RSI broke the 50-mark (before recovering above it) and its MACD broke its horizontal line. Both are not confirmed sell signals but warning signs that all may not be so well for this stock. I believe if the share price were to breach the 50-day SMA line at USD168, the stock could tumble down sharply.

Note:
In addition to the disclaimer in the preamble to my blog, I hereby confirm that I do not have any relevant interest in, or any interest in the acquisition or disposal of, TESLA or Ford or GM.

Plantation stocks marking time...

CPO has broken above its intermediate downtrend line, RR at RM2350 in mid-August. After a rally to RM2500, CPO eased back to test the overcome downtrend line at RM2250 in September. The indicators are slowly climbing up and if CPO can surpassed its August high of RM2500, CPO may enter into a medium term uptrend.


Chart 1: CPO's weekly chart as at Oct 17, 2013 (Source: ifs.marketcenter)

FBMPalmOil index, which has been moving sideway for the past 9 months, could enter into an uptrend once CPO prices trend higher. FBMPalmOil index comprises the constituents of the FTSE Bursa Malaysia EMAS Index that derive substantial revenue from palm oil activities that meet the stated eligibility requirements.


Chart 2: FBMPalmOil's weekly chart as at Oct 18, 2013_11.00am (Source: Quickcharts)

I do not have any plantation stock in mind though I am a bit surprised by KMLoong's price performance as well as the small drop in its bottom-line (as compared to huge drop in other plantation companies). If it can surpass its recent high of RM2.50, KMLoong may continue with its prior uptrend.


Chart 3: KMLoong's weekly chart as at Oct 18, 2013_2.45pm (Source: Quickcharts)

Based on the above, I believe that you should pay close attention to plantation stocks as I feel that this sector could benefit from a rally in CPO prices if the CPO can breach the RM2500 level.

Note:
In addition to the disclaimer in the preamble to my blog, I hereby confirm that I do not have any relevant interest in, or any interest in the acquisition or disposal of, FBMPalmOil index or plantation stocks.

MPHBCap- gradual uptrend to continue

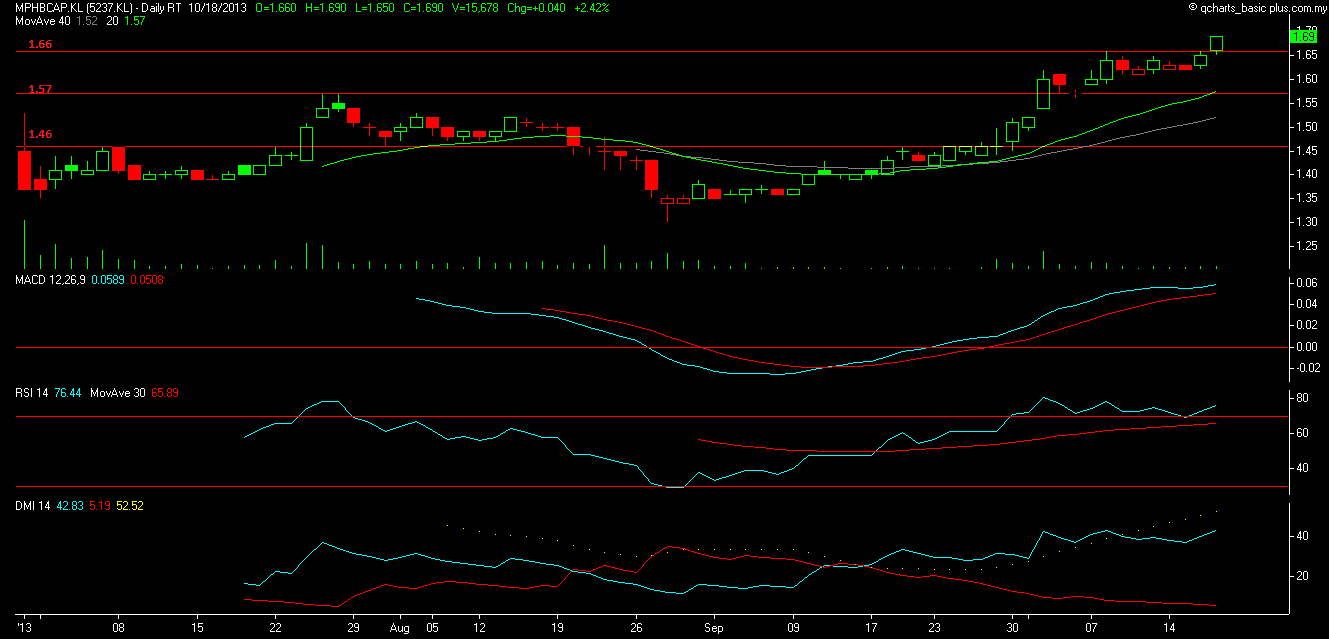
MPHBCap broke above its recent high of RM1.66 this morning. If it can stay above this mark, the stock is likely to continue with its gradual uptrend.

Based on this technical breakout, MPHBCap could be a good trading BUY.


Chart: MPHBCap's daily chart as at Oct 18, 2013_11.00am (Source: Quickcharts)

Note:
In addition to the disclaimer in the preamble to my blog, I hereby confirm that I do not have any relevant interest in, or any interest in the acquisition or disposal of, MPHBCap.

Thursday, October 17, 2013

Zhulian- another great quarter!


Result Update

For QE31/8/2013, Zhulian's net profit increased 4% q-o-q or 40% y-o-y to RM40 million while revenue increased 17% q-o-q or 12% y-o-y to RM124 million. Revenue increased q-o-q due mainly to the increase in overseas sales. Net profit also increased q-o-q due to the increase in share of profit of equity accounted investee and increase in overseas sales.


Table: Zhulian's last 8 quarterly results


Chart 1: Zhulian's last 28 quarterly results 

Valuation

Zhulian (closed at RM4.01 yesterday) is now trading a PE of 13 times (based on last 4 quarters of 30.1 sen). Its PEG ratio is about 0.7 time (based on earning CAGR of at least 20%). As such, Zhulian is still deemed attractive.

Technical Outlook

Zhulian's uptrend continued after it broke above the horizontal line at RM2.90 in May (see this earlier post). The stock is likely to consolidate around the RM4.00 after its sharp rally in the past 2 months.


Chart 2: Zhulian's weekly chart as at Oct 16, 2013 (Source: quickcharts)

Conclusion

Based on good financial performance, attractive valuation & positive technical outlook, Zhulian is still a good stock for long-term investment.

Note: 
In addition to the disclaimer in the preamble to my blog, I hereby confirm that I do not have any relevant interest in, or any interest in the acquisition or disposal of, Zhulian.

Wednesday, October 16, 2013

Presbhd- uptrend to continue

Presbhd has just surpassed its recent high of RM2.20. With this breakout, Presbhd should continue with its prior uptrend. Its potential target is RM2.70 (based on projection).

Based on technical breakout, Presbhd could be a good trading BUY.


Chart: Presbhd's daily chart as at Oct 16, 2013_4.30pm (Source: Quickcharts)

Note:
In addition to the disclaimer in the preamble to my blog, I hereby confirm that I do not have any relevant interest in, or any interest in the acquisition or disposal of, Presbhd.

Monday, October 14, 2013

Spritzr- top-line & bottom-line improved q-o-q

Result Update

For QE31/8/2013, Spritzr's net profit dropped 12% q-o-q but rose 66% y-o-y to RM5.2 million while revenue was rose 10% q-o-q or 17% y-o-y to RM56 million. The company attributed 10% q-o-q increase in net profit to increased revenue, which is the result of increase in sales volume of bottled water products.


Table: Spritzr's last 8 quarterly results


Chart 1: Spritzr's last 29 quarterly results

Valuation

Spritzr (closed at RM1.71 at the end of morning session) is now trading at a PE of 10.6 times (based on last 4 quarters' EPS of 16.2 sen). At this PE multiple, Spritzr is still deemed attractive for a consumer stock.

Technical Outlook

Spritzr dropped back to test its uptrend line in late August. It made a low of RM1.31. Its immediate support is at the horizontal line at RM1.50 & the immediate resistance is at RM1.80.


Chart 2: Spritzr's weekly chart as at Oct 14, 2013_12:30pm (Source: quickcharts)
 
Conclusion

Based on good financial performance & still attractive valuation, Spritzr is a good stock for long-term investment. I rate the stock a HOLD.

Note: 
In addition to the disclaimer in the preamble to my blog, I hereby confirm that I do not have any relevant interest in, or any interest in the acquisition or disposal of, Spritzr.

Wednesday, October 09, 2013

LPI- bottom-line lifted by investment income


Result Update

For QE30/9/2013, LPI's net profit increased by 30% q-o-q or 27% y-o-y to RM60 million while revenue remained unchanged q-o-q but increased by 7% y-o-y to RM282 million. The q-o-q in net profit was mainly due to higher investment income received.


Table 2: LPIs last 8 quarterly results


Chart 1: LPI's last 30 quarterly results

Valuation

LPI (closed at RM15.44 yesterday) is now trading at a PE of 17.3 times (based on last 4 quarters' EPS of 89 sen). At this PE multiple, LPI is deemed fully valued.

Technical Outlook

LPI is in an uptrend line, SS.  In early July, it broke above the line connecting the recent high (AB) at RM14.80. Now the recent high of RM15.60 will act as the temporary resistance while the line, AB will act as a support (at RM14.96-15.00).


Chart 2: LPI's weekly chart as at Oct 8, 2013(Source: Quickcharts)
 
Conclusion

Based of good financial performance and positive technical outlook, LPI is rated a HOLD. However, its upside is deemed limited as the valuation is fairly demanding.
Note:
In addition to the disclaimer in the preamble to my blog, I hereby confirm that I do not have any relevant interest in, or any interest in the acquisition or disposal of, LPI.

Tuesday, October 08, 2013

Market Outlook as at October 8, 2013


The whole world is waiting anxiously as the US government is playing Russian Roulette. Looking at the DJIA, we can see that a potential triple top formation in place. With the 50-day SMA line cutting below the 100-day SMA line yesterday, the stage is set for the US market to drop further. This drop, when it comes, will be more severe than what we saw in May 2012 or October-November 2012 (of about 8%). It may mirror the drop in August-September 2011 (of 15%).


Chart 1: DJIA's daily chart as at Oct 7, 2013 (Source: Stockcharts)

The impact of a sharp fall on Wall Street would be felt around the world. We can see from the Dow Jones World Stock Index chart below, that this index dropped from 270 to 210 during the 2011 US Debt Ceiling Crisis. I expect a similar decline if the US government shutdown materializes.


Chart 2: DJWCs daily chart as at Oct 7, 2013 (Source: Stockcharts)

Bursa Malaysia was also severely impact in July-September 2011. We can expect a similar decline again if the US government shutdown takes place.


Chart 3: FBMKLCI's weekly chart as at Oct 7, 2013 (Source: Quickcharts)

                             ****************************************

Due to misconception or poor reporting, many people around the worls believe that the imminent US government shutdown is simply a fight to control the US government debt, which currently stands at US$17.6 trillion (here). That is far from the truth. The fight is purely an attempt by a group of fanatical Republicans lawmakers to weaken President Obama and to cause him to be a lame duck President one year after his convincing reelection. They are relying on the Second Liberty Bond Act of 1917-- which instituted a statutory debt limit for the US government-- to prevent the passage of a clean spending bill (similar to our Government Budget). What these Republican lawmakers (known as the Tea Party supporters) did was to attach a provision to the spending bill which calls for the repeal of the Affordable Care Act (or, the Obamacare). This revision to the spending bill is a strategy to defeat a law (the Obamacare) by simply defunding it (or not to fund it).

Many Democrats and legal experts are saying that the attempt by the Republicans to repeal an Act by simply defunding the Act would set a dangerous precedent which could make America ungovernable. Thus, President Obama has broad support to push back the offensive mounted by the Republicans.

However, the Republicans are well-funded and deeply-entrenched due to gerrymandering of their electoral boundaries by State Governments (controlled by Republicans). This gerrymandering resulted in many House of Representatives seats that are dominated by Republicans (mostly, whites). They are immune from challenges from the Democrats. Secured in their incumbency, these representatives dare to risk everything to bring down President Obama.

While the Republicans have certainly overplayed their hands -- with the US public opinion turning against them-- they are in no hurry to reverse course. Thus, America is now on a collision course. It is hard to imagine how sanity can return to the la-la land!!


Source: Financial Times

While we contemplate the danger of the US government shutdown and its impact on our equity portfolio, we must not be too complacent that this problem will not happen in our Parliamentary democracy. It is certainly true that in a Parliamentary democracy-- with the executive and legislative on the same side-- the danger that we may face is less of the tyranny of a minority but the tyranny of the majority.

While no system of government is perfect, all form of government will fall if we gamed the system too much. In Malaysia, we have our own problem of gerrymandering leading to over-representation by the rural population. This over-representation of rural population (mostly farmers) would lead to government policies that favor this small minority at the expenses of the larger majority. We have seen this in Japan & recently in Thailand where governments would bend backward to subsidize the farmers while heavily-taxing the importation of farm products. This leads to absurd situation like the mountain of rice in Thailand & to some extent, Japan as well as US$100 melons imported into Japan. We must learn from their mistakes and do our best to safeguard & improve our system of government.

Monday, October 07, 2013

GHLSys- an acquisition in Australia but no suspension?


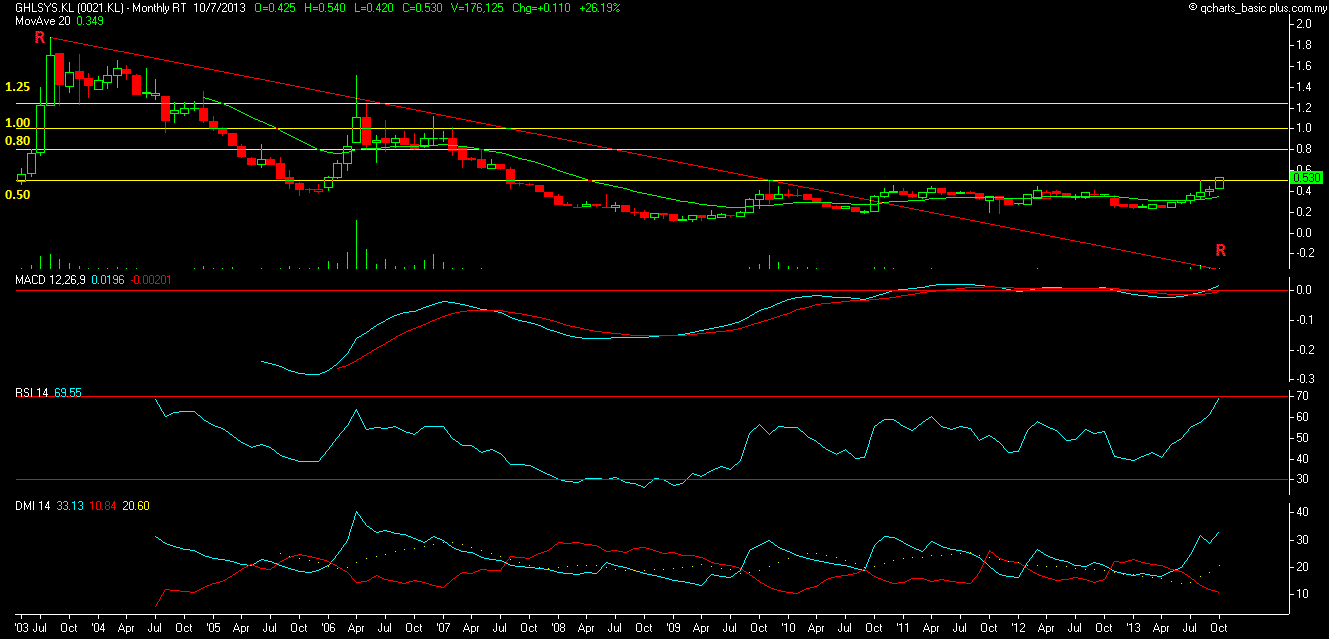
GHLSys broke above its strong horizontal resistance at RM0.50 this morning. This is a follow through of a bullish upside breakout of a triangle in August at RM0.38. With this breakout, GHLSys may rally to its next resistance at RM0.80.

 
Chart 1: GHLSys's daily chart as at Oct 7, 2013_11.00am (Source: Quickcharts)


Chart 2: GHLSys's monthly chart as at Oct 7, 2013_11.00am (Source: Quickcharts)

There is an announcement by e-pay Asia Ltd (of Australia) that it "has received an off-market takeover offer from GHL Systems Berhad for a cash consideration of A$0.40 per share - valuing e-pay Asia at around A$22.8 million."

"e-pay Asia shares closed at $0.375 on Friday, with the stock trading as low as $0.135 in July this year. The offer price is a 6.67% premium. e-pay Asia shareholders have been offered an alternative to cash of 2.75 GHL shares for each e-pay Asia share held."


If you value e-pay Asia at A$0.40 apiece, then GHLSys would be valued at RM0.44 apiece. Presently, GHLSys is trading at 0.59 (as at 12.05pm)-- way above the valuation as per the share swap. For more, go here.

Surprisingly, GHLSys is not suspended. 
[UPDATED: GHLSys was suspended on October 3 (here) for the announcement of multiple proposals including the acquisition of e-pay Asai (here).]


 Chart 2: GHLsys's last 11 years performance

 
Table: GHLsys's last 11 years performance

Based on technical breakout, GHLSys could be a trading BUY.However, it must be noted that GHLSys is trading much higher than the value assigned to the stock as per the Australian acquisition.

Note:
In addition to the disclaimer in the preamble to my blog, I hereby confirm that I do not have any relevant interest in, or any interest in the acquisition or disposal of, GHLSys.

Friday, October 04, 2013

Dsonic & Inari- the Big Ones that got away

There is a saying that "we win some, we lose some". There is also a third category, the ones that you missed out. In this quiet time, you have to kick yourself for missing out on the big fish and nothing comes bigger than Dsonic and, to some extent, Inari.

What I am going write now is how we missed out on a stock, even though we had been following it for a while. Sometimes, there are valid reasons to be cautious with certain stocks but other times, you just couldn't get yourself to pull the trigger (or call a BUY). Of course, with the benefit of hindsight, you would ask yourself, why didn't I just take a small position. Why, in deed?! This type of thinking would be up there with clients' instruction to get me the best price!! When impossible instruction like that came from a newbie, you can just laugh it off. When it came from seasoned players, it makes you wonder whether they knew what they were doing. I'm digressing. Now, let's go to the story.

1) Inari

Inari is the leading Electronic Manufacturing Services provider in the semiconductors industry for Radio Frequency, Opto-electronics and Fiber-optics technologies. We have production facilities across three countries, namely Malaysia, Philippines and China.

The Group has a customer which is also a substantial shareholder of the Company that contributed approximately RM164.5 million or 94.8% to the Group’s total revenue for the nine months ended 31 March 2013. From the outset, I was very concerned with this over-dependent on a single customer.

However, Inari is a very profitable company. See Table 1 & Chart 1 below.


Table 1: Inari's last 11 quarterly results


Chart 1: Inari's last 11 quarterly results

In April 2013, it broke above its horizontal resistance at RM0.35. That should have been a good level to get in for a trading BUY.


Chart 2: Inari's daily chart as at October 4, 2013_11.00am (Source: Quickcharts)

In addition, it was trading at a PE of 5 times in April (based on 4 quarters' EPS to QE31/12/2012 of 8 sen). At that PE multiple, Inari was reasonably priced.

In the end, I gave it a miss because of the single customer concern.

2) Dsonic

This company is involved in the provision of ICT solutions including the smart card personalisation (such as secure ID or chip-based credit / debit / bank cards), customisation of software and hardware solutions, project management, consultancy, R&D and technical consultancy services.

It was listed in September 2012. Its financial performance was very good and it was growing rapidly. See Table 2 & Chart 3 below.


Table 2: Dsonic's last 5 quarterly results


Chart 3: Dsonic's last 5 quarterly results

In early May 2013, it broke above the horizontal resistance at RM1.33 (Prior to the Bonus Issue of 1-for-2, the unadjusted breakout level would be RM2.00).


Chart 2: Dsonic's daily chart as at October 4, 2013_11.00am (Source: Quickcharts)

Its PE at the point of breakout was about 3 times (based on last 4 quarters' EPS to 31/3/2013 of 42 sen).

With every box checked - it's profitable, it's attractively valued & it has a bullish breakout- I should have called a BUY but, I didn't. Why?! I am not sure. It could be because I felt it was "too easy". On hindsight, it is a very poor excuse.

                            *********************************************

As I sit in front of the terminal scanning the stocks- with nothing exciting to write about- I regretted not calling a BUY on these 2 stocks. However, I have to check myself constantly to avoid simply calling a BUY on a stock because there is expectation. I am channeling my 'energy' into writing about stocks that we should be careful about or simply avoid. Until I have something worthwhile, I will be here, silently twiddling my fingers

NOTE: THIS IS NOT A CALL TO BUY EITHER INARI OR DSONIC. SINCE BOTH STOCKS HAVE RISEN SUBSTANTIALLY, I BELIEVE THAT THE RISK TO REWARD PROPOSITION IS NO LONGER IN YOUR FAVOR.

Note:
In addition to the disclaimer in the preamble to my blog, I hereby confirm that I do not have any relevant interest in, or any interest in the acquisition or disposal of, Inari & Dsonic.

Wednesday, October 02, 2013

Bpuri has a bullish breakout

In the past one month, BPuri announced it has secured three sizable contracts. They are:
1) a RM67 million contract for civil works in Sipatang, Sabah (here);
2) a RM441 million contract from Sime Darby Capitalmalls to build a superstructure for a 13-story retail complex in Melawati (here); and
3) a RM97 million contract from Likas Bay Prescint S.B. to construct a Koums Asrama in Kuala Menggatal, Sabah (here)

This followed shortly after the announcement that the former Transport Minister, Ong Tee Keat has joined Bpuri as an Adviser. For more on this, go to the Ant Daily (quoting a report from Focus Malaysia). Tee Keat, known to be a 'clean guy', may prove to be less helpful in term of getting new contracts.

From the chart below, we can see that Bpuri has broken above its intermediate downtrend line, RR at RM0.70 in April. In late September, Bpuri broke above its horizontal line at RM0.80. It also made a higher high after the recent high of RM0.82 in April. Thus, we can say that a medium-term uptrend has begun. A medium-term uptrend line, SS can be drawn, with support at RM0.70.Immediate support is the horizontal line at RM0.80 and thereafter the 40-week EMA line at RM0.73.


Chart 1: Bpuri's weekly chart as at Oct 2, 2013_9.30pm (Source: Quickcharts)

Bpuri's financial performance is nothing to shout about. While its revenue has grown substantially, its profitability lags behind. The main reason for this is the poor profit margin of only 1-2% enjoyed by the company. This shows that construction company must move up the value chain if they intend to make good profit.


Chart 2: Bpuri's last 14 years performance

The immediate concern for Bpuri is the potential huge damages that it may incurred in the late delivery of the KLIA2 project. I believe Ong Tee Keat may prove to be an asset when Bpuri comes up against Malaysian Airport (the employer) when the latter makes its claim for Liquidated Ascertained Damages (LAD) against Bpuri and its JV partner, UEM Construction in the late completion of the KLIA2 contract. As per the article in the Ant Daily:

In June, MAHB slapped Bina Puri, one of the subcontractors for the klia2 project, and its joint-venture partner UEM Construction with its first liquidated ascertained damages (LAD) claim, amounting to RM199,445.40 per day. It is estimated that the damages could reach some RM63 mil. The new low-cost carrier terminal was scheduled to open on June 28 but has since been delayed to May 2, 2014.
If the total LAD of RM63 million is shared out equally, Bpuri would have to take a loss of

RM61.5 million RM31.5 million. However, the final figure is normally negotiated and it would likely be less than the initial LAD. One angle that Bpuri and UEM Construction may argue their case is the numerous changes made to the initial plan.

Besides the huge LAD from the KLIA2 project, Bpuri has another serious concern: poor financial position, As at 30/6/2013, its current ratio stood at 0.95 time while its gearing ratio was very high at 3.35 times. The high leverage plus the poor liquidity are recipe for disaster.

Based on the above, I believe that Bpuri may not be a good stock for long-term investment. However, its technical breakout may qualified the stock as a trading BUY. Good luck.

Note:
In addition to the disclaimer in the preamble to my blog, I hereby confirm that I do not have any relevant interest in, or any interest in the acquisition or disposal of, Bpuri.