Monday, August 11, 2014

Market Outlook as at August 11, 2014

Over the past 2 weeks, European stock markets dropped steadily and a few of them broke below their uptrend lines. This can be seen among the bigger stock markets, like DAX, CAC & FTSE. The drop in these markets is probably due to poor economic data.

Business Insiders has a report which quoted Carl Weinberg of High Frequency Economics:

"For Euroland, the big picture is that the economy is in its seventh year of depression. On our estimate of a 0.7% contraction in the second quarter, GDP was still 3.2% lower than it was in the first quarter of 2008, when the depression began".
For more, go here.


Chart 1: DAX's weekly chart as at Aug 8, 2014 (Source: Stockcharts.com)


Chart 2: CAC's weekly chart as at Aug 8, 2014 (Source: Stockcharts.com)


Chart 3: FTSE's weekly chart as at Aug 8, 2014 (Source: Stockcharts.com)

Meanwhile, the US stock markets, which had dropped quite a bit over the past 2-3 weeks, are still above their respective uptrend lines. And that's because the US economy is expected to grow at 3% for the 2nd quarter after contracting by 2.9% in the 1st quarter. Some US economists feel that the growth is more sedate at 1% (here).


Chart 4: DJIA's weekly chart as at Aug 8, 2014 (Source: Stockcharts.com)


Chart 5: SPX's weekly chart as at Aug 8, 2014 (Source: Stockcharts.com)

Let's hope that the US stock markets will not join their European brethren by heading south. If that were to happen, then we could see a global equity market correction for the next few months.

Petgas: Bottom-line inched up due to higher top-line

Results Update

For QE30/6/2014, Petgas's net profit increased by 4% q-o-q but dropped by 54% y-o-y to RM435 million while its revenue declined by 5% both q-o-q & 18% y-o-y to RM1.102 billion. The sharp drop in net profit y-o-y was due to recognition of deferred tax assets arising from investment tax allowance granted for Regasification Terminal amounting to RM 592 million in QE30/6/2013.

Compared to the immediate preceding quarter (QE31/3/2014), Revenue increased by RM48 million to RM1.102 billion mainly driven by higher gas transportation & gas processing revenue from new Gas Processing Agreement & Gas Transportation Agreement. PBT rose by RM36 million primarily due to higher revenue but partially offset by higher other operating expenses.


Table: Petgas's last 8 quarterly results


Chart 1: Petgas's last 32 quarterly results

Valuation

Petgas (closed at RM22.20 last Friday) is now trading at a PE of 27x (based on last 4 qusrters' EPS of 82 sen). At this PE multiple, Petgas is deemed fully valued.

Technical Outlook

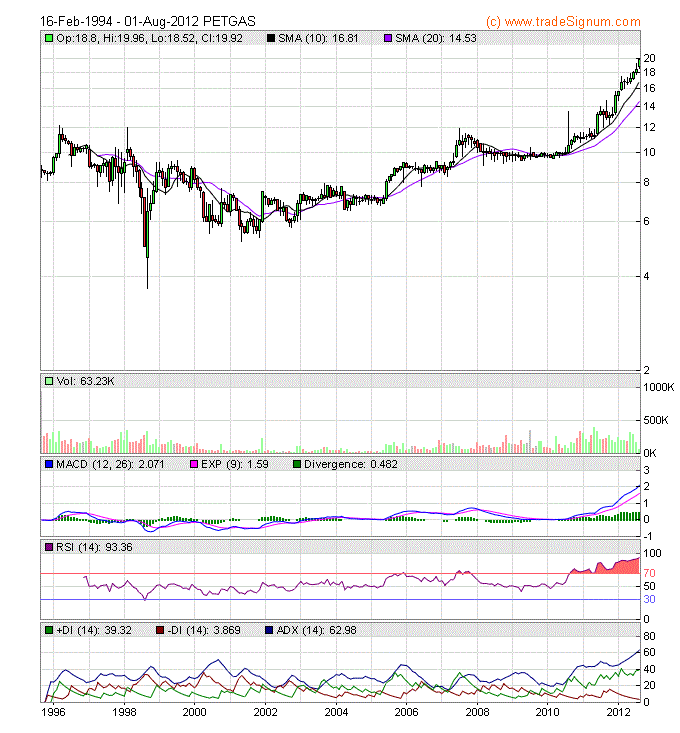
Petgas is still in a steady uptrend (see Chart 2). A closer look at the daily chart (Chart 3) will revealed that the long-term uptrend line has been violated. Petgas did not stage a quick rebound as it did in August 2013. Technically speaking, Petgas's outlook is now mildly bearish.
 

Chart 2: Petgas's weekly chart as at August 8, 2014 (Source: Tradesignum) 


Chart 3: Petgas's daily chart as at August 8, 2014 (Source: Tradesignum) 

Conclusion

Despite the good financial performance, Petgas is rated a HOLD due to its expensive valuation & its mildly negative technical outlook.

Note: 
In addition to the disclaimer in the preamble to my blog, I hereby confirm that I do not have any relevant interest in, or any interest in the acquisition or disposal of, Petgas.

Friday, August 08, 2014

Market Outlook as at August 8, 2014

The sudden drop in the market took many by surprise. From Chart 1 & 2, we can see that the drop is due primarily to weakness amongst the blue chip stocks. FBMKLCI is now very close to its uptrend line support at 1830-1835. Meanwhile FBMEmas is comfortably above its uptrend line. Despite the 30-point drop in FBMKLCI (at 2:40pm), the market uptrend is still intact.


Chart 1: FBMKLCI's weekly chart as at Aug 8, 2014_3:00pm (Source: BTX)


Chart 2: FBMEmas's weekly chart as at Aug 8, 2014_3:00pm (Source: BTX)

Yesterday, I was looking at the drop in my postings on Nexttrade. I remembered being asked by a reader whether the drop in my postings reflects my concern about the market. I explained that there were other reasons besides being hesitant to make my calls on stocks.

When I plot my postings in chart form & put it next to FBMKLCI chart, I noticed that as the market trends higher, I have a tendency to slowly pullback (by posting less). That happened in late 2007 and early 2011, when the market reached a peak before market reversed or correction set in. I noticed that it has happened again in the past few months.

I wondered how much of the decline in postings in the past few months was due to other reasons (ie. being too busy with my social activities and my other work). My observation is that I would always post when I have something interesting to share. Thus, I believe that the divergence between declining nexttrade postings & the rising index could be a warning sign, like in late 2007 & early 2011. In my opinion, the market is very toppish and we should reduce our exposure to equity.


Chart 3: FBMKLCI's weekly chart as at Aug 7, 2014 & Nexttrade Postings (Source: BTX & Nexttrade)

Note:
In addition to the disclaimer in the preamble to my blog, I hereby confirm that I do not have any relevant interest in, or any interest in the acquisition or disposal of, FBMKLCI.

Petdag: Profit improved

Result Update

For QE30/6/2014, Petdag's net profit increased by 20% q-o-q but dropped 6% to RM186 million while revenue inched up 1% q-o-q or 6% y-o-y to RM8.368 billion. 
Revenue increased q-o-q by RM74 million to RM8.368 billion due to 2%-increase in sales volume but partially offset by 1%-drop in selling prices. Group operating profit increased by RM24 million to RM253 million. This is due to higher gross profit margin by RM30 million as a result of lower product cost of RM15 million  & higher volume contribution of RM15 million. Lower product cost was due to favorable timing differences of the MOPS prices compared to previous quarter.


Table: Petdag's last 8 quarterly results


Chart 1: Petdag's last 25 quarterly results

Valuation

Petdag (closed at RM20.00 yesterday) is now trading at a trailing PE of 28 times (based on last 4 quarters' EPS of 72 sen). Based on PE multiple, Petdag is expensive.

Technical Outlook

Petdag broke its uptrend line in early February (here). It failed to hold onto its horizontal support at RM23. It may have better luck with the current horizontal support at RM19.


Chart 2: Petdag's weekly chart as at Aug 7, 2014 (Source: Tradesignum)

Conclusion

Based on high valuation & bearish technical outlook, Petdag is best to be avoided. If you are having the stock, you should try to sell on the current rebound.

Note: 
In addition to the disclaimer in the preamble to my blog, I hereby confirm that I do not have any relevant interest in, or any interest in the acquisition or disposal of, Petdag.

Thursday, August 07, 2014

Taliwrk: Finally, the uptrend continues... I think

Taliworks Corporation is involved in water treatment, waste management, highway concession and construction.

Unlike most stocks that have recovered after the US Financial Crisis, Taliwrk's recovery only began in 2013. See Chart 1 & 2.

Chart 1: Taliwrk's monthly chart as at Aug 6, 2014 (Source: Chartnexus)

Chart 2: Taliwrk's weekly chart as at Aug 6, 2014 (Source: Tradesignum)

Despite the late start, Taliwrk does not seem to be any hurry to rise up. From the low of RM0.75 in April 2013, the stock rose to a high of RM1.25 a few times. The RM1.25 mark has capped the stock for a good 12 months- until today. See Chart 3.

Chart 3: Taliwrk's daily chart as at Aug 6, 2014 (Source: Tradesignum)

Today, Taliwrk broke above the RM1.25 horizontal line. This bullish breakout signals that the stock is likely to continue its tepid uptrend. Currently, the stock is trading at RM1.35.

Taliwrk's financial performance & position over the past 10 years can only be described as unexciting. We can see that Taliwrk's top-line is on a hesitating upward trajectory while its bottom-line is rather flattish.


Chart 4: Taliwrk's last 10-year P&L (Source: Equities Tracker)

Its financial position is deemed fairly satisfactory, with high current ratio (due to high receivables) and elevated gearing ratio.


Chart 5: Taliwrk's Current & Gearig Ratios over the last 10-year (Source: Equities Tracker)

With the water theme play now on full bloom, it's somewhat surprising that punters gave this stock a miss. Well, better late and never, they say. Let's see whether the investors who sold this stock in 2010-2012 knew something that those who bought in 2013-2014 did not.

Based on technical consideration, Taliwrk could be a good trading BUY.

Note: 
In addition to the disclaimer in the preamble to my blog, I hereby confirm that I do not have any relevant interest in, or any interest in the acquisition or disposal of, Taliwrk.

MISC: Bottom-line heading south again?

Result Update

In QE31/3/2014, MISC's net profit dropped by 41% q-o-q or 4% y-o-y to RM288 million while revenue improved by 11% q-o-q & y-o-y to RM2.538 billion. Revenue increased q-o-q due to higher revenue in the Heavy Engineering following progress on projects in hand during the quarter. PBT dropped q-o-q due to an operating losses incurred in Petroleum business due to the decline in freight rates.


Table: MISC's last 8 quarterly results


Chart 1: MISC's last 33 quarterly results


Chart 2: BDI's weekly chart as at Aug 1, 2014 (Source: Investmenttools.com)

Valuation

MISC (closed at RM6.73 yesterday) is now trading at a PE of 13x its FY2013 EPS of 51 sen. Due to renewed weakness in shipping rates and the continued poor performance of its heavy engineering division (under MMHE), MISC's earnings would remain weak for the near term.

Technical Outlook

From the weekly chart, we can see that MISC is in an uptrend. A break below the RM6.30 level could signal a change in the trend, from uptrend to sideways (or even downtrend).


Chart 3: MISC's weekly chart as at Aug 6, 2014 (Source: Tradesignum)

Conclusion

Based on poorer financial performance and challenging operating environment- albeit a still positive technical outlook - MISC is now rated a HOLD. That rating would change to REDUCE if the share price were to breach the RM6.30 mark.

Note:
In addition to the disclaimer in the preamble to my blog, I hereby confirm that I do not have any relevant interest in, or any interest in the acquisition or disposal of, MISC.

Tasco: Top-line & Bottom-line at record high

Result Update

For QE30/6/2014, TASCO's net profit increased by 95% q-o-q or 74% y-o-y to RM10 million while revenue increased by 16% q-o-q or 29% y-o-y to RM135 million.


Revenue increased q-o-q due to better performance in both International Business Solutions ('IBS') and Domestic Business Solutions ('DBS'), which recorded increased revenue of RM4.7 million (10.6%) and RM14.0 million (19.5%) respectively.

Within the IBS, the Air Freight Forwarding division posted revenue increase of RM4.4 million (13.4%), from RM32.9 million to RM37.3 million. The increase was driven by a surge in export volume by handling urgent shipments by air arrangement compared to last preceding quarter.

Within the DBS, the Contract Logistics ('CL') division posted an increase of RM7.3 million (12.5%) and Trucking division also posted an increase of RM6.8 million (48.9%). Seasonal increase in shipments of E&E goods coupled with a new FMCG customer contributed significant increase in warehouse, in-plant and haulage business in this quarter.

PBT increased by RM4.8 million (57.2%),  from RM8.5 million to RM13.3 millions. This came mainly from the CL division (under DBS) which registered an increase of PBT of RM4.1 million (49.4%).


Table: TASCO's last 8 quarterly results


Chart 1: TASCO's last 30 quarterly results

Valuation

TASCO (closed at RM2.57 yesterday) is now trading at a PE of 8.6 times (based on last 4 quarters' EPS of 30 sen). At this multiple, TASCO is deemed attractively valued for a mid-cap stock with strong growth of 20% in the past 1 year.

Technical Outlook

TASCO is in an uptrend line (see Chart 2). Tasco has been trapped within a symmetrical triangle, ABC for the past 4 months (see Chart 3). Recently, it broke below that triable at RM2.60. This negative development (a bearish breakout of a triangle) must be rectified soon. At the time of writing this post (9:15am), Tasco recovered to RM2.76. That's a positive development (a bullish breakout of a triangle at RM2.70).


Chart 2: TASCO's weekly chart as at Aug 6, 2014 (Source: Tradesignum) 

 
Chart 3: TASCO's daily chart as at Aug 6, 2014 (Source: Tradesignum)

Conclusion

Based on good financial performance, fairly attractive valuation & still positive technical outlook, TASCO's rating is revised from HOLD to a BUY.

Note: 
In addition to the disclaimer in the preamble to my blog, I hereby confirm that I do not have any relevant interest in, or any interest in the acquisition or disposal of, TASCO.

10 Malaysian Firms That Made Forbes’ Best Under A Billion

Every year, Forbes published its Asia's 200 Best Under A Billion list which "highlights 200 top-performing Asia-Pacific companies with less than $1 billion in sales and consistent top- and bottom-line gains". This year, the companies that made it to this list are listed below:


 For more, go to the article in Forbes magazine (here) or  the complete listing (here). For companies that made it to this listing in the past two years, go to 2013 list  & 2012 list.

If I have to pick one stock from the 2014 listing, it would be TuneIns. This stock is in an uptrend. It broke above its horizontal line at RM2.40 and may re-test its May high of RM2.57.

Chart: TuneIns's weekly chart as at Aug 6, 2014 (Source: Chartnexus)

Note: 
In addition to the disclaimer in the preamble to my blog, I hereby confirm that I do not have any relevant interest in, or any interest in the acquisition or disposal of, TuneIns.

Wednesday, August 06, 2014

Gtronic: Profit keeps rolling in

Result Update

For QE30/6/2014, Gtronic's net profit increased by 23% q-o-q & y-o-y to RM17.3 million while revenue increased by 9% q-o-q or 6% y-o-y to RM91 million.

Revenue increased q-o-q due to increased revenue from the Singapore segment, from RM24.8 million to RM28.9 million (increase of 16.5%). Malaysia segment recorded the highest revenue of RM58 million for the quarter, an increase of 4.7% as compared to the last quarter.

The higher net profit achieved (23% improvement q-o-q) was mainly due to higher volume loadings from most of the Group's customers, better economy of scale coupled with productivity improvement & cost control programme carried out in the Group.


Table 1: Gtronic's last 8 quarterly results

Looking at Chart 1 below, one can't help but admire Gtonic. This is a company that grows its top-line not at the expense of its bottom-line. In fact, its profit margin is steadily rising. You can only do that if you are ahead of your competitors and are able to command premium pricing.


Chart 1: Gtronic's last 29 quarterly results
  
Valuation 

Gtronic (closed at RM4.65 yesterday) is now trading at a PE of 22 times (based on last 4 quarters' EPS of 21.5 sen). At that PE multiple, Gtronic is deemed fairly valued.

Technical Outlook

Gtronic has been in a steady uptrend after breaking above its Cup-with-handle formation in early 2013. The stock is presently trading in overbought territory and could face short-term profit-taking. If the profit-taking is not excessive, the stock may continue its uptrend to test its 2000 high of RM5.00.


Chart 2: Gtronic's weekly chart as at Aug 5, 2014 (Source: Tradesignum)


Chart 3: Gtronic's monthly chart as at Aug 5, 2014 (Source: Chartnexus)

Conclusion

Based on good financial performance, Gtronic remains a good stock for long-term investment. Its upside potential is limited as it is trading at fair valuation.

Note: 
In addition to the disclaimer in the preamble to my blog, I hereby confirm that I do not have any relevant interest in, or any interest in the acquisition or disposal of, Gtronic.

Tasek: Solid Performance!


Background


Tasek Corporation Bhd ('Tasek') manufactures ordinary portland cement and masonry cement which are sold in bulk or in 5-kg bags. It has a cement plant with annual capacity of 2.3 million MT located in Tasek Industrial Estate in Ipoh. In addition, Tasek also has a ready-mixed concrete division.

For 1H2014, cement & concrete divisions accounted for 76% & 23% of its revenue, respectively. All the operating profit of the group came from the cement division, while concrete & other divisions incurred small losses.

Recent Financial Results

We can see below that Tasek's revenue has been rising steadily in the past 6 quarters. With profit margin relatively stable, the rising revenue translates into rising profit.


Table: Tasek's last 8 quarterly results

 
Chart 1: Tasek's last 25 quarterly results 

High Dividend Payout

Tasek pays out high dividend last year, totaling 152 sen (see Chart 2). From Chart 3, we can see that Tasek's strong operating cashflow allowed the company to pay the high dividend while at the same time, keeping about cash holding at an adequate level of RM20-30 million.

 
 Chart 2: Tasek's DPS for last 25 quarterly results 


Chart 3: Tasek's last 10 years' cashflow & cash holding
 
Valuation

Tasek (closed at RM14.90 yesterday) is now trading a PE of 16.7 times (based on last 4 quarters' EPS of 89 sen). At this PE multiple, Tasek is deemed fairly valued. However, for investors who are looking for a good income stock, Tasek can be considered as it has a dividend yield of about 8% (based on FY13 DPS of 122 sen, excluding special dividend of 30 sen.

Technical Outlook

Tasek is in a long term uptrend. It has been consolidating in a reverse pennant formation. An upside breakout at RM16 could signal the continuation of the prior uptrend.


Chart 4: Tasek's weekly chart as at Aug 5, 2014 (Source: Tradesignum)

Conclusion

Based on good financial performance, attractive dividend yield and mildly positive technical outlook, Tasek is rated a HOLD. Tasek is a good stock to consider for investors looking for an income stock.

Note: 
In addition to the disclaimer in the preamble to my blog, I hereby confirm that I do not have any relevant interest in, or any interest in the acquisition or disposal of, Tasek.

Tuesday, August 05, 2014

Steel stocks poised for recovery

Annjoo broke above the horizontal line at RM1.30 yesterday. It continued to rally today, to close at RM1.42. Its next strong resistance is at the horizontal line at RM1.60.


Chart 1: Annjoo's weekly chart as at Aug 4, 2014 (Source: Tradesignum)

Is this the beginning of recovery for the steel sector? We can see from the next 3 charts - LionInd, Kinstel & Perwaja -  that these steel stocks are all poised to test their long-term downtrend line. In fact, LionInd & Kinstel have broken above its downtrend line.

Based on technical consideration, Annjoo could be trading BUY. LionInd and Kinstel may follow suit, after a brief bottoming phase.


Chart 2: LionInd's weekly chart as at Aug 4, 2014 (Source: Tradesignum)


Chart 3: Kinstel's weekly chart as at Aug 4, 2014 (Source: Tradesignum)


Chart 4; Perwaja's weekly chart as at Aug 4, 2014 (Source: Tradesignum)

Note:
In addition to the disclaimer in the preamble to my blog, I hereby confirm that I do not have any relevant interest in, or any interest in the acquisition or disposal of, Annjoo, LionInd, Kinstel & Perwaja.

WCT: Poised for recovery


WCT broke above its intermediate downtrend line, RR at RM2.20 yesterday. With this upside breakout, WCT is likely to begin its slow recovery. This has happened before in 2012 when it broke above its then intermediate downtrend line, R1-R1.

Based on upside breakout, WCT could be a good trading BUY.


Chart: WCT's weekly chart as at August 4, 2014 (Source: Tradesignum)

Note:
In addition to the disclaimer in the preamble to my blog, I hereby confirm that I do not have any relevant interest in, or any interest in the acquisition or disposal of, WCT.

Wednesday, July 30, 2014

MAS: This phoenix will not rise from the ashes unless...

I have received inquiries from time to time on many stocks. One name that comes up often is MAS. The question raised is whether this is a good time to buy MAS. My short answer has always been the same: There is never a good time to buy MAS.

Before I tell you why, let me tell you a short story. When I was working in Lee Wah Bank (now, merged into the UOB) in 1990, I knew of a customer who had 500,000 MAS shares. MAS was then trading at around RM10. This customer, who was a businessman of substantial means, pledged the block of MAS shares to the bank for a credit line. To give you a sense of the value of that block of MAS shares of RM5,000,000, you need to know that one bungalow in Pantai Hill in 1990 was worth about RM500,000. Today, a similar bungalow in Pantai Hill is worth at least RM5,000,000 each. Thus, 10 bungalows in Pantai Hills wirth RM5,000,000 in 1990s would be worth RM50 million today.

However, if the said customer has held onto his MAS shares and subscribed for the 3 Rights Issues carried out in 2003, 2007 & 2010, his investment in MAS would be worth only RM1.6 million! That's after spending RM3.1 million to subscribe for the 3 Rights Issue and holding onto his initial investment worth RM5.0 million in 1990s.


Table: MAS's investment performance since 1990


Chart 1: MAS's monthly chart as at July 25, 2014 (Source: Chartnexus)

In investing, we like to look out for recovery play. Who wouldn't want to get into Apple at USD4 in 1990s and to see the stock rallied to USD700 in 2012 (before it split 1-to-7 in June this year). Can MAS be an Apple?

I appended below 3 charts:
1. Profit & Loss chart shows that MAS is a company that has been threading on water even in good times.


Chart 2: MAS's topline & bottom-line for the past 13 years (Source: Equities Tracker & Nexttrade)

2. Cashflow chart shows that MAS can hardly generate positive operating cashflow. The only outstanding year was FY2007 when it generated an operating cashflow of RM2.37 billion. That can be explained by the followings:
  • Profit of RM841 million (contributed by Residual Value sharing on sale of aircraft by Penerbangan M'sia Bhd of RM209 million & gain on sale of properties of RM105 million)
  • Increase in Trade & Other Payables of RM477 million
  • Increase in Sales in advance of Carriage of RM613 million
In another word, MAS's operation had continuously drained its resources. In a world of scarce resources, MAS is a luxury that we cannot afford. The 3 Rights Issues had cost investors a total of RM7.66 billion. How much more must we spend before MAS can get its house in order?


Chart 3: MAS's cashflow for the past 12 years (Source: Equities Tracker & Nexttrade)

3. From the Current Ratio & Gearing Ratio chart below, we can see that if MAS does not raise fund from time to time, its financial position would be untenable. It would not surprise me if MAS were to propose another Right Issue in 2015.


Chart 4: MAS's  Current & Gearing Ratios for the past 10 years (Source: Equities Tracker)


Diagram: MAS's entitlements over the years

The question that must be asked - and, I am sure it had been asked many times in the past 6-7 years -is how to make MAS a viable airline? Well, what have we not tried? We've tried privatization! We've tried asset-light model! We've tried to ramp up load factor by lowering prices!It all failed.

For the sake of Malaysian taxpayers, let's stop kicking the can down the alley and let's bite the bullet. Let's try "bankruptcy" (or, whatever legal form that's available in Malaysia) and then a true restructuring where every stakeholder will share the losses or pain equitably. If we try this, MAS may rise again one day, like the proverbial Phoenix from the ashes.

Meanwhile, investors should avoid this stock. If there is no true restructuring, MAS will continue to bleed. If there is courage to undertake a true restructuring, you will have to take your losses immediately. This is a no-win situation!

********************************************************************************

My take on MAS as an investment does not detract from my personal feeling regarding the senseless loss of 295 innocent lives in the tragic incidence that brought down flight MH17. The world must bring the perpetrators of this cruel criminal act to justice.


Note:
In addition to the disclaimer in the preamble to my blog, I hereby confirm that I do not have any relevant interest in, or any interest in the acquisition or disposal of, MAS.

Monday, July 28, 2014

Selamat Hari Raya


I like to wish all Muslim readers prosperity and happiness on the special occasion of Hari Raya Aidilfitri. May your home and heart be blessed with joy and peace.


(Source: Panasonic-aec.com)